Jacky Liu's Blog
Python 3 比 Python 2 最大的改进
---- Python 3 到底比 Python 2 好在哪里?初学的时候以为是诸如 字符串处理方式 啊,新添的 queue 组件啊这些特性,要么就干脆我用的就是最好的,说实话都十分没底。不过一路用下来,感觉现在应该有了正确答案了。Python 3 比 Python 2 最大的改进在哪里?那就是 ——
Python 3 程序可以用中文来写
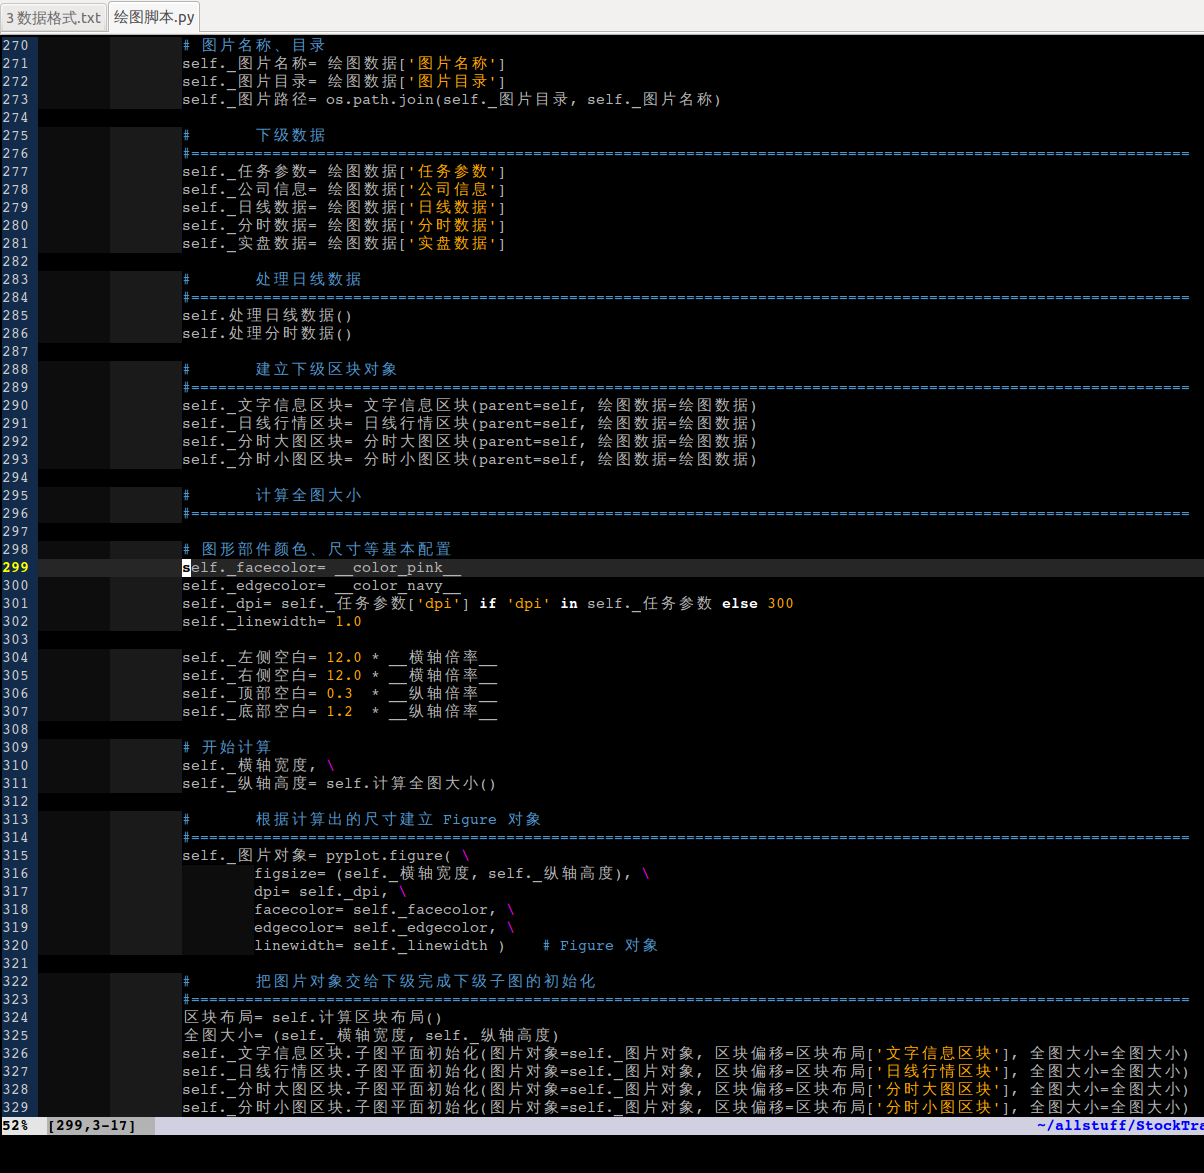
---- 哈哈哈 太爽了 太爽了 太爽了 太爽了 太爽了 太爽了太爽了 太爽了 太爽了太爽了 太爽了 太爽了 太爽了 太爽了太爽了 太爽了 太爽了太爽了 太爽了 太爽了 太爽了 太爽了太爽了 太爽了 太爽了太爽了 太爽了 太爽了 太爽了 太爽了太爽了 太爽了 太爽了 ~~~~~~~~~~~~~~~~~~~
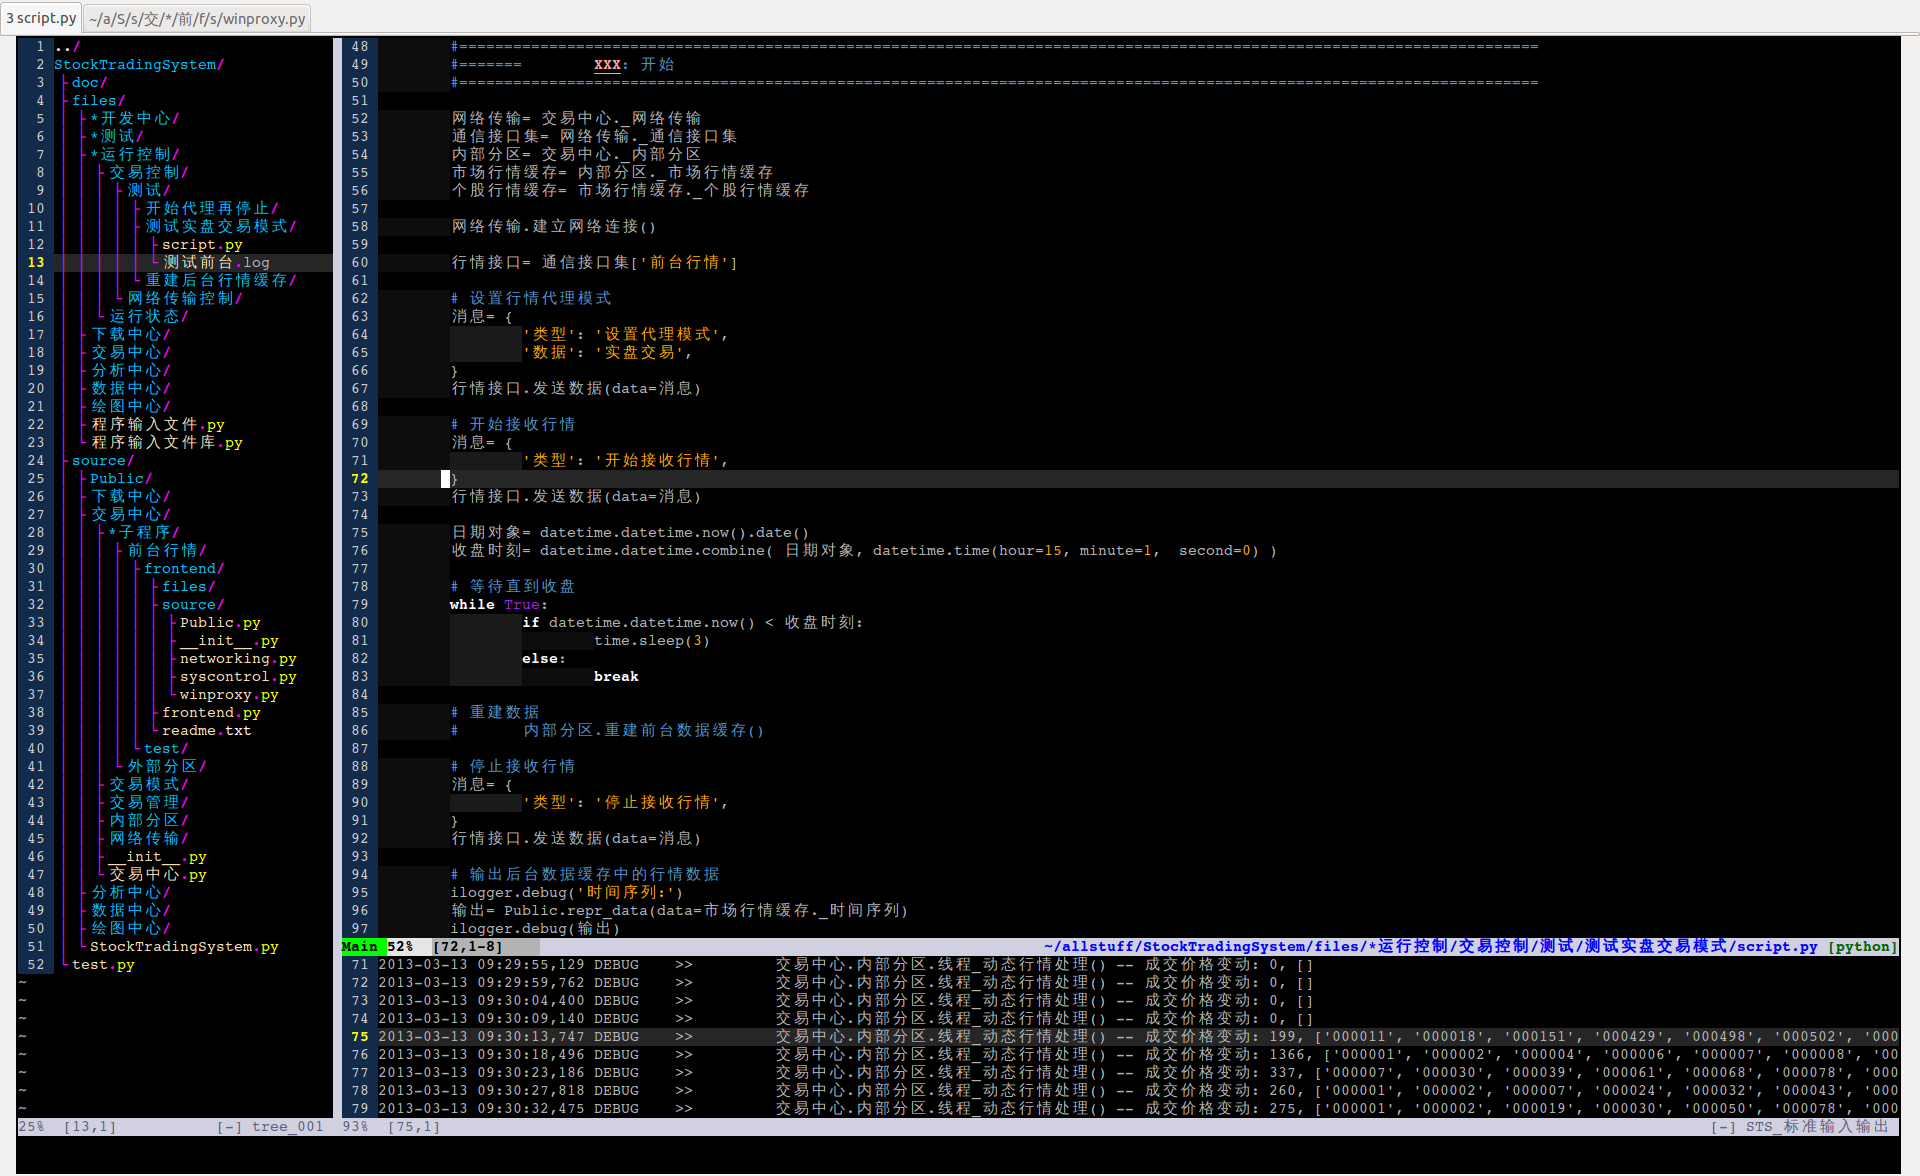
实盘行情测试
---- 实盘行情代理初步测试成功,发个图留作纪念。
神器 Selenium 专治上交所妖蛾子
---- 上交所又出妖蛾子了,前一阵子股票列表查询页面的 url 又不能用,第三次了。
---- 一直以来我都从上交所网站上抓取股票列表信息。网站对应的页面用的是动态技术,网址是由 javascript 生成,对访问者隐藏的。没关系,用抓包分析,就能看见如下一个网址:
http://www.sse.com.cn/sseportal/webapp/datapresent/SSEQueryStockInfoAct?reportName=BizCompStockInfoRpt&PRODUCTID=&PRODUCTJP=&PRODUCTNAME=&keyword=&tab_flg=1&CURSOR={cursor}
{cursor}是替换部分,程序只要替换成每页的起始偏移就能抓取到全部的股票列表。但是过了一年多以后,这个 url 不能用了。
---- 仍然抓包,发现这次访问的 url 是如下形式:
http://query.sse.com.cn/commonQuery.do?jsonCallBack=jsonpCallback51734&isPagination=false&sqlId=COMMON_SSE_ZQPZ_GPLB_MCJS_SSAG_L
这次还真是改进。与前面那个需要翻页不同,这个只要一次访问就返回全部股票列表,两边都省事,而且返回字串是符合 Python 语法的,一个 eval() 函数就能转化成 Python 数据格式。可是好景不长,几个星期之后这个 url 又不能用了。
---- 再来,这回发现 url 改动不大,只是 "jsonpCallback" 后面那一个数字也变成了动态的,每一次访问都不一样。这样一来,除非程序里也包含 javascript 引擎,能根据页面里的 js 代码算出那个值是多少,否则别想获取完整的股票列表了。就算这种方式也只是理论上可以,现实有没有途径还不知道。
---- 这种改动很微妙,目测其目的就是为了防止我这样的人用程序抓取它的页面信息。大概只要你访问了他的网站,他就自动假设你是个小散,而小散当然只配用手一页页翻着看。给机构和服务商都提供有专用的高速数据接口,一年几十万数据费不过湿湿碎而已。相比之下,深交所是把所有股票的代码、简称、公司信息都做成一张表,方便下载。上交所真够有心计。
---- 上交所到底属于什么性质真不好说。不过我总觉得,它多少应该带这么一点公共服务的性质。既然不准各地都建交易所,互相竞争,谁的服务好就到谁那里去上市,既然全国只有两个交易所,上市公司只有两千多家,一个 IPO 券商要收几千万。那么交易所在高价贩卖行情信息之余,稍微附带地给大众提供那么一点免费的服务,比如说查询一下上市股票有多少个,叫什么名字,代码多少之类,应该是理所当然的吧?
---- 既然要提供的话,就像深交所那样,做个列表给大家下载,你的服务器也能减轻负担,因为只要一次访问就成,小散们用着也方便,这也毫不过分吧?
---- 但是现实中奈何不了小人。不仅不提供下载,还想办法禁止老子抓取。禁NMGB。什么 javascript 老子是一概不懂的,就算懂也没功夫跟小人玩猫捉耗子。一通 Google 之后,搜到了一个神器: Selenium。神器是干什么的呢?官网里说的明白:
"Selenium automates browsers. That's it."
在老子看来,就是专门对付小人用的。
---- 代码,不到 60 行就搞定。注意 Selenium 还不支持 py3,这些是 py2 的:
# -*- encoding: utf-8 -*-

import sys
import pickle

import selenium

from selenium.webdriver.support.ui import WebDriverWait			# available since 2.4.0
#	from selenium.common.exceptions import TimeoutException
#	from selenium.webdriver.support import expected_conditions as EC	# available since 2.26.0

def wait_condition_01(driver):
	return driver.find_element_by_id('dateList_container_pageid')

def extract_table(driver, stocklist):
	tag_table= driver.find_element_by_class_name("tablestyle")
	tabletext= tag_table.text
	stocklist.extend(tabletext.split('\n')[1:])

driver= selenium.webdriver.Firefox()
driver.get("http://www.sse.com.cn/assortment/stock/list/name/")

stocklist= []
extract_table(driver=driver, stocklist=stocklist)

tag_meta= driver.find_element_by_id("staticPagination")
attr_total= int(tag_meta.get_attribute("total"))
attr_pageCount= int(tag_meta.get_attribute("pageCount"))

# 逐页提取内容
for pagenr in range(2, attr_pageCount+1):
	id_input= 'dateList_container_pageid' if pagenr > 2 else 'xsgf_pageid'
	id_button= 'dateList_container_togo' if pagenr > 2 else 'xsgf_togo'

	tag_input= driver.find_element_by_id(id_input)
	tag_button= driver.find_element_by_id(id_button)
	tag_input.send_keys(str(pagenr))
	tag_button.click()
	WebDriverWait(driver, 10).until(wait_condition_01)

	extract_table(driver=driver, stocklist=stocklist)

# 向主调进程发送结果
data= {
	'个股总数': attr_total,
	'个股列表': stocklist,
}

driver.quit()
pdata= pickle.dumps(data, protocol=2)
sys.stdout.write( pdata + b'\n' )
---- 这下,除非你上交所的网站彻底不开了。否则老子就是要自动抓取你的股票列表。看着办吧。
新电脑装机备忘
---- 过年后又淘了一个二手 Thinkpad W500。我喜欢 16:10 的高分屏,现在这种屏幕基本已经绝迹了,代之以缩水的 16:9,分辨率最高只有 1920×1080。为什么电脑屏幕会有这种奇怪的发展趋势?专业人士给出理由:
*. Innovative product concepts will drive a new product cycle stimulating the growth of the notebook PC and LCD monitor market.
(翻译: 真。乱倒垃圾可以刺激拣破烂行业的发展。厂商的选择就是你的选择,否则你没有选择。你被××了还必须叫爽。)
*. 16:9 provides better economic cut (panelization) in existing TFT LCD fabs.
(翻译: 唯一诚实的一条,面积缩水了可以节省成本。建议进一步往 160:9 发展,算术不会骗人。)
*. 16:9 products provide higher resolution and wider aspect ratio.
(翻译: 9 大于 10,1080 大于 1200,真实不假。既然 wider is better,仍然建议往 160:9 发展。)
*. The widespread adoption of High Definition in the consumer entertainment sector will help end users readily adopt the new products with the wider aspect ratio.
(翻译: 会用电脑顶个屁。电脑这个发明纯属多此一举,事实证明大部分人的电脑仍然是盗版电影和弱智电视节目的播放器。那些不用电脑来放宽屏影音却用来整乱七八糟东西的非人类理应被无视。)
*. The new 16:9 panels provide an opportunity for PC brands to further diversify their products.
(翻译: 这样 Dell 就可以对每个型号推出 16:10 版和 16:9 版。不用做多投入,产品线瞬间扩大一倍。烂摊子多好呀,收拾它能锻炼身体呢。)
来源: http://www.displaysearch.com/cps/rde/xchg/SID-0A424DE8-28DF6E59/displaysearch/hs.xsl/070108_16by9_PR.asp
---- 不多说了。我要用电脑看网页写文档,我喜欢屏幕纵向高一点。从 16:10 到 16:9,被裁掉的 120 像素像是从你兜里掏走的 120 块。恼人的是,丫们还编出上面一套狗屎来给你洗脑。
---- 另外,IC 工艺的尺寸进化几年前已经基本到头,3.5G 左右的主频大概会是个天花板。因为成本的关系,增加内核数也不会是发展方向。“云”一类东西听上去就虚无飘渺,先不说。今后 Intel 和 NVidia 们可能主要会在体系结构上动脑筋,结合 DirectX 一类外包装,老酒新瓶,争取在后摩尔定律时代持续创收吧。
<补记:错鸟!摩尔老人家威武。下面是 ITRS 的路线图,来自 Wikipedia,看来尺寸进化还远没有到头 ~>

---- 以下是装机需要注意的:
*. Ubuntu 安装完成后先装语言支持和 fcitx。装好后在 系统控制>>语言 里把默认输入法选成 fcitx。
*. fcitx 装好后在 ~/.profile 末尾添加以下内容才可以用:
export XMODIFIERS="@im=fcitx"
export XIM=fcitx
export XIM_PROGRAM=fcitx
export GTK_IM_MODULE=xim
export QT_IM_MODULE=xim
*. Python 装好以后,Selenium 和 Matplotlib 的安装都是通过 Python 进行的,按照它们官网的安装说明一个
Python 命令就行了,很简单。
*. 无线互联: 两台电脑以 Ad hoc(点对点)方式互联,步骤如下:
1. 在 Ubuntu 下通过 Network Manager 新建一个无线网络,类型已被默认为 "Ad hoc"。IPv4 Setting
里全用默认设置,尤其是 Method 一项默认为 "Shared to other computers",不要动。
2. 设无线密码,WEP 128 位加密的密码长度必须是准确的 13 个字符。Network Manager 不会检查,Win7
会。如果不设成 13 位,从 Win7 那边连接时会有问题。
3. 建好以后在终端里通过 ifconfig 命令查看本机在新建网络里的网址和子网掩码。比如两者分别为:
10.42.0.1 和 255.255.255.0
4. 从 Win7 那边连接这个新建的无线网络,连上以后手动设置 IPv4 地址。前三段必须与 Ubuntu 新建
时获得的地址相同,比如设成 10.42.0.2,子网掩码也跟 Ubuntu 这边一样。设好以后,从两边就应
该能够 ping 到对方了,这样就算把无线网设置完成了。
*. 文件共享,主要是从 Ubuntu 上访问 Win7,参考文章在这里:
http://www.liberiangeek.net/2012/05/windows-7-vs-ubuntu-12-04-how-to-enable-advanced-file-sharing
关键如下:
1. 在 Win7 下建一个叫 jacky 的账户,设好密码(不设好像还不行,因为 Samba 必须要设)
2. 在 Win7 下对目标文件夹设好共享,也就是对 jacky 开放权限。
3. 在 Samba 下也建一个叫 jacky 的账户,设好相同的密码。
4. 然后打开文件浏览器 Nautilus,选 Go >> Location,地址输入: smb://10.42.0.2/ 应该就能看见
Win7 上的共享内容。
Python asyncore / asynchat 基本传输实验
---- 自从上回实验了 Python socket 的基本传输之后又受了些启发,于是想试试基于 non-blocking socket 的通信机制。Python 标准库里的 asynchat 自然是第一步。昨天写的实验程序实现了基于 asynchat 的基本通信,把前因后果总结一下:
实验前的考虑
---- 用 non-blocking socket 最基本的考虑自然是传输效率,尤其是遇到一大坨数据过来的时候,希望它能尽快传送完,这时最好其它线程通通都停掉,在传完之前不要再无谓地换来换去(反正其它线程此时应该也没甚实际工作要干),当然这只是愿望而已。既然做不到,就只能追求尽量快速的传输方式了。
---- 查资料得出的印象是 non-blocking socket 当然比较快,但是好的东西总是有代价,这是源于我个人的印象。因为非阻塞意味着没有延时,而没有延时环节的无限循环跑起来可能会很耗 CPU。但是另一方面来讲,既然非阻塞 socket 已经用得这么多,意味着底层实现很可能已经解决了这个问题,我的担心很可能是不成立的。这个还是要试试才知道。
结果总结
1. 关于 CPU 使用
---- 实验的结果,当服务端非正常退出以后,使用 asynchat 的客户端好像就会陷入死循环,没有任何异常的迹象,所以此时 polling loop 应该还是在运行的,而 CPU 使用并没有明显高于平时的水平,所以 non-blocking socket + polling loop 应该对 CPU 并没有特别大的压力,当然如果开十个 polling loop 可能会是另外一回事。
2. 对坏连接的处理
---- 关于死循环,这实际上就是一个网络通信模块有没有能力对付坏连接的问题。如果用 blocking socket,上一篇已经讲了,会抛出异常或返回 b'',编程时就可以做相应处理,而死循环显然不是个很讨喜的行为方式。我想了一下如果直接用底层的 select() 函数时会发生什么。因为我曾经在进程间通信的特性中体验过 select() / pooling loop 的用法,这里用作网络传输时应该也差不多。
---- 如果一个进程(或者网络连接)还没吱一声就挂了,那么与它相关的 fd(或 socket)应该仍然会被 select() 放在有效列表里返回,但是后续的 read()(或 recv())操作就会读到一个空的对象,这时你就知道这个进程或连接已经挂了。再看 asynchat 提供的那些寥寥的接口: 好像 collect_incoming_data() 跟 recv() 也差不多,能不能在里面判断,当 data 参数是空的就说明连接已经挂了呢?试了一下,不行。collect_incoming_data() 的 data 参数总是有效的,也就是说读不到内容时这个函数根本不会被调用。
---- 如果再要深究下去大概要去看 asynchat.py 了,但问题是 asynchat 完全是用 Python 写的而且只有几百行而已,它应该木有那么多考虑在里面,我想有这功夫还不如直接去试验 select()。
3. 在运行中更新连接
---- 另一个很重要的问题,我觉得网络通信模块应该提供在 pooling loop 运行的时候动态添加或删除连接的功能,但是很显然 asynchat 并没有这个特性的接口。试着动点脑筋 —— 因为连接对象是通过 asyncore.loop() 的一个参数: map 来传递的,能不能动态修改它呢?文档里说了 map 参数是普通的 dict 类型,dict 当然没有线程安全性,也就是说从 asyncore.loop() 所在的线程之外的地方动它肯定会让 loop() 崩溃。如果在同一个线程内呢?行不行呢?这大概又要去看 asyncore.py 了,卟啦卟啦 。。。如果有这功夫,卟啦卟啦 。。。
所以,总结的总结:
---- 我觉得上面的 2 跟 3 对于一个网络传输组件来说应该算是很基本的功能。如果缺了这两个功能,那这个网络传输组件应该没太大实际用处,大概只能用在一次性程序里。但是实话讲我对异步网络传输的了解还浅得很,俩月前我还不知道 socket 是什么,也不知道局域网该怎么连,所以以上这些都不是很确定。眼下先跑起来,以后有机会再修正吧。
---- 实验程序:
# -*- encoding: utf-8 -*-


'''
实验平台:
	Ubuntu 12.04 LTS / Linux 3.2.0-25-generic-pae

实验目标:
	1. asynchat 模块的基本传输机制
	2. 让服务端在未关闭 socket 的情况下终止运行,模拟连接异常中断的情况,检视后续行为。

实验过程:
	1. 另起一个进程作为服务端,服务端仍然用 blocking socket + 多线程的方式,针对每个连接开启一个
	发送线程和一个接收线程。服务端的任务是向客户端发送数据(一次 3 Mb)并接收客户端的回执。

	2. 主进程内建立客户端对象并向服务端发起指定数目的连接。客户端使用 asynchat 模块,背后的机制
	是 non-blocking socket + select()。连接建立以后向服务端发送一条 'start' 消息,通知服务端开始
	发送,之后从服务端接收数据,收完一条之后发送一个回执。

	3. 服务端完成指定次数的发送以后,在未关闭 socket 的情况下退出运行,检视后续的行为。

实验结果:
	1. 客户端使用 asynchat 模块实现了基本传输功能。服务端非正常退出以后 CPU 使用一直保持低水平,
	此时 polling loop 应该是在运行的,所以 non-blocking socket + polling loop 的方式应该对 CPU
	并没有太大压力。

	2.1. 如果服务端发送线程选择未关闭 socket 就退出,那么 asyncore.loop() 就会死循环,不抛出异常
	2.2. 如果服务端发送线程选择先关闭 socket 再退出,那么 asyncore.loop() 就会抛出异常
'''


import asyncore
import asynchat

import socket
import multiprocessing
import time
import threading


__host_server__= '127.0.0.1'
__port_server__= 9000

__host_client__= '127.0.0.1'


__消息内容__= b'head' + b'.' * (3 * 2**20 - 8) + b'tail'	# 一次 3 Mb
__结束标志__= b'\r<--EOM-->\r'
__发送次数__= 3
__连接个数__= 3
__接收缓存__= 2**15
__消息编码__= 'utf-8'


#================================================== ↓ 服务端 ↓ ==================================================

# 全局 socket,最后在主进程内关闭。
sock_server= socket.socket(socket.AF_INET, socket.SOCK_STREAM)
sock_server.bind((__host_server__, __port_server__))
sock_server.listen(1)	# 开始监听


def 服务端进程():

	服务端对象= 服务端()

	for i in range(__连接个数__):
		try:
			sock, addr= sock_server.accept()
		except:
			print('服务端进程() -- server socket 已关闭,监听进程退出 ...')
			break

		print('服务端进程() -- 接收到来自 ' + str(addr) + ' 的连接。')

		服务端对象.添加连接(addr=addr, sock=sock)

	time.sleep(0.3)		# 等所有发送线程开始运行

	服务端对象.join()

	# 服务端退出 ...
	print('服务端进程() -- 所有连接已终止,服务端进程退出 ...')


class 服务端:

	def __init__(self):
		self._连接集= {}

	def 添加连接(self, addr, sock):
		新连接= 服务端连接(addr=addr, sock=sock)
		self._连接集[addr]= 新连接

	def join(self):
		for conn in self._连接集.values():
			conn.join()


class 服务端连接:

	def __init__(self, addr, sock):

		self._addr= addr
		self._sock= sock
		self._buff= b''

		self._发送= False
		self._发送线程= threading.Thread(target=self._服务端发送线程, name='发送线程_'+str(self._addr), kwargs={})
		self._接收线程= threading.Thread(target=self._服务端接收线程, name='接收线程_'+str(self._addr), kwargs={})

		self._发送线程.start()
		self._接收线程.start()


	def _服务端发送线程(self):
		'''

		'''
		sock= self._sock
		addr= self._addr

		while not self._发送:
			time.sleep(0.3)

		print('_服务端发送线程() -- 与 ' + str(addr) + ' 的连接开始发送 ...')

		for i in range(1, __发送次数__+1):
			try:
				sock.sendall(__消息内容__ + __结束标志__)
			except:
				print('_服务端发送线程() -- 与 ' + str(addr) + ' 的连接已损坏,发送线程终止。')
				break
			print('_服务端发送线程() -- 与 ' + str(addr) + ' 的连接已发 ' + str(i) + ' 条。')

		print('_服务端发送线程() -- 与 ' + str(addr) + ' 的连接发送完毕,发送线程退出 ... ')

		time.sleep(3)

		# XXX: 非正常退出,未关闭 socket 的情况下就退出
		#	try: sock.shutdown(socket.SHUT_RDWR)
		#	except: pass
		#	sock.close()


	def _服务端接收线程(self):
		'''

		'''
		sock= self._sock
		addr= self._addr

		print('_服务端接收线程() -- 与 ' + str(addr) + ' 的连接开始接收 ...')

		while True:
			data= sock.recv(8192)

			if not data:
				print('_服务端接收线程() -- 与 ' + str(addr) + ' 的连接已损坏,接收线程终止。')
				break

			sidx= max(len(self._buff) - len(__结束标志__), 0)
			self._buff += data

			if __结束标志__ in self._buff[sidx:]:
				mlist= self._buff.split(__结束标志__)
				self._buff= mlist.pop(-1)

				for msg in mlist:
					msg= msg.decode(__消息编码__)
					print('_服务端接收线程() -- 接收到 ' + str(addr) + ' 发来的信息: "' + msg + '"')
					self._处理所收消息(msg=msg)

		try: sock.shutdown(socket.SHUT_RDWR)
		except: pass
		sock.close()


	def _处理所收消息(self, msg):

		if msg == 'start':
			self._发送= True


	def join(self):
		self._发送线程.join()
		self._接收线程.join()


#================================================== ↓ 客户端 ↓ ==================================================

class 客户端:

	def __init__(self):
		'''

		'''
		self._连接集= {}


	def 建立连接(self):
		'''

		'''
		for i in range(1, __连接个数__+1):
			addr= (__host_client__, 9000+i)
			self._连接集[addr]= 客户端连接(addr=addr)


	def start(self):
		'''

		'''
		for conn in self._连接集.values():
			conn.start()

		map= {conn._sock.fileno(): conn for conn in self._连接集.values()}
		polling_loop= threading.Thread(target=asyncore.loop, name='polling_loop', kwargs={'map':map})
		polling_loop.start()

		print('客户端.start() -- 客户端已开始运行 ...')


class 客户端连接(asynchat.async_chat):

	def __init__(self, addr):

		self._addr= addr
		#	self._sock= self.create_socket(socket.AF_INET, socket.SOCK_STREAM)
		self._sock= socket.socket(socket.AF_INET, socket.SOCK_STREAM)
		self._sock.bind(addr)
		asynchat.async_chat.__init__(self, self._sock)
		self._buff= b''
		self._msgs= []
		self.ac_in_buffer_size= __接收缓存__
		self.set_terminator(__结束标志__)
		self.connect( (__host_server__, __port_server__) )


	def collect_incoming_data(self, data):
		if not data:	# 说明连接已损坏
			print('客户端连接.collect_incoming_data() -- 连接 ' + str(self._addr) + ' 已损坏。')

		self._buff += data


	def found_terminator(self):

		msg= self._buff.decode(__消息编码__)
		self._msgs.append(msg)
		self._buff= b''

		print('客户端连接.found_terminator() -- 连接 ' + str(self._addr) + ' 共收到 ' + str(len(self._msgs)) + ' 条。')

		self.push( ('已收 ' + str(len(self._msgs)) + ' 条。').encode(__消息编码__) + __结束标志__ )


	def start(self):
		self.push(b'start' + __结束标志__)


#================================================== ↓ 主进程 ↓ ==================================================

# 启动监听进程
服务端进程对象= multiprocessing.Process(name='服务端进程', target=服务端进程)
服务端进程对象.start()


客户端对象= 客户端()
客户端对象.建立连接()
time.sleep(0.3)
客户端对象.start()
---- 以下是运行结果:
服务端进程() -- 接收到来自 ('127.0.0.1', 9001) 的连接。
服务端进程() -- 接收到来自 ('127.0.0.1', 9002) 的连接。
_服务端接收线程() -- 与 ('127.0.0.1', 9001) 的连接开始接收 ...
_服务端接收线程() -- 与 ('127.0.0.1', 9002) 的连接开始接收 ...
客户端.start() -- 客户端已开始运行 ...
_服务端接收线程() -- 接收到 ('127.0.0.1', 9001) 发来的信息: "start"
服务端进程() -- 接收到来自 ('127.0.0.1', 9003) 的连接。
_服务端接收线程() -- 接收到 ('127.0.0.1', 9002) 发来的信息: "start"
_服务端接收线程() -- 与 ('127.0.0.1', 9003) 的连接开始接收 ...
_服务端接收线程() -- 接收到 ('127.0.0.1', 9003) 发来的信息: "start"
_服务端发送线程() -- 与 ('127.0.0.1', 9001) 的连接开始发送 ...
_服务端发送线程() -- 与 ('127.0.0.1', 9002) 的连接开始发送 ...
_服务端发送线程() -- 与 ('127.0.0.1', 9002) 的连接已发 1 条。
_服务端发送线程() -- 与 ('127.0.0.1', 9001) 的连接已发 1 条。
_服务端发送线程() -- 与 ('127.0.0.1', 9003) 的连接开始发送 ...
客户端连接.found_terminator() -- 连接 ('127.0.0.1', 9002) 共收到 1 条。
_服务端接收线程() -- 接收到 ('127.0.0.1', 9002) 发来的信息: "已收 1 条。"
客户端连接.found_terminator() -- 连接 ('127.0.0.1', 9001) 共收到 1 条。
_服务端接收线程() -- 接收到 ('127.0.0.1', 9001) 发来的信息: "已收 1 条。"
_服务端发送线程() -- 与 ('127.0.0.1', 9002) 的连接已发 2 条。
_服务端发送线程() -- 与 ('127.0.0.1', 9003) 的连接已发 1 条。
_服务端发送线程() -- 与 ('127.0.0.1', 9001) 的连接已发 2 条。
客户端连接.found_terminator() -- 连接 ('127.0.0.1', 9002) 共收到 2 条。
_服务端接收线程() -- 接收到 ('127.0.0.1', 9002) 发来的信息: "已收 2 条。"
客户端连接.found_terminator() -- 连接 ('127.0.0.1', 9003) 共收到 1 条。
_服务端接收线程() -- 接收到 ('127.0.0.1', 9003) 发来的信息: "已收 1 条。"
客户端连接.found_terminator() -- 连接 ('127.0.0.1', 9001) 共收到 2 条。
_服务端接收线程() -- 接收到 ('127.0.0.1', 9001) 发来的信息: "已收 2 条。"
_服务端发送线程() -- 与 ('127.0.0.1', 9002) 的连接已发 3 条。
_服务端发送线程() -- 与 ('127.0.0.1', 9002) 的连接发送完毕,发送线程退出 ...
_服务端发送线程() -- 与 ('127.0.0.1', 9003) 的连接已发 2 条。
_服务端发送线程() -- 与 ('127.0.0.1', 9001) 的连接已发 3 条。
_服务端发送线程() -- 与 ('127.0.0.1', 9001) 的连接发送完毕,发送线程退出 ...
客户端连接.found_terminator() -- 连接 ('127.0.0.1', 9002) 共收到 3 条。
_服务端接收线程() -- 接收到 ('127.0.0.1', 9002) 发来的信息: "已收 3 条。"
客户端连接.found_terminator() -- 连接 ('127.0.0.1', 9003) 共收到 2 条。
_服务端接收线程() -- 接收到 ('127.0.0.1', 9003) 发来的信息: "已收 2 条。"
客户端连接.found_terminator() -- 连接 ('127.0.0.1', 9001) 共收到 3 条。
_服务端接收线程() -- 接收到 ('127.0.0.1', 9001) 发来的信息: "已收 3 条。"
_服务端发送线程() -- 与 ('127.0.0.1', 9003) 的连接已发 3 条。
_服务端发送线程() -- 与 ('127.0.0.1', 9003) 的连接发送完毕,发送线程退出 ...
客户端连接.found_terminator() -- 连接 ('127.0.0.1', 9003) 共收到 3 条。
_服务端接收线程() -- 接收到 ('127.0.0.1', 9003) 发来的信息: "已收 3 条。"
^CException KeyboardInterrupt: KeyboardInterrupt() in <module 'threading' from '/usr/lib/python3.2/threading.py'> ignored
Process 服务端进程:
Traceback (most recent call last):
File "/usr/lib/python3.2/multiprocessing/process.py", line 267, in _bootstrap
self.run()
File "/usr/lib/python3.2/multiprocessing/process.py", line 116, in run
self._target(*self._args, **self._kwargs)
File "asynchat基本传输.py", line 83, in 服务端进程
服务端对象.join()
File "asynchat基本传输.py", line 101, in join
conn.join()
File "asynchat基本传输.py", line 196, in join
self._接收线程.join()
File "/usr/lib/python3.2/threading.py", line 854, in join
self._block.wait()
File "/usr/lib/python3.2/threading.py", line 235, in wait
waiter.acquire()
KeyboardInterrupt
Python socket 基本传输实验
---- 电脑互联以后的文件共享、samba 这些只是为了开发时的方便,系统运行时的内部信息传输还是靠底层的网络传输机制,或者说 socket。对我这样的网络白痴来说,一切得从零开始。幸好 Python 用起来很方便,短时间内(不考虑犯懒的因素)把 socket 摸索到实际能用的程度也不是幻想。
---- 下面一个测试程序算是个总结,除了演示 socket 基本的通信以外,也演示了客户端或者服务端挂掉以后会发生什么。先说一下两个基本考虑:
第一,用 TCP socket 而不用 UDP socket。原因不总结了,我也不太懂,反正前一个用的最多。
第二,用默认的 blocking socket,对每一个连接都开一个发送线程和一个接收线程,Windows 和 Linux 都是,不用 non-blocking socket + select() 的方式。(参考 Python 文档里的 "socket programming howto")。如果用后一种就要给 select() 函数设 timeout,不设肯定会吃掉 100% CPU,系统还有许多其它事要做,不能让网络传输占掉太多资源。但是设的话又不知设多少是好,如果要智能控制——有流量时加快,没流量时减慢,又太麻烦, 而且不一定好得过系统的线程调度。相比之下,前一种方式简单而且容易管理得多。(补记:这里想差了。如果把 select() 放进一个单独的线程里,那么 timeout 设多少可能是无关紧要的,但还是 blocking socket 比较简单。)
---- 测试程序:
# -*- encoding: utf-8 -*-


'''
实验平台:
	Ubuntu 12.04 LTS / Linux 3.2.0-25-generic-pae

实验目标:
	模拟客户端程序异常终止的情况,检视服务端 socket 会有什么样的行为

实验过程:
	1. 开一个监听进程,使用全局 server socket,执行无限循环监听指定端口。监听到连接后会开启一个接收线程和一个
	   发送线程对连接进行操作。
	2. 主进程开启一个客户线程模拟客户端,连上服务端 socket 以后进行一次发送和一次接收操作,然后在未关闭 socket
	   的情况下终止运行,模拟客户端异常终止的情况。
	3. 服务端的发送线程和接收线程分别终止以后,在主进程里关闭全局 server socket,使监听进程终止,整个实验程序
	   终止运行。

实验结果:
	客户端程序异常终止以后,服务端 socket 的 sendall() 操作会抛出异常导致发送线程终止,recv() 操作返回 b'',
	表示连接已损坏,导致接收线程终止。
'''

import socket
import multiprocessing
import time
import threading


__host_server__= 'localhost'
__port_server__= 9000

__host_client__= 'localhost'
__port_client__= 9001


#==================================== ↓ 以下是服务端 ↓ ====================================

# 全局 socket,最后在主进程内关闭。
sock_server= socket.socket(socket.AF_INET, socket.SOCK_STREAM)
sock_server.bind((__host_server__, __port_server__))
sock_server.listen(1)	# 开始监听


def _服务端监听进程():

	while True:	# 此循环只执行一次。
		try:
			conn, addr= sock_server.accept()
		except:
			print('_服务端监听进程() -- server socket 已关闭,监听进程退出 ...')
			break

		print('_服务端监听进程() -- 接收到来自 ' + str(addr) + ' 的连接。')

		发送线程= threading.Thread(target=_服务端发送线程, name='发送线程', kwargs={'conn':conn})
		发送线程.start()

		接收线程= threading.Thread(target=_服务端接收线程, name='接收线程', kwargs={'conn':conn})
		接收线程.start()


def _服务端发送线程(conn):

	__msg__= b'0123456789'
	count= 0

	while True:
		try:
			conn.sendall(__msg__)
		except:
			print('_服务端发送线程() -- 连接已损坏,发送线程终止。')
			break
		count += 1
		print('_服务端发送线程() -- 已发 ' + str(count) + ' 条。')
		time.sleep(0.1)		# 间隔 0.1 秒发送


def _服务端接收线程(conn):

	while True:
		data= conn.recv(8192)

		if data:
			print('_服务端接收线程() -- 接收到客户端信息: ' + data.decode('utf-8'))
		else:
			print('_服务端接收线程() -- 连接已损坏,接收线程终止。')
			break
	try:
		conn.shutdown(socket.SHUT_RDWR)
	except:
		pass

	conn.close()


#==================================== ↓ 以下是客户端 ↓ ====================================

def _客户端线程():
	'''

	'''
	sock_client= socket.socket(socket.AF_INET, socket.SOCK_STREAM)
	sock_client.bind( (__host_client__, __port_client__) )
	sock_client.connect( (__host_server__, __port_server__) )

	print('_客户端线程() -- 客户端已连接,开始发送 ...')
	sock_client.sendall(b'Hello, World !')

	data= sock_client.recv(8192)
	print('_客户端线程() -- 接收到服务端发来的数据: ' + data.decode('utf-8'))

	# XXX: 模拟客户端挂掉,无预警退出
	print('_客户端线程() -- 本客户端非正常退出 ...')


#==================================== ↓ 以下是主进程 ↓ ====================================

# 启动监听进程
监听进程= multiprocessing.Process(name='监听进程', target=_服务端监听进程)
监听进程.start()

time.sleep(1)

客户线程= threading.Thread(target=_客户端线程, name='客户线程')
客户线程.start()

# 关闭监听进程,不然整个程序没法退出。
time.sleep(1)
sock_server.shutdown(socket.SHUT_RDWR)
sock_server.close()
---- 下面是运行结果:
_客户端线程() -- 客户端已连接,开始发送 ...
_客户端线程() -- 接收到服务端发来的数据: "0123456789"
_客户端线程() -- 本客户端非正常退出 ...
_服务端监听进程() -- 接收到来自 ('127.0.0.1', 9001) 的连接。
_服务端接收线程() -- 接收到客户端信息: "Hello, World !"
_服务端接收线程() -- 连接已损坏,接收线程终止。
_服务端发送线程() -- 已发 1 条。
_服务端发送线程() -- 连接已损坏,发送线程终止。
_服务端监听进程() -- server socket 已关闭,监听进程退出 ...
新电脑装机与搭建局域网备忘,nvidia 黑 一篇
---- 又弄了一台电脑,要跟原来那台组一个网络,因为交易系统前端必须跑在 Windows 上面。打算是:一台电脑作前端,跑 Windows,负责代理行情和持仓信息,执行交易指令;另一台 Linux 电脑作后端,负责数据和模式开发,开盘时的即时分析,发出交易指令。附带有手动交易功能。UI 特性包括查看行情、持仓信息,显示定制分析结果和系统运行状态等等,仍然用 Vim 来当 UI。
装机备忘:
---- 安装 Windows 7:
[1] 用 disk genius 给硬盘重新分区第一个用主分区,安装系统;第二个用扩展分区,作为 D 盘。完了以后在扩展分区上再建一个逻辑分区,并且格式化。如果不格式化,后面装 Ubuntu 时会认不到。
[2] 装好系统以后安装显卡驱动和安全软件。
---- 安装 Ubuntu:
[1] 一定要用英文版。
[2] 安装时不要联网。否则会下载更新,极慢。
[3] 安装好后头两件事是安装 nvidia 驱动和语言支持
---- 安装 nvidia 驱动: 安装好以后在 terminal 里
sudo nvidia-settings
然后在图形界面里设置。
但是很狗血的问题,安装了 nvidia 驱动以后从图形界面关机,电脑似乎没法完全关闭。光驱有反应,蓝牙灯还亮,必须长按 Power 键关机,真狗血。网上有抱怨同样问题的:
http://askubuntu.com/questions/125844/shutdown-does-not-power-off-computer
https://bugs.launchpad.net/ubuntu/+source/nvidia-graphics-drivers/+bug/940564
https://bugs.launchpad.net/ubuntu/+source/indicator-session/+bug/987220
https://bugs.launchpad.net/ubuntu/+source/linux/+bug/987933
---- 要安装的软件列表:
*. Synaptic Package Manager
*. fcitx
*. python3
*. lxml for py3
*. numpy for py3
*. wxWidget for py3
*. matplotlib
*. checkinstall
*. vim(with py3 interface)
*. python3-dev (lib)
*. ncurses (lib)
*. libx11 (lib)
*. libxt (lib)
*. libgtk2 (lib)
*. mysql
注意在安装 vim 的最后一步:sudo checkinstall 之前要先执行 sudo dpkg --configure -a 一下。
---- 安装 mysql 之后转移 StockData 数据:
1. 新电脑安装 mysql,以 root 身份登录:
mysql -h localhost -u root -p
2. 然后建立新用户:
GRANT ALL ON *.* TO 'jacky'@'localhost' IDENTIFIED BY 'xxxxxxxxx'
3. 将原电脑上的 /var/lib/mysql/StockData 复制到新电脑上,其他文件不用。然后在新电脑上更改属性:
sudo chown -R mysql:mysql /var/lib/mysql/StockData
就可以了。
配置局域网备忘:
---- 两台电脑以普通网线(非交叉网线)直连的方式建立微型局域网,可以用普通网线是因为现在的网卡有自适应功能。Windows 好像什么也不用设置,自己给自己赋予了一个 IP: 10.1.1.1,然后就说已连接上。Ubuntu 这边编辑新的有线连接,“method”一项不能用现成的,必须手动设置 IP,例如 '10.1.1.2'。然后用 ping 互相可以找到对方,就行了。
---- 通过外接 Internet 的局域网直接进行网络传输也是可以的,但是有两个问题:一是挤占带宽不好,开盘时的行情数据对实时性有要求;另一个是防火墙问题。Windows 上的网络安全软件具有防火墙功能,一般都把外连到 Internet 的局域网视为不受信任的公共网络,会阻止该网络上的一些可疑操作,包括 ping。所以在安全软件开着的情况下用 ping 去连 Windows 是连不上的。或许可以人为添加一些例外配置,但是麻烦。再说现在的笔记本都标配有线和无线,多一块网卡不用也是闲着,所以建两个局域网比较好。
---- 文件共享的设置: Windows 这边,先到 我的电脑>>属性 里面,把计算机名和工作组都改成合适的名称,重启。然后检查 Windows 防火墙(在控制面板里)和安全软件的防火墙设置,确保文件和打印共享都已启用。Ubuntu 这边,安装 samba 和它的 GUI(system-config-samba),通过 GUI 设置一下就行了。
1. 把工作组名设成和 Windows 一样,
2. 挑选共享的文件夹,
3. 建立用户和密码(从 Windows 登录),或者直接对所有人开放。好了以后 '桌面>>Go>>Network' 在里面就应该能看见 Windows 机器上的共享内容,在 Windows 里通过网上邻居,也应该能看到 Ubuntu 上的共享内容。参考文章在这里:
http://www.liberiangeek.net/2010/11/enable-file-sharing-windows-xp-ubuntu-10-10-maverick-meerkat/
Nvidia 黑
---- 关于 nvidia 提供的版权驱动造成电脑无法完全关机的问题,印象中在 08 ~ 09 年间的 Ubuntu 上就遇到过,可能是 9.04 版。但那时刚开始“体验”Linux 不久,不知道是显卡驱动的关系,于是归结到 Ubuntu 头上,觉得“免费的东西还是差一点”。此时查明缘由,自然免不了要喷 nvidia 一下。时隔三年多又再度回锅,这还只是我一个人遇上的。这不是技术问题,这是腹黑问题。你能想像这种问题出在 Windows 上面吗?那样的话被兼并的可能就是 英伟达 而不是 ATI 了。请问 英伟达 你们是怎么想的?
“我叫你用 OpenGL,我叫你用 Linux,我整死你 。。。”
是不是?
---- 另外,如果你觉得 英伟达 用来黑小白用户的只有软件,那你可就太天真了,那只是初级黑而已。这里是关于 英伟达 G84、G86 显卡设计缺陷的报道:
http://www.theinquirer.net/inquirer/news/1028703/all-nvidia-g84-g86s-bad
另外可能还包括 G92、G94。这也就是市面上那些 gee-faulse 8×00, 8×50, 9×00 之类的。对于不想纠结英文或技术细节的人来说,搜中文“显卡门”即可。
---- 在一台电脑上被 nvidia 黑了两次,一次软件,一次硬件,我对这家公司的看法完全颠覆了。前几天我一直忿忿地在网上搜 英伟达 的黑材料,终于功夫不负有心人。我当然是个小角色,英伟达 没必要鸟我。不过看看下面这位,我要拿他来做结尾。谢谢你 英伟达,眼下我已经扔掉你那些会导致硬件损害的闭源驱动,改用 nouveau。你可能觉得只有收费的软件和操作系统才值得你理会,但是对我这种既是 3D 游戏玩家也是 Linux 用户的人来说,我往后会尽量避开你那些电脑里的定时炸弹的。

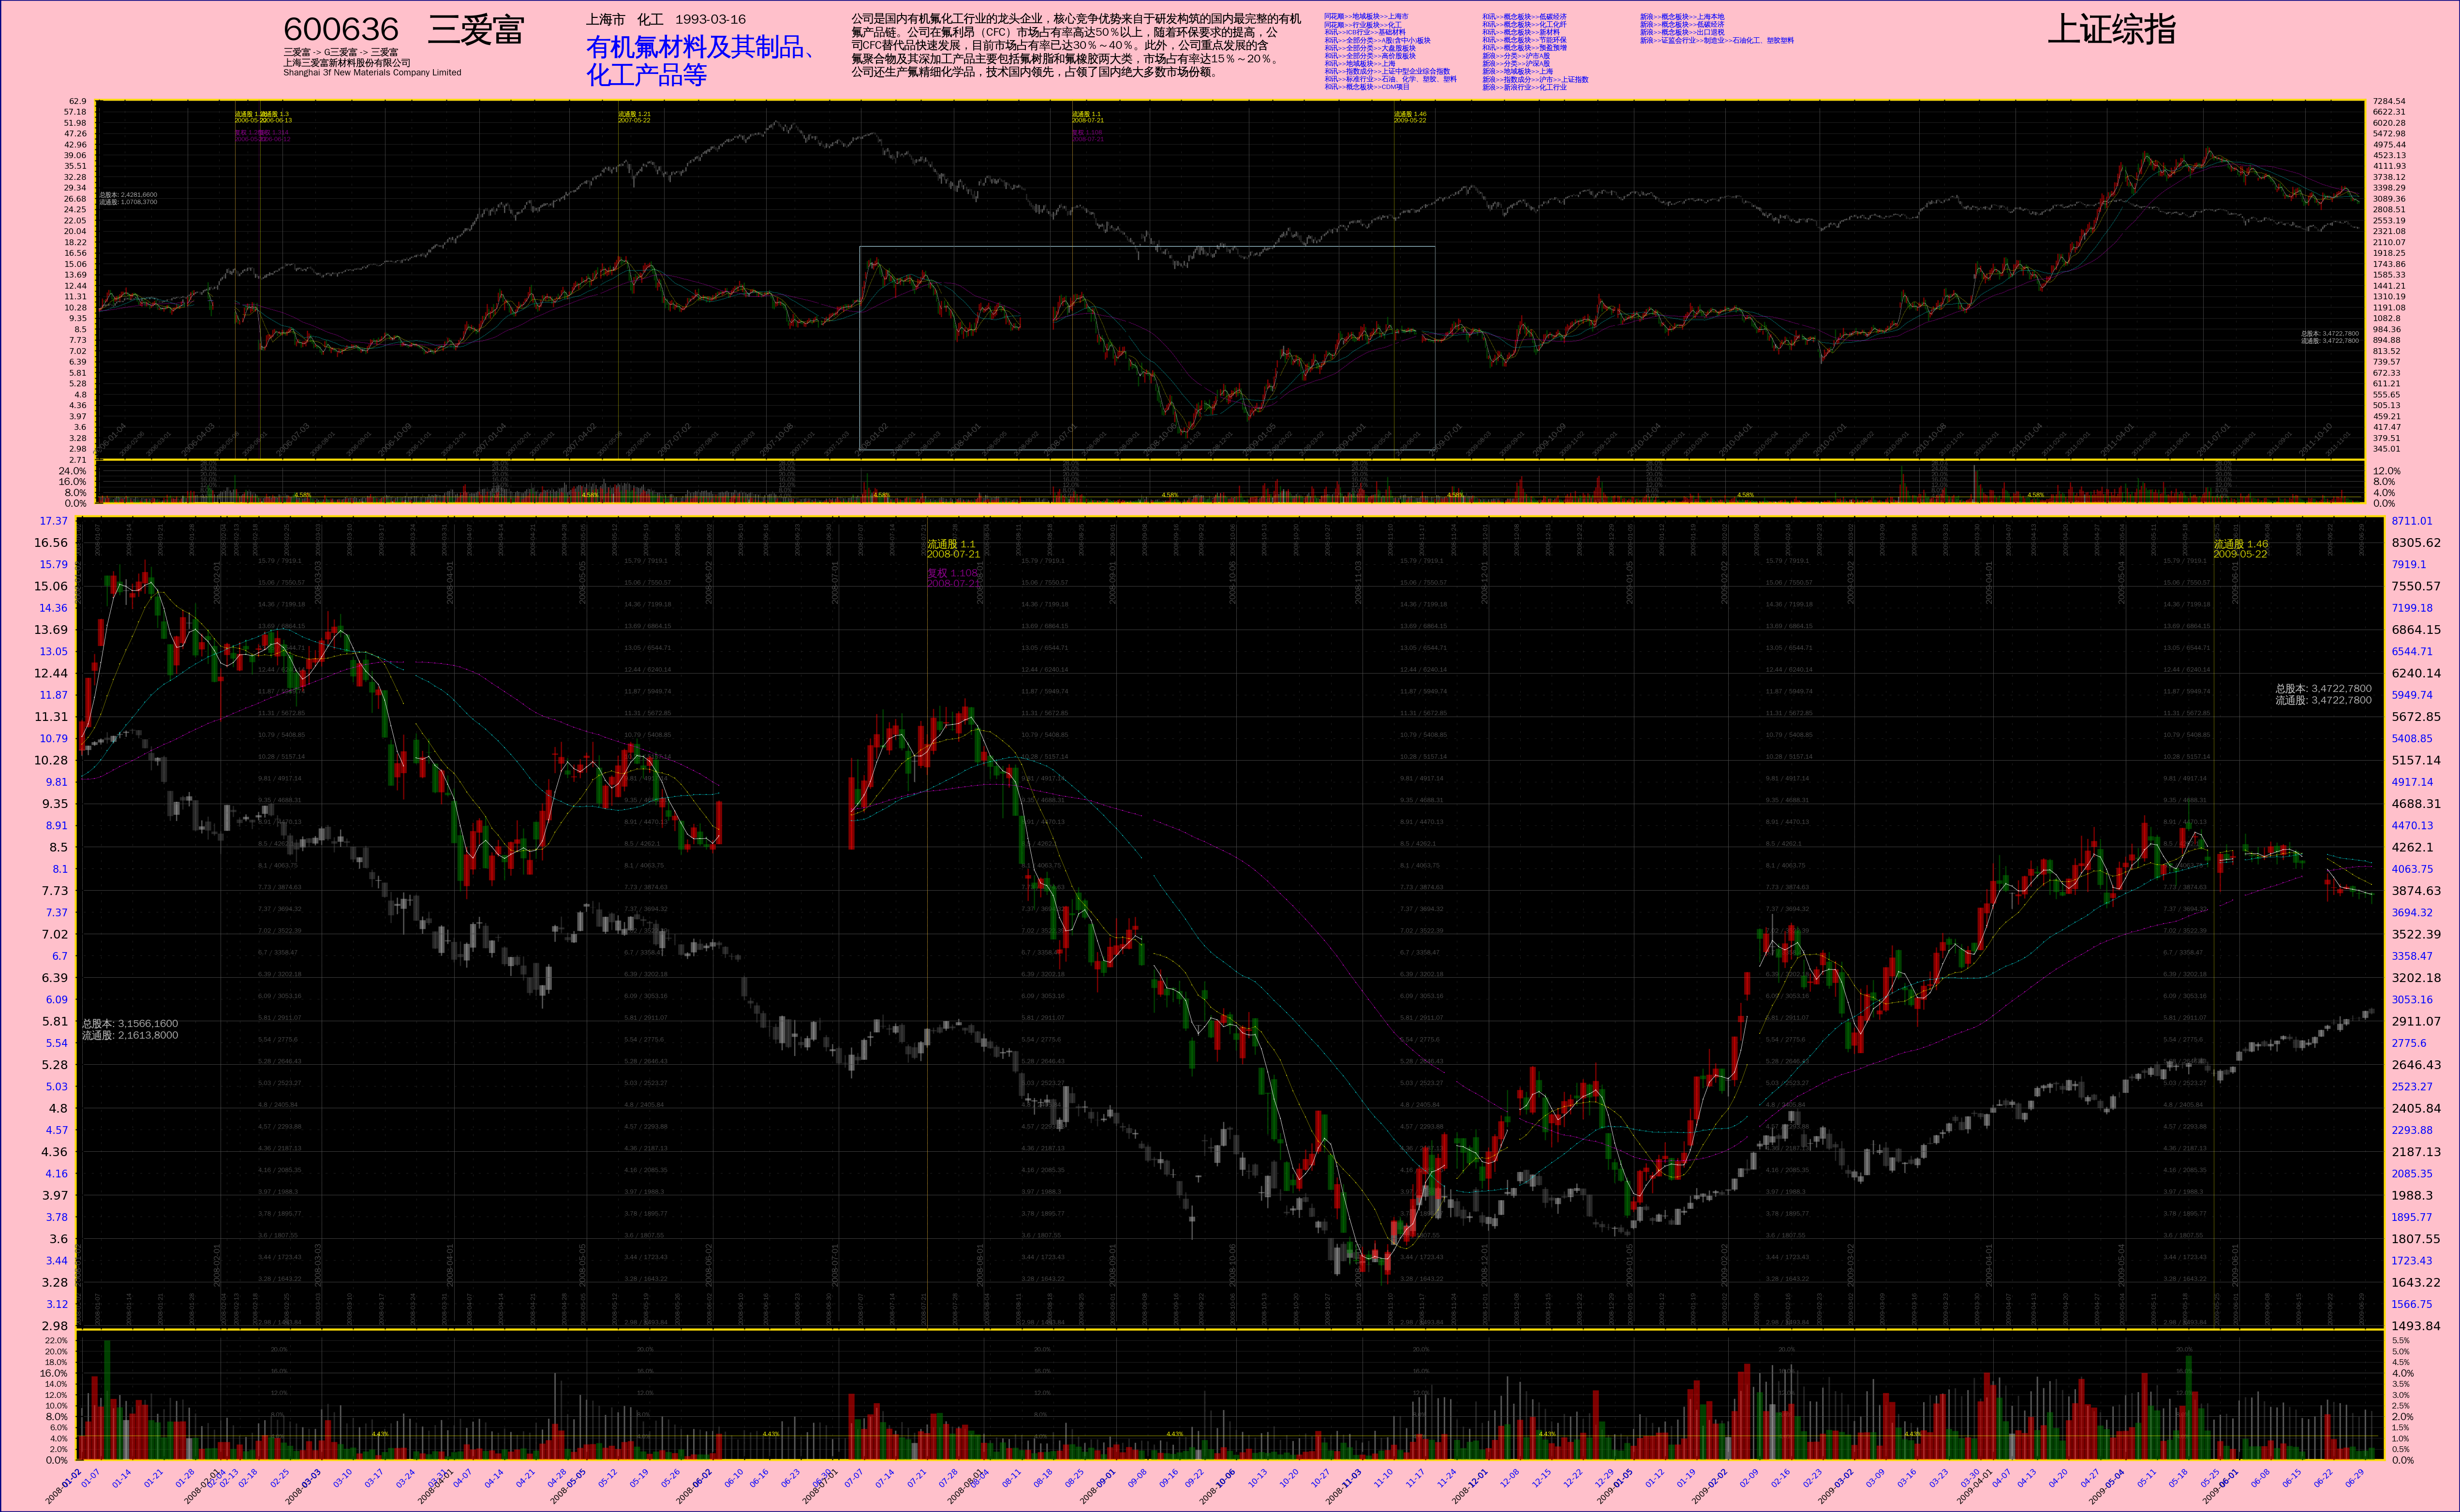
用 Python / Matplotlib 画出来的股票 K线图 (三)
---- 前一篇在这: 用 Python / Matplotlib 画出来的股票 K线图 (二)
---- 后一篇在这: 用 Python / Matplotlib 画出来的股票 K线图 (四)
---- 就像上回说的,新内容加进来。除此之外,与上一版代码相比最大的改动就是内部重构过,子图全部定义成 class。图中一共包含 5 个子图,从上到下依次是: 基本信息(就是那些文字)、历史价格、历史换手率、价格、换手率。通过输入的绘图数据进行控制,任何一个子图都可以关闭,关闭子图可以节省绘图时间和存储空间。本来还有一个财务信息子图要加进去,但是现在想暂时告一段落,先弄点其它的。
---- 作为输入的 Python pickle file 在 这里。
---- 最后是脚本,仍然是 Python 2 的:
# -*- coding: utf-8 -*-
import os
import sys
import pickle
import math
import datetime
import itertools
import matplotlib
matplotlib.use("WXAgg", warn=True) # 这个要紧跟在 import matplotlib 之后,而且必须安装了 wxpython 2.8 才行。
import matplotlib.pyplot as pyplot
import matplotlib.font_manager as font_manager
import numpy
from matplotlib.ticker import NullLocator, FixedLocator, MultipleLocator, FuncFormatter, NullFormatter
from matplotlib.patches import Ellipse
__font_properties__= font_manager.FontProperties(fname='/usr/share/fonts/truetype/wqy/wqy-zenhei.ttc')
__color_lightsalmon__= '#ffa07a'
__color_pink__= '#ffc0cb'
__color_navy__= '#000080'
__color_gold__= '#FDDB05'
__color_gray30__= '0.3'
__color_gray70__= '0.7'
__color_lightblue__= 'lightblue'
__shrink__= 1.0 / 4
__expbase__= 1.1
class SubPlot_BasicInfo:
'''
公司的基本信息
Note: this is not "real" subplot, no Axes object contained.
'''
def __init__(self, pdata, parent, name):
self._name= name
self._pdata= pdata
self._cominfo= self._pdata[u'公司信息']
self._parent= parent
self._Axes= None
self._xsize, \
self._ysize= self._compute_size()
def _compute_size(self):
return (300.0, 1.8)
def get_size(self):
return (self._xsize, self._ysize)
def build_axes(self, figobj, rect):
axes= figobj.add_axes(rect)
axes.set_frame_on(False)
self._Axes= axes
self.set_xticks()
self.set_yticks()
def set_xticks(self):
axes= self._Axes
xaxis= axes.get_xaxis()
# 设定 X 轴坐标的范围
#==================================================================================================================================================
axes.set_xlim(0, self._xsize)
xaxis.set_major_locator(NullLocator())
for mal in axes.get_xticklabels(minor=False):
mal.set_visible(False)
for mil in axes.get_xticklabels(minor=True):
mil.set_visible(False)
def set_yticks(self):
axes= self._Axes
yaxis= axes.get_yaxis()
# 设定 X 轴坐标的范围
#==================================================================================================================================================
axes.set_ylim(0, self._ysize)
yaxis.set_major_locator(NullLocator())
for mal in axes.get_yticklabels(minor=False):
mal.set_visible(False)
for mil in axes.get_yticklabels(minor=True):
mil.set_visible(False)
def plot(self):
self.plot_codesymbol(xbase=0.0, ybase=self._ysize)
self.plot_codesymbol_2(xbase=self._xsize, ybase=self._ysize)
self.plot_companyname(xbase=0.0, ybase=self._ysize-0.8)
self.plot_companylocation(xbase=48.0, ybase=self._ysize)
self.plot_mainbusiness(xbase=48.0, ybase=self._ysize)
self.plot_description(xbase=90.0, ybase=self._ysize)
self.plot_sortinginfo(xbase=165.0, ybase=self._ysize)
def plot_codesymbol(self, xbase, ybase):
'''
交易代码、公司简称
'''
txtstr= self._cominfo[u'代码'] + u' ' + self._cominfo[u'简称']
label= self._Axes.text(xbase, ybase, txtstr, fontproperties=__font_properties__, verticalalignment='top', horizontalalignment='left')
label.set_fontsize(16.0)
def plot_codesymbol_2(self, xbase, ybase):
txtstr= self._cominfo[u'简称二']
label= self._Axes.text(xbase, ybase, txtstr, fontproperties=__font_properties__, verticalalignment='top', horizontalalignment='right')
label.set_fontsize(16.0)
def plot_companyname(self, xbase, ybase):
'''
曾用名、全名、英文名
'''
txtstr= self._cominfo[u'基本情况'][u'曾用名']
txtlist= txtstr.split('->')
if len(txtlist) > 15:
txtstr= ' -> '.join(txtlist[:5]) + ' ->\n' + ' -> '.join(txtlist[5:10]) + ' ->\n' + ' -> '.join(txtlist[10:15]) + ' ->\n' + ' -> '.join(txtlist[15:]) + '\n'
elif len(txtlist) > 10:
txtstr= ' -> '.join(txtlist[:5]) + ' ->\n' + ' -> '.join(txtlist[5:10]) + ' ->\n' + ' -> '.join(txtlist[10:]) + '\n'
elif len(txtlist) > 5:
txtstr= ' -> '.join(txtlist[:5]) + ' ->\n' + ' -> '.join(txtlist[5:]) + '\n'
else:
txtstr= ' -> '.join(txtlist) + '\n'
txtstr += self._cominfo[u'基本情况'][u'公司名称'] + '\n'
txtstr += self._cominfo[u'基本情况'][u'英文名称']
label= self._Axes.text(xbase, ybase, txtstr, fontproperties=__font_properties__, verticalalignment='top', horizontalalignment='left')
label.set_fontsize(4.5)
def plot_companylocation(self, xbase, ybase):
'''
地域、所属行业、上市日期
'''
txtstr= self._cominfo[u'公司概况'][u'区域'] + ' ' + self._cominfo[u'公司概况'][u'所属行业'] + ' ' + self._cominfo[u'发行相关'][u'上市日期']
label= self._Axes.text(xbase, ybase, txtstr, fontproperties=__font_properties__, verticalalignment='top', horizontalalignment='left')
label.set_fontsize(6.5)
def plot_mainbusiness(self, xbase, ybase):
'''
主营业务
'''
# 查找表: (<文字长度>, <每行字数>, <字体大小>, <Y轴偏移量>)
lookups= (
(20, 10, 12.0, 0.5),
(45, 15, 8.2, 0.5),
(80, 20, 6.2, 0.5),
(125, 25, 5.0, 0.5),
(180, 30, 4.1, 0.5),
(245, 35, 3.5, 0.4),
(999999, 37, 3.4, 0.4)
)
txtstr= self._cominfo[u'基本情况'][u'主营业务']
length= len(txtstr)
for sizelimit, linelimit, fontsize, yshift in lookups:
if length <= sizelimit:
txtstr= '\n'.join([txtstr[linelimit*idx : linelimit*(idx+1)] for idx in range(length//linelimit + 1)])
fsize= fontsize
ycoord= ybase - yshift
break
label= self._Axes.text(xbase, ycoord, txtstr, fontproperties=__font_properties__, verticalalignment='top', horizontalalignment='left', color='blue')
label.set_fontsize(fsize)
def plot_description(self, xbase, ybase):
'''
公司简介
'''
# 查找表: (<文字长度>, <每行字数>, <字体大小>)
lookups= (
(150, 30, 7.0),
(240, 40, 5.6),
(329, 47, 4.8),
(432, 54, 4.2),
(576, 64, 3.5),
(670, 67, 3.4),
(792, 72, 3.1),
(960, 80, 2.8),
(1222, 94, 2.4),
(1428, 102, 2.26),
(1620, 108, 2.12),
(1938, 114, 2.00),
(999999, 130, 1.75)
)
txtstr= self._cominfo[u'公司概况'][u'公司简介'] # 26 ~ 2600 字符
length= len(txtstr)
for sizelimit, linelimit, fontsize in lookups:
if length <= sizelimit:
txtstr= '\n'.join([txtstr[linelimit*idx : linelimit*(idx+1)] for idx in range(length//linelimit + 1)])
fsize= fontsize
break
label= self._Axes.text(xbase, ybase, txtstr, fontproperties=__font_properties__, verticalalignment='top', horizontalalignment='left')
label.set_fontsize(fsize)
def plot_sortinginfo(self, xbase, ybase):
'''
行业板块信息
'''
infolist= self._cominfo[u'行业板块']
for idx in range(len(infolist)//10 + 1):
txtstr= '\n'.join(infolist[10*idx : 10*(idx+1)])
if not txtstr:
break
xcoord= xbase + 25.0*idx
label= self._Axes.text(xcoord, ybase, txtstr, fontproperties=__font_properties__, verticalalignment='top', horizontalalignment='left', color='blue')
label.set_fontsize(3.4)
class SubPlot_Financial:
'''
换手率子图
'''
pass
class SubPlot_PriceBase:
'''
'''
def __init__(self, pdata, parent, xparams, name):
'''
'''
self._name= name # 派生类自己设置
self._pdata= pdata
self._parent= parent
self._expbase= __expbase__
self._xparams= xparams
self._shrink= __shrink__ if name == 'pricefs' else 1.0
# 绘图数据
quotes= pdata[u'行情']
if name == 'pricefs':
self._dates= quotes[u'日期']
self._open= quotes[u'开盘']
self._close= quotes[u'收盘']
self._high= quotes[u'最高']
self._low= quotes[u'最低']
if u'简化' in quotes: self._simple= quotes[u'简化']
# if u'换手率' in quotes: self._torate= quotes[u'换手率']
# if u'成交量' in quotes: self._volume= quotes[u'成交量']
# if u'成交额' in quotes: self._turnover= quotes[u'成交额']
if u'3日均' in quotes: self._average3= quotes[u'3日均']
if u'5日均' in quotes: self._average5= quotes[u'5日均']
if u'10日均' in quotes: self._average10= quotes[u'10日均']
if u'30日均' in quotes: self._average30= quotes[u'30日均']
if u'60日均' in quotes: self._average60= quotes[u'60日均']
if u'开盘二' in quotes:
self._open_2= quotes[u'开盘二']
self._close_2= quotes[u'收盘二']
self._high_2= quotes[u'最高二']
self._low_2= quotes[u'最低二']
if u'简化二' in quotes: self._simple_2= quotes[u'简化二']
# if u'换手率二' in quotes: self._torate_2= quotes[u'换手率二']
# if u'成交量二' in quotes: self._volume_2= quotes[u'成交量二']
# if u'成交额二' in quotes: self._turnover_2= quotes[u'成交额二']
if u'3日均二' in quotes: self._average3_2= quotes[u'3日均二']
if u'5日均二' in quotes: self._average5_2= quotes[u'5日均二']
if u'10日均二' in quotes: self._average10_2= quotes[u'10日均二']
if u'30日均二' in quotes: self._average30_2= quotes[u'30日均二']
if u'60日均二' in quotes: self._average60_2= quotes[u'60日均二']
else:
sidx, eidx= pdata[u'任务描述'][u'起始偏移'], pdata[u'任务描述'][u'结束偏移']
self._dates= quotes[u'日期'][sidx:eidx]
self._open= quotes[u'开盘'][sidx:eidx]
self._close= quotes[u'收盘'][sidx:eidx]
self._high= quotes[u'最高'][sidx:eidx]
self._low= quotes[u'最低'][sidx:eidx]
if u'简化' in quotes: self._simple= quotes[u'简化'][sidx:eidx]
# if u'换手率' in quotes: self._torate= quotes[u'换手率'][sidx:eidx]
# if u'成交量' in quotes: self._volume= quotes[u'成交量'][sidx:eidx]
# if u'成交额' in quotes: self._turnover= quotes[u'成交额'][sidx:eidx]
if u'3日均' in quotes: self._average3= quotes[u'3日均'][sidx:eidx]
if u'5日均' in quotes: self._average5= quotes[u'5日均'][sidx:eidx]
if u'10日均' in quotes: self._average10= quotes[u'10日均'][sidx:eidx]
if u'30日均' in quotes: self._average30= quotes[u'30日均'][sidx:eidx]
if u'60日均' in quotes: self._average60= quotes[u'60日均'][sidx:eidx]
if u'开盘二' in quotes:
self._open_2= quotes[u'开盘二'][sidx:eidx]
self._close_2= quotes[u'收盘二'][sidx:eidx]
self._high_2= quotes[u'最高二'][sidx:eidx]
self._low_2= quotes[u'最低二'][sidx:eidx]
if u'简化二' in quotes: self._simple_2= quotes[u'简化二'][sidx:eidx]
# if u'换手率二' in quotes: self._torate_2= quotes[u'换手率二'][sidx:eidx]
# if u'成交量二' in quotes: self._volume_2= quotes[u'成交量二'][sidx:eidx]
# if u'成交额二' in quotes: self._turnover_2= quotes[u'成交额二'][sidx:eidx]
if u'3日均二' in quotes: self._average3_2= quotes[u'3日均二'][sidx:eidx]
if u'5日均二' in quotes: self._average5_2= quotes[u'5日均二'][sidx:eidx]
if u'10日均二' in quotes: self._average10_2= quotes[u'10日均二'][sidx:eidx]
if u'30日均二' in quotes: self._average30_2= quotes[u'30日均二'][sidx:eidx]
if u'60日均二' in quotes: self._average60_2= quotes[u'60日均二'][sidx:eidx]
self._length= len(self._dates) # XXX: 由派生类设定
# 衍生数据
#==============================================================================================================
self._xindex= numpy.arange(self._length) # X 轴上的 index,一个辅助数据
self._zipoc= zip(self._open, self._close)
self._up= numpy.array( [ True if po < pc and po is not None else False for po, pc in self._zipoc] ) # 标示出该天股价日内上涨的一个序列
self._down= numpy.array( [ True if po > pc and po is not None else False for po, pc in self._zipoc] ) # 标示出该天股价日内下跌的一个序列
self._side= numpy.array( [ True if po == pc and po is not None else False for po, pc in self._zipoc] ) # 标示出该天股价日内走平的一个序列
if u'开盘二' in quotes:
self._zipoc_2= zip(self._open_2, self._close_2)
self._up_2= numpy.array( [ True if po < pc and po is not None else False for po, pc in self._zipoc_2] ) # 标示出该天股价日内上涨的一个序列
self._down_2= numpy.array( [ True if po > pc and po is not None else False for po, pc in self._zipoc_2] ) # 标示出该天股价日内下跌的一个序列
self._side_2= numpy.array( [ True if po == pc and po is not None else False for po, pc in self._zipoc_2] ) # 标示出该天股价日内走平的一个序列
self._Axes= None
self._AxisX= None
self._AxisY= None
self._xsize= 0.0
self._ysize= 0.0
self._yhighlim= 0 # Y 轴最大坐标
self._ylowlim= 0 # Y 轴最小坐标
if u'开盘二' in self._pdata[u'行情']:
self._Axes_2= None # 如果有第二个行情数据,就建立另一个 Axes 对象
self._AxisX_2= None
self._AxisY_2= None
self._yhighlim_2= 0 # Y 轴最大坐标
self._ylowlim_2= 0 # Y 轴最小坐标
self._compute_size()
self._ytickset= self._compute_ytickset() # 需放在前一句后面
def _compute_size(self):
'''
根据绘图数据 pdata 计算出本子图的尺寸,修改数据成员
'''
quotes= self._pdata[u'行情']
popen= self._open[0] # int 类型
phigh= max( [ph for ph in self._high if ph is not None] ) # 最高价
plow= min( [pl for pl in self._low if pl is not None] ) # 最低价
# Y 轴范围
if self._name == 'pricefs':
yhighlim= phigh * 1.2 # K线子图 Y 轴最大坐标
ylowlim= plow / 1.2 # K线子图 Y 轴最小坐标
else:
yhighlim= phigh * 1.1 # K线子图 Y 轴最大坐标
ylowlim= plow / 1.1 # K线子图 Y 轴最小坐标
self._yhighlim= yhighlim
self._ylowlim= ylowlim
if u'开盘二' in quotes:
popen_2= self._open_2[0] # 同上
phigh_2= max( [ph for ph in self._high_2 if ph is not None] ) # 第二个行情的最高价
phigh= max(phigh, int(phigh_2 * popen / float(popen_2))) # 以第一个行情为基准修正出的总最高价
plow_2= min( [pl for pl in self._low_2 if pl is not None] ) # 最低价
plow= min(plow, int(plow_2 * popen / float(popen_2))) # 以第一个行情为基准修正出的总最低价
if self._name == 'pricefs':
yhighlim= phigh * 1.2 # K线子图 Y 轴最大坐标
ylowlim= plow / 1.2 # K线子图 Y 轴最小坐标
else:
yhighlim= phigh * 1.1 # K线子图 Y 轴最大坐标
ylowlim= plow / 1.1 # K线子图 Y 轴最小坐标
ylowlim_2= ylowlim * popen_2 / float(popen)
yhighlim_2= yhighlim * popen_2 / float(popen)
self._yhighlim= yhighlim
self._ylowlim= ylowlim
self._yhighlim_2= yhighlim_2
self._ylowlim_2= ylowlim_2
# XXX: 价格在 Y 轴上的 “份数”。注意,虽然最高与最低价是以第一个行情为基准修正出来的,但其中包含的倍数因子对结果无影响,即:
# log(base, num1) - log(base, num2) ==
# log(base, num1/num2) ==
# log(base, k*num1/k*num2) ==
# log(base, k*num1) - log(base, k*num2)
# ,这是对数运算的性质。
xmargin= self._xparams['xmargin']
self._xsize= (self._length + xmargin*2) * self._shrink # int, 所有数据的长度,就是天数
self._ysize= (math.log(yhighlim, self._expbase) - math.log(ylowlim, self._expbase)) * self._shrink # float
def get_size(self):
return (self._xsize, self._ysize)
def get_ylimits(self):
return (self._yhighlim, self._ylowlim)
def build_axes(self, figobj, rect):
'''
初始化 self._Axes 对象
'''
# 添加 Axes 对象
#==================================================================================================================================================
if self._name == 'price' and 'torate' in self._parent._subplots:
sharex= self._parent._subplots['torate'].get_axes()
axes= figobj.add_axes(rect, axis_bgcolor='black', sharex=sharex)
elif self._name == 'pricefs' and 'toratefs' in self._parent._subplots:
sharex= self._parent._subplots['toratefs'].get_axes()
axes= figobj.add_axes(rect, axis_bgcolor='black', sharex=sharex)
else:
axes= figobj.add_axes(rect, axis_bgcolor='black')
axes.set_axisbelow(True) # 网格线放在底层
# axes.set_zorder(1) # XXX: 不顶用
# axes.patch.set_visible(False) # hide the 'canvas'
axes.set_yscale('log', basey=self._expbase) # 使用对数坐标
# 改变坐标线的颜色
#==================================================================================================================================================
for child in axes.get_children():
if isinstance(child, matplotlib.spines.Spine):
child.set_color(__color_gold__)
# 得到 X 轴 和 Y 轴 的两个 Axis 对象
#==================================================================================================================================================
xaxis= axes.get_xaxis()
yaxis= axes.get_yaxis()
# 设置两个坐标轴上的网格线
#==================================================================================================================================================
xaxis.grid(True, 'major', color='0.3', linestyle='solid', linewidth=0.2)
xaxis.grid(True, 'minor', color='0.3', linestyle='dotted', linewidth=0.1)
if self._name == 'pricefs': # 如果是小图,就不设辅助网格线
yaxis.grid(True, 'major', color='0.3', linestyle='solid', linewidth=0.1)
else:
yaxis.grid(True, 'major', color='0.3', linestyle='solid', linewidth=0.2)
yaxis.grid(True, 'minor', color='0.3', linestyle='dotted', linewidth=0.1)
yaxis.set_label_position('left')
self._Axes= axes
self._AxisX= xaxis
self._AxisY= yaxis
if u'开盘二' in self._pdata[u'行情']:
# 添加 Axes 对象。注意,设置 axes_2 而不是 axes 的网格线,从而不会跑到 axes 边框上边的做法不顶用。
#==================================================================================================================================================
axes_2= axes.twinx() # twinx is problematic, no use no more.
# XXX: 下面这三行把第一个 axes 放在上面,这样不会被第二个 axes 的图形遮盖。用 zorder 不顶用。
axes.figure.axes[-2:]= [axes_2, axes] # XXX:
axes.set_frame_on(False) # 如果不做此设定,axes_2 的内容会看不见
axes_2.set_frame_on(True)
axes_2.set_axis_bgcolor('black')
axes_2.set_axisbelow(True) # 网格线放在底层
axes_2.set_yscale('log', basey=self._expbase) # 使用对数坐标
# 改变坐标线的颜色
#==================================================================================================================================================
for child in axes_2.get_children():
if isinstance(child, matplotlib.spines.Spine):
child.set_color(__color_gold__)
# 得到 X 轴 和 Y 轴 的两个 Axis 对象
#==================================================================================================================================================
xaxis_2= axes_2.get_xaxis()
yaxis_2= axes_2.get_yaxis()
# 设置两个坐标轴上的网格线
#==================================================================================================================================================
# xaxis_2.grid(True, 'major', color='0.3', linestyle='solid', linewidth=0.2)
# xaxis_2.grid(True, 'minor', color='0.3', linestyle='dotted', linewidth=0.1)
# if self._name == 'pricefs': # 如果是小图,就不设辅助网格线
# yaxis_2.grid(True, 'major', color='0.3', linestyle='solid', linewidth=0.1)
# else:
# yaxis_2.grid(True, 'major', color='0.3', linestyle='solid', linewidth=0.2)
# yaxis_2.grid(True, 'minor', color='0.3', linestyle='dotted', linewidth=0.1)
yaxis_2.set_label_position('right')
self._Axes_2= axes_2
self._AxisX_2= xaxis_2
self._AxisY_2= yaxis_2
def set_xticks(self):
xMajorLocator= self._xparams['xMajorLocator']
xMinorLocator= self._xparams['xMinorLocator']
axes= self._Axes
xaxis= self._AxisX
# 设定 X 轴坐标的范围
#==================================================================================================================================================
xmargin= self._xparams['xmargin']
axes.set_xlim(-xmargin, self._length + xmargin)
# 先设置 label 位置,再将 X 轴上的坐标设为不可见。因为与 成交量子图 共用 X 轴
#==================================================================================================================================================
# 设定 X 轴的 Locator 和 Formatter
xaxis.set_major_locator(xMajorLocator)
# xaxis.set_major_formatter(xMajorFormatter)
xaxis.set_minor_locator(xMinorLocator)
# xaxis.set_minor_formatter(xMinorFormatter)
# 将 X 轴上的坐标设为不可见。
for mal in axes.get_xticklabels(minor=False):
mal.set_visible(False)
for mil in axes.get_xticklabels(minor=True):
mil.set_visible(False)
def set_xticks_2(self):
quotes= self._pdata[u'行情']
axes= self._Axes_2
xaxis= self._AxisX_2
xMajorLocator= self._xparams['xMajorLocator']
xMinorLocator= self._xparams['xMinorLocator']
# 设定 X 轴坐标的范围
#==================================================================================================================================================
xmargin= self._xparams['xmargin']
axes.set_xlim(-xmargin, self._length + xmargin)
# 先设置 label 位置,再将 X 轴上的坐标设为不可见。因为与 成交量子图 共用 X 轴
#==================================================================================================================================================
# 设定 X 轴的 Locator 和 Formatter
xaxis.set_major_locator(xMajorLocator)
# xaxis.set_major_formatter(xMajorFormatter)
xaxis.set_minor_locator(xMinorLocator)
# xaxis.set_minor_formatter(xMinorFormatter)
# 将 X 轴上的坐标设为不可见。
for mal in axes.get_xticklabels(minor=False):
mal.set_visible(False)
for mil in axes.get_xticklabels(minor=True):
mil.set_visible(False)
def _compute_ytickset(self):
'''
计算 Y 轴坐标点的位置,包括第二个行情
'''
quotes= self._pdata[u'行情']
expbase= self._expbase
ytickset= {}
yhighlim= self._yhighlim
ylowlim= self._ylowlim
if u'开盘二' in quotes:
yhighlim_2= self._yhighlim_2
ylowlim_2= self._ylowlim_2
if self._name == 'price' and 'pricefs' in self._parent._subplots:
tsetfs= self._parent._subplots['pricefs'].get_ytickset()
majors= tsetfs['major']
while majors[-1] < yhighlim: majors.append(majors[-1] * expbase)
while majors[0] > ylowlim: majors.insert(0, majors[0] / expbase)
minors= tsetfs['minor']
while minors[-1] < yhighlim: minors.append(minors[-1] * expbase)
while minors[0] > ylowlim: minors.insert(0, minors[0] / expbase)
ytickset['major']= [loc for loc in majors if loc > ylowlim and loc < yhighlim]
ytickset['minor']= [loc for loc in minors if loc > ylowlim and loc < yhighlim]
else:
# 主要坐标点
#----------------------------------------------------------------------------
majors= [ylowlim]
while majors[-1] < yhighlim: majors.append(majors[-1] * 1.1)
# 辅助坐标点
#----------------------------------------------------------------------------
minors= [ylowlim * 1.1**0.5]
while minors[-1] < yhighlim: minors.append(minors[-1] * 1.1)
ytickset['major']= [loc for loc in majors if loc > ylowlim and loc < yhighlim] # 注意,第一项(ylowlim)被排除掉了
ytickset['minor']= [loc for loc in minors if loc > ylowlim and loc < yhighlim]
if u'开盘二' in quotes:
popen= self._open[0] # int 类型
popen_2= self._open_2[0] # 同上
ytickset['major_2']= [loc * popen_2 / popen for loc in ytickset['major']]
ytickset['minor_2']= [loc * popen_2 / popen for loc in ytickset['minor']]
return ytickset
def get_ytickset(self):
return self._ytickset
def set_yticks(self):
'''
设置第一只行情的 Y 轴坐标,包括坐标值在图中间的显示
'''
axes= self._Axes
ylowlim= self._ylowlim
yhighlim= self._yhighlim
yaxis= self._AxisY
majorticks= self._ytickset['major']
minorticks= self._ytickset['minor']
# 设定 Y 轴坐标的范围
#==================================================================================================================================================
axes.set_ylim(ylowlim, yhighlim)
# 设定 Y 轴上的坐标
#==================================================================================================================================================
# 主要坐标点
#----------------------------------------------------------------------------
yMajorLocator= FixedLocator(numpy.array(majorticks))
# 确定 Y 轴的 MajorFormatter
def y_major_formatter(num, pos=None):
return str(round(num/1000.0, 2))
yMajorFormatter= FuncFormatter(y_major_formatter)
# 设定 X 轴的 Locator 和 Formatter
yaxis.set_major_locator(yMajorLocator)
yaxis.set_major_formatter(yMajorFormatter)
# 设定 Y 轴主要坐标点与辅助坐标点的样式
fsize= 4 if self._name == 'pricefs' else 6
for mal in axes.get_yticklabels(minor=False):
mal.set_fontsize(fsize)
# 辅助坐标点
#----------------------------------------------------------------------------
yMinorLocator= FixedLocator(numpy.array(minorticks))
# 确定 Y 轴的 MinorFormatter
def y_minor_formatter(num, pos=None):
return str(round(num/1000.0, 2))
yMinorFormatter= FuncFormatter(y_minor_formatter)
# 设定 X 轴的 Locator 和 Formatter
yaxis.set_minor_locator(yMinorLocator)
yaxis.set_minor_formatter(yMinorFormatter)
# 设定 Y 轴辅助坐标点的样式
if self._name == 'pricefs':
for mil in axes.get_yticklabels(minor=True):
mil.set_visible(False)
else:
for mil in axes.get_yticklabels(minor=True):
mil.set_fontsize(5)
mil.set_color('blue')
def set_yticks_2(self):
'''
子图右侧的 Y 轴坐标
'''
axes= self._Axes_2
yaxis= self._AxisY_2
yhighlim_2= self._yhighlim_2
ylowlim_2= self._ylowlim_2
majorticks_2= self._ytickset['major_2']
minorticks_2= self._ytickset['minor_2']
# 设定 Y 轴坐标的范围
#==================================================================================================================================================
axes.set_ylim(ylowlim_2, yhighlim_2)
# 设定 Y 轴上的坐标
#==================================================================================================================================================
# 主要坐标点
#----------------------------------------------------------------------------
yMajorLocator= FixedLocator(numpy.array(majorticks_2))
# 确定 Y 轴的 MajorFormatter
def y_major_formatter(num, pos=None):
return str(round(num/1000.0, 2))
yMajorFormatter= FuncFormatter(y_major_formatter)
# 设定 X 轴的 Locator 和 Formatter
yaxis.set_major_locator(yMajorLocator)
yaxis.set_major_formatter(yMajorFormatter)
# 设定 Y 轴主要坐标点与辅助坐标点的样式
fsize= 4 if self._name == 'pricefs' else 6
for mal in axes.get_yticklabels(minor=False):
mal.set_fontsize(fsize)
# 辅助坐标点
#----------------------------------------------------------------------------
yMinorLocator= FixedLocator(numpy.array(minorticks_2)) # XXX minor ticks 已经在上面一并设置,这里不需要了。
# 确定 Y 轴的 MinorFormatter
def y_minor_formatter(num, pos=None):
return str(round(num/1000.0, 2))
yMinorFormatter= FuncFormatter(y_minor_formatter)
# 设定 X 轴的 Locator 和 Formatter
yaxis.set_minor_locator(yMinorLocator)
yaxis.set_minor_formatter(yMinorFormatter)
# 设定 Y 轴主要坐标点与辅助坐标点的样式
if self._name == 'pricefs':
for mil in axes.get_yticklabels(minor=True):
mil.set_visible(False)
else:
for mil in axes.get_yticklabels(minor=True):
mil.set_fontsize(5)
mil.set_color('blue')
def plot(self):
'''
由派生类自己定义
'''
pass
def plot_candlestick(self):
'''
绘制 K 线
'''
axes= self._Axes
xindex= self._xindex
up= self._up
down= self._down
side= self._side
# 绘制 K 线部分
#==================================================================================================================================================
# 对开收盘价进行视觉修正
for idx, poc in enumerate(self._zipoc):
if poc[0] == poc[1] and None not in poc:
variant= int(round((poc[1]+1000)/2000.0, 0))
self._open[idx]= poc[0] - variant # 稍微偏离一点,使得在图线上不致于完全看不到
self._close[idx]= poc[1] + variant
rarray_open= numpy.array(self._open)
rarray_close= numpy.array(self._close)
rarray_high= numpy.array(self._high)
rarray_low= numpy.array(self._low)
# XXX: 如果 up, down, side 里有一个全部为 False 组成,那么 vlines() 会报错。
# XXX: 可以使用 alpha 参数调节透明度
if True in up:
axes.vlines(xindex[up], rarray_low[up], rarray_high[up], edgecolor='red', linewidth=0.6, label='_nolegend_', alpha=0.5)
axes.vlines(xindex[up], rarray_open[up], rarray_close[up], edgecolor='red', linewidth=3.0, label='_nolegend_', alpha=0.5)
if True in down:
axes.vlines(xindex[down], rarray_low[down], rarray_high[down], edgecolor='green', linewidth=0.6, label='_nolegend_', alpha=0.5)
axes.vlines(xindex[down], rarray_open[down], rarray_close[down], edgecolor='green', linewidth=3.0, label='_nolegend_', alpha=0.5)
if True in side:
axes.vlines(xindex[side], rarray_low[side], rarray_high[side], edgecolor='0.7', linewidth=0.6, label='_nolegend_', alpha=0.5)
axes.vlines(xindex[side], rarray_open[side], rarray_close[side], edgecolor='0.7', linewidth=3.0, label='_nolegend_', alpha=0.5)
def plot_simplified(self):
'''
绘制简化行情
'''
xindex= self._xindex
axes= self._Axes
rarray_simple= numpy.array(self._simple)
axes.plot(xindex, rarray_simple, 'o-', color='white', linewidth=0.3, label='simple', \
markersize=0.3, markeredgecolor='white', markeredgewidth=0.1, alpha=0.3) # 简化行情
def plot_average(self):
'''
绘制均线
'''
# 绘制均线部分
#==================================================================================================================================================
quotes= self._pdata[u'行情']
xindex= self._xindex
axes= self._Axes
if self._name == 'pricefs':
widthw= 0.1
widthn= 0.07
mksize= 0.07
mkwidth= 0.1
alpha= 1.0
else:
widthw= 0.2
widthn= 0.1
mksize= 0.3
mkwidth= 0.1
alpha= 1.0
if u'3日均' in quotes:
rarray_3dayave= numpy.array(self._average3)
axes.plot(xindex, rarray_3dayave, 'o-', color='white', linewidth=widthw, label='avg_3', \
markersize=mksize, markeredgecolor='white', markeredgewidth=mkwidth, alpha=alpha) # 3日均线
if u'5日均' in quotes:
rarray_5dayave= numpy.array(self._average5)
axes.plot(xindex, rarray_5dayave, 'o-', color='white', linewidth=widthn, label='avg_5', \
markersize=mksize, markeredgecolor='white', markeredgewidth=mkwidth, alpha=alpha) # 5日均线
if u'10日均' in quotes:
rarray_10dayave= numpy.array(self._average10)
axes.plot(xindex, rarray_10dayave, 'o-', color='yellow', linewidth=widthn, label='avg_10', \
markersize=mksize, markeredgecolor='yellow', markeredgewidth=mkwidth, alpha=alpha) # 10日均线
if u'30日均' in quotes:
rarray_30dayave= numpy.array(self._average30)
axes.plot(xindex, rarray_30dayave, 'o-', color='cyan', linewidth=widthn, label='avg_30', \
markersize=mksize, markeredgecolor='cyan', markeredgewidth=mkwidth, alpha=alpha) # 30日均线
if u'60日均' in quotes:
rarray_60dayave= numpy.array(self._average60)
axes.plot(xindex, rarray_60dayave, 'o-', color='magenta', linewidth=widthn, label='avg_60', \
markersize=mksize, markeredgecolor='magenta', markeredgewidth=mkwidth, alpha=alpha) # 60日均线
def plot_adjustnotes(self):
'''
绘制复权提示
'''
quotes= self._pdata[u'行情']
firstday= self._dates[0]
lastday= self._dates[-1]
ylowlim= self._ylowlim
yhighlim= self._yhighlim
axes= self._Axes
# 使用 annotate() 进行标注。不用了,留作纪念。
#===========================================================================================================================
# adjdict= dict(quotes[u'相对复权']) # key 是 date string,value 是相对复权因子(float 类型)
# el= Ellipse((2, -1), 0.5, 0.5)
# for idx, dstr in enumerate(self._dates):
# if dstr in adjdict:
# axes.plot([idx, idx], [ylowlim, yhighlim], '-', color='purple', linewidth=0.1)
# axes.annotate(u'复权\n' + str(adjdict[dstr]),
# fontproperties=__font_properties__,
# xy=(idx, yhighlim/1.1), xycoords='data',
# xytext=(10, 5), textcoords='offset points', size=5, verticalalignment="center",
# bbox=dict(boxstyle="round", facecolor='white', edgecolor='purple'),
# arrowprops=dict(arrowstyle="wedge,tail_width=1.",
# facecolor='white', edgecolor='purple',
# patchA=None,
# patchB=el,
# relpos=(0.2, 0.8),
# connectionstyle="arc3,rad=-0.1"),
# alpha=0.5
# )
adjrecs= [rec for rec in quotes[u'相对复权'] if rec[0] >= firstday and rec[0] <= lastday]
if self._name == 'pricefs':
fsize= 3.0
ycoord= yhighlim/1.3
alpha= 1.0
else:
fsize= 5.0
ycoord= yhighlim/1.12
alpha= 1.0
for dstr, afac in adjrecs:
idx= self._dates.index(dstr)
axes.plot([idx, idx], [ylowlim, yhighlim], '-', color='purple', linewidth=0.1)
label= axes.text( \
idx, ycoord, \
u'复权 ' + str(afac) + u'\n' + dstr, \
fontproperties=__font_properties__, \
horizontalalignment='left', \
verticalalignment='top', \
color='purple', \
alpha=alpha
)
label.set_fontsize(fsize)
def plot_capchangenotes(self):
'''
绘制流通股本变更提示
注意两个问题:
1. 流通股本变更提示中的日期可能不是交易日期
2. 流通股本变更提示涵盖个股的所有历史,有些内容可能在绘图目标区间以外
'''
pdata= self._pdata
axes= self._Axes
ylowlim= self._ylowlim
yhighlim= self._yhighlim
firstday= self._dates[0]
lastday= self._dates[-1]
# 把目标区间之外的记录滤掉
changerecs= [rec for rec in pdata[u'公司信息'][u'流通股变更'] if rec[u'变更日期'] >= firstday and rec[u'变更日期'] <= lastday]
# 使用 annotate() 进行标注。不用了,留作纪念。
#===========================================================================================================================
# el= Ellipse((2, -1), 0.5, 0.5)
# for datestr, chrate in changerecs:
# dstr= [ds for ds in self._dates if ds >= datestr][0]
# idx= self._dates.index(dstr)
# axes.plot([idx, idx], [ylowlim, yhighlim], '-', color='yellow', linewidth=0.1)
# axes.annotate(u'流通股\n' + str(chrate),
# fontproperties=__font_properties__,
# xy=(idx, yhighlim/1.1), xycoords='data',
# xytext=(10, 5), textcoords='offset points', size=5, verticalalignment="center",
# bbox=dict(boxstyle="round", facecolor='white', edgecolor='yellow'),
# arrowprops=dict(arrowstyle="wedge,tail_width=1.",
# facecolor='white', edgecolor='yellow',
# patchA=None,
# patchB=el,
# relpos=(0.2, 0.8),
# connectionstyle="arc3,rad=-0.1"),
# alpha=0.5
# )
if self._name == 'pricefs':
fsize= 3.0
ycoord= yhighlim/1.1
alpha= 1.0
else:
fsize= 5.0
ycoord= yhighlim/1.05
alpha= 0.8
for record in changerecs:
datestr= record[u'变更日期']
chrate= record[u'变更比']
dstr= [ds for ds in self._dates if ds >= datestr][0]
idx= self._dates.index(dstr)
axes.plot([idx, idx], [ylowlim, yhighlim], '-', color='yellow', linewidth=0.1)
label= axes.text( \
idx, ycoord, \
u'流通股 ' + str(chrate) + u'\n' + datestr, \
fontproperties=__font_properties__, \
horizontalalignment='left', \
verticalalignment='top', \
color='yellow', \
alpha=alpha
)
label.set_fontsize(fsize)
def plot_candlestick_2(self):
'''
绘制第二条 K 线
'''
xindex= self._xindex
axes= self._Axes_2
up= self._up_2
down= self._down_2
side= self._side_2
# 对开收盘价进行视觉修正
for idx, poc in enumerate( self._zipoc_2 ):
if poc[0] == poc[1] and None not in poc:
self._open_2[idx]= poc[0] - 5 # 稍微偏离一点,使得在图线上不致于完全看不到
self._close_2[idx]= poc[1] + 5
rarray_open= numpy.array(self._open_2)
rarray_close= numpy.array(self._close_2)
rarray_high= numpy.array(self._high_2)
rarray_low= numpy.array(self._low_2)
# XXX: 如果 up, down, side 里有一个全部为 False 组成,那么 vlines() 会报错。
# XXX: 可以使用 alpha 参数调节透明度
if True in up:
axes.vlines(xindex[up], rarray_low[up], rarray_high[up], edgecolor='0.7', linewidth=0.6, label='_nolegend_', alpha=0.5)
axes.vlines(xindex[up], rarray_open[up], rarray_close[up], edgecolor='0.7', linewidth=3.0, label='_nolegend_', alpha=0.5)
if True in down:
axes.vlines(xindex[down], rarray_low[down], rarray_high[down], edgecolor='0.3', linewidth=0.6, label='_nolegend_', alpha=0.5)
axes.vlines(xindex[down], rarray_open[down], rarray_close[down], edgecolor='0.3', linewidth=3.0, label='_nolegend_', alpha=0.5)
if True in side:
axes.vlines(xindex[side], rarray_low[side], rarray_high[side], edgecolor='1.0', linewidth=0.6, label='_nolegend_', alpha=1.0)
axes.vlines(xindex[side], rarray_open[side], rarray_close[side], edgecolor='1.0', linewidth=3.0, label='_nolegend_', alpha=1.0)
def plot_capitalinfo(self):
'''
绘制行情首日和尾日的股本信息
'''
def find_biggestblank(didx):
'''
找出 X 轴某个位置图中最大的空隙
'''
pstart= self._open[0]
ptarget= self._open[didx]
compseq= [yhighlim, ptarget, ylowlim]
if u'开盘二' in quotes:
pstart_2= self._open_2[0]
ptarget_2= self._open_2[didx]
padjust= int(ptarget_2 * pstart / float(pstart_2))
compseq.append(padjust)
compseq.sort(reverse=True) # 图中的三个或四个关键点,高到底排序
diff, hi, low= max([(math.log(compseq[idx]/float(compseq[idx+1]), expbase), compseq[idx], compseq[idx+1]) for idx in range(len(compseq)-1)])
# XXX: for debugging
# print(compseq)
# print([diff, hi, low])
return (hi*low)**0.5 # 相乘再开平方,在 log 坐标系里看起来就是在中间位置。
def repr_int(intnum):
'''
123456789 --> '1,2345,6789'
'''
if type(intnum) not in (int, long): return str(intnum)
if intnum == 0: return '0'
if intnum < 0:
intnum= -intnum
isminus= True
else:
isminus= False
intstr= str(intnum)
intstr= '0'*((4-len(intstr)%4)%4) + intstr
intlist= [intstr[i:i+4] for i in range(0, len(intstr), 4)]
intlist[0]= intlist[0].lstrip('0')
return ('-' + ','.join(intlist)) if isminus else ','.join(intlist)
pdata= self._pdata
quotes= pdata[u'行情']
ylowlim= self._ylowlim
yhighlim= self._yhighlim
length= self._length
expbase= self._expbase
capinfo= pdata[u'公司信息'][u'股本变更记录']
axes= self._Axes
firstday, lastday= self._dates[0], self._dates[-1]
fsize= 5.0 if self._name == 'price' else 3.0
# 首日总股本与流通股信息
#====================================================================================================================================
chunk= [rec for rec in capinfo if rec[u'变更日期'] <= firstday]
if chunk:
allshares= repr_int(chunk[-1][u'总股本'])
circulating= repr_int(chunk[-1][u'流通股'])
else:
allshares= 'None'
circulating= 'None'
infostr= u'总股本: ' + allshares + '\n' + u'流通股: ' + circulating
label= axes.text(0, find_biggestblank(didx=0), infostr, fontproperties=__font_properties__, color='0.7')
label.set_fontsize(fsize)
# label.set_zorder(0) # XXX: 放在底层
# 尾日总股本与流通股信息
#====================================================================================================================================
chunk= [rec for rec in capinfo if rec[u'变更日期'] <= lastday]
if chunk:
allshares= repr_int(chunk[-1][u'总股本'])
circulating= repr_int(chunk[-1][u'流通股'])
else:
allshares= 'None'
circulating= 'None'
infostr= u'总股本: ' + allshares + '\n' + u'流通股: ' + circulating
label= axes.text(length-1, find_biggestblank(didx=length-1), infostr, fontproperties=__font_properties__, horizontalalignment='right', color='0.7')
label.set_fontsize(fsize)
# label.set_zorder(0) # XXX: 放在底层
def plot_usernotes(self):
'''
'''
pdata= self._pdata
quotes= pdata[u'行情']
sidx= self._pdata[u'任务描述'][u'起始偏移']
eidx= self._pdata[u'任务描述'][u'结束偏移']
axes= self._Axes
usernotes= pdata[u'用户标记']
alldates= quotes[u'日期'][sidx:eidx]
lowprices= quotes[u'最低'][sidx:eidx]
expbase= self._expbase
# 绘制短线买点标记
for note in usernotes:
if note[u'类型'] == u'筛选结果':
dstr= note[u'日期']
# 日期不在绘图区间范围内,忽略
if dstr not in alldates:
continue
# 决定箭头的颜色
result= note[u'结果']
color= 'magenta' if result == u'上涨' else 'cyan' if result == u'下跌' else 'white'
# 箭头的起始位置
idx= alldates.index(dstr)
xpos= idx
ypos= lowprices[idx] / expbase
# 箭头的长度
dx= 0.0
dy= ypos * (expbase-1) * 0.9
# 头端的长度
head_length= dy * 0.2
# 绘制箭头
arrow_params={'length_includes_head':True, 'shape':'full', 'head_starts_at_zero':False}
axes.arrow(xpos, ypos, dx, dy, facecolor=color, edgecolor=color, linewidth=0.7, head_width=0.6, head_length=head_length, **arrow_params)
def plot_vlines(self):
xindex= self._xindex
up= self._up
down= self._down
side= self._side
axes= self._Axes
lwidth= 2.4 * self._shrink
# 绘制 K 线部分
#==================================================================================================================================================
rarray_high= numpy.array(self._high)
rarray_low= numpy.array(self._low)
# XXX: 如果 up, down, side 里有一个全部为 False 组成,那么 vlines() 会报错。
# XXX: 可以使用 alpha 参数调节透明度
if True in up:
axes.vlines(xindex[up], rarray_low[up], rarray_high[up], edgecolor='red', linewidth=lwidth, label='_nolegend_', alpha=0.5)
if True in down:
axes.vlines(xindex[down], rarray_low[down], rarray_high[down], edgecolor='green', linewidth=lwidth, label='_nolegend_', alpha=0.5)
if True in side:
axes.vlines(xindex[side], rarray_low[side], rarray_high[side], edgecolor='0.7', linewidth=lwidth, label='_nolegend_', alpha=0.5)
def plot_vlines_2(self):
xindex= self._xindex
axes= self._Axes_2
up= self._up_2
down= self._down_2
side= self._side_2
lwidth= 2.4 * self._shrink
rarray_high= numpy.array(self._high_2)
rarray_low= numpy.array(self._low_2)
# XXX: 如果 up, down, side 里有一个全部为 False 组成,那么 vlines() 会报错。
# XXX: 可以使用 alpha 参数调节透明度
if True in up:
axes.vlines(xindex[up], rarray_low[up], rarray_high[up], edgecolor='0.7', linewidth=lwidth, label='_nolegend_', alpha=0.5)
if True in down:
axes.vlines(xindex[down], rarray_low[down], rarray_high[down], edgecolor='0.3', linewidth=lwidth, label='_nolegend_', alpha=0.5)
if True in side:
axes.vlines(xindex[side], rarray_low[side], rarray_high[side], edgecolor='1.0', linewidth=lwidth, label='_nolegend_', alpha=1.0)
def plot_datenotes(self):
'''
内部的日期注释,由派生类定义
'''
pass
def plot_pricenotes(self):
'''
内部的价格注释,由派生类定义
'''
pass
class SubPlot_PriceFullSpan(SubPlot_PriceBase):
'''
'''
def plot(self):
'''
绘图
'''
pdata= self._pdata
# if u'简化' in pdata:
# self.plot_simplified()
# else:
# self.plot_candlestick()
self.plot_vlines()
self.plot_average()
if u'相对复权' in pdata[u'行情']:
self.plot_adjustnotes()
if u'流通股变更' in pdata[u'公司信息']:
self.plot_capchangenotes()
if u'股本变更记录' in pdata[u'公司信息']:
self.plot_capitalinfo()
self.set_xticks()
self.set_yticks()
if u'开盘二' in pdata[u'行情']:
self.plot_vlines_2()
self.set_xticks_2()
self.set_yticks_2()
self.plot_datenotes()
if 'price' in self._parent._subplots:
self.plot_windowspan()
def plot_datenotes(self):
'''
日期在图中间的显示
'''
ylowlim= self._ylowlim
axes= self._Axes
sdindex= self._xparams['sdindex']
mdindex= self._xparams['mdindex']
# 每季度第一个交易日
for ix in sdindex:
newlab= axes.text(ix - (1/self._shrink), ylowlim*1.03, self._dates[ix])
newlab.set_font_properties(__font_properties__)
newlab.set_color('0.3')
newlab.set_fontsize(4)
newlab.set_rotation('45')
# newlab.set_rotation('vertical')
# newlab.set_horizontalalignment('left')
# newlab.set_verticalalignment('bottom')
# newlab.set_verticalalignment('center')
newlab.set_zorder(0) # XXX: 放在底层
# 每月第一个交易日
for ix in mdindex:
newlab= axes.text(ix - (0.8/self._shrink), ylowlim * 1.03, self._dates[ix])
newlab.set_font_properties(__font_properties__)
newlab.set_color('0.3')
newlab.set_fontsize(3)
newlab.set_rotation('45')
# newlab.set_rotation('vertical')
# newlab.set_horizontalalignment('left')
# newlab.set_verticalalignment('top') # 不行
# newlab.set_verticalalignment('center')
# newlab.set_verticalalignment('bottom')
newlab.set_zorder(0) # XXX: 放在底层
def plot_windowspan(self):
axes= self._Axes
jobstat= self._pdata[u'任务描述']
sindex, eindex= jobstat[u'起始偏移'], jobstat[u'结束偏移']
hibdry, lobdry= self._parent._subplots['price'].get_ylimits()
xcoord= sindex - 1
width= eindex - sindex + 1
ycoord= lobdry
height= hibdry - lobdry
window= matplotlib.patches.Rectangle((xcoord, ycoord), width, height, fill=False, edgecolor=__color_lightblue__, linewidth=0.3, alpha=0.7)
window.set_zorder(-1) # 放在底层
axes.add_patch(window)
class SubPlot_Price(SubPlot_PriceBase):
'''
'''
def plot(self):
'''
绘图
'''
pdata= self._pdata
# if u'简化' in pdata:
# self.plot_simplified()
# else:
# self.plot_candlestick()
self.plot_candlestick()
self.plot_average()
if u'相对复权' in pdata[u'行情']:
self.plot_adjustnotes()
if u'流通股变更' in pdata[u'公司信息']:
self.plot_capchangenotes()
if u'股本变更记录' in pdata[u'公司信息']:
self.plot_capitalinfo()
if u'用户标记' in pdata:
self.plot_usernotes()
self.set_xticks()
self.set_yticks()
if u'开盘二' in pdata[u'行情']:
self.plot_candlestick_2()
self.set_xticks_2()
self.set_yticks_2()
self.plot_pricenotes()
self.plot_datenotes()
def plot_datenotes(self):
'''
日期在图中间的显示
'''
ylowlim= self._ylowlim
yhighlim= self._yhighlim
axes= self._Axes
mdindex= self._xparams['mdindex']
wdindex= self._xparams['wdindex']
# 每月第一个交易日
for iy in [ylowlim*1.1, yhighlim/1.21]:
for ix in mdindex:
newlab= axes.text(ix-1, iy, self._dates[ix])
newlab.set_font_properties(__font_properties__)
newlab.set_color('0.3')
newlab.set_fontsize(4)
newlab.set_rotation('vertical')
# newlab.set_horizontalalignment('left')
# newlab.set_verticalalignment('bottom')
# newlab.set_verticalalignment('center')
newlab.set_zorder(0) # XXX: 放在底层
# 每周第一个交易日,根据这个可以推算出全部确切的日期。
# for iy in minorticks[0:-1:6]:
for iy in [ylowlim*1.01, yhighlim/1.09]:
for ix in wdindex:
newlab= axes.text(ix-0.8, iy, self._dates[ix])
newlab.set_font_properties(__font_properties__)
newlab.set_color('0.3')
newlab.set_fontsize(3)
newlab.set_rotation('vertical')
# newlab.set_horizontalalignment('left')
# newlab.set_verticalalignment('top') # 不行
# newlab.set_verticalalignment('center')
# newlab.set_verticalalignment('bottom')
newlab.set_zorder(0) # XXX: 放在底层
def plot_pricenotes(self):
# 价格数值在图中间的显示
#==================================================================================================================================================
quotes= self._pdata[u'行情']
axes= self._Axes
majorticks= self._ytickset['major']
minorticks= self._ytickset['minor']
mdindex= self._xparams['mdindex']
def price_note(num):
return str(round(num/1000.0, 2))
if u'开盘二' in quotes:
majorticks_2= self._ytickset['major_2']
minorticks_2= self._ytickset['minor_2']
for iy, iy2 in zip(sorted(majorticks[:-1] + minorticks[1:-1]), sorted(majorticks_2[:-1] + minorticks_2[1:-1])):
for ix in mdindex[1:-1:3]:
newlab= axes.text(ix+6, iy*1.001, price_note(iy) + ' / ' + price_note(iy2))
newlab.set_font_properties(__font_properties__)
newlab.set_color('0.3')
newlab.set_fontsize(3)
newlab.set_zorder(0) # XXX: 放在底层
else:
for iy in sorted(majorticks[:-1] + minorticks[1:-1]):
for ix in mdindex[1:-1:3]:
newlab= axes.text(ix+9, iy*1.001, price_note(iy))
newlab.set_font_properties(__font_properties__)
newlab.set_color('0.3')
newlab.set_fontsize(3)
newlab.set_zorder(0) # XXX: 放在底层
class SubPlot_TORateBase:
'''
换手率子图
'''
def __init__(self, pdata, parent, xparams, name):
self._name= name
self._pdata= pdata
self._parent= parent
self._xparams= xparams
self._shrink= __shrink__ if name == 'toratefs' else 1.0
self._tostep= 0 # 每一格代表的换手率数值
self._yrange= 0
self._xsize= 0 # int
self._ysize= 0 # int
self._Axes= None
self._AxisX= None
self._AxisY= None
if u'换手率二' in pdata[u'行情']:
self._Axes_2= None
self._AxisX_2= None
self._AxisY_2= None
self._tostep_2= 0
# 绘图数据
quotes= pdata[u'行情']
if name == 'toratefs':
self._dates= quotes[u'日期']
self._open= quotes[u'开盘']
self._close= quotes[u'收盘']
self._high= quotes[u'最高']
self._low= quotes[u'最低']
if u'简化' in quotes: self._simple= quotes[u'简化']
if u'换手率' in quotes: self._torate= quotes[u'换手率']
if u'成交量' in quotes: self._volume= quotes[u'成交量']
if u'成交额' in quotes: self._turnover= quotes[u'成交额']
if u'开盘二' in quotes:
self._open_2= quotes[u'开盘二']
self._close_2= quotes[u'收盘二']
self._high_2= quotes[u'最高二']
self._low_2= quotes[u'最低二']
if u'简化二' in quotes: self._simple_2= quotes[u'简化二']
if u'换手率二' in quotes: self._torate_2= quotes[u'换手率二']
if u'成交量二' in quotes: self._volume_2= quotes[u'成交量二']
if u'成交额二' in quotes: self._turnover_2= quotes[u'成交额二']
else:
sidx, eidx= pdata[u'任务描述'][u'起始偏移'], pdata[u'任务描述'][u'结束偏移']
self._dates= quotes[u'日期'][sidx:eidx]
self._open= quotes[u'开盘'][sidx:eidx]
self._close= quotes[u'收盘'][sidx:eidx]
self._high= quotes[u'最高'][sidx:eidx]
self._low= quotes[u'最低'][sidx:eidx]
if u'简化' in quotes: self._simple= quotes[u'简化'][sidx:eidx]
if u'换手率' in quotes: self._torate= quotes[u'换手率'][sidx:eidx]
if u'成交量' in quotes: self._volume= quotes[u'成交量'][sidx:eidx]
if u'成交额' in quotes: self._turnover= quotes[u'成交额'][sidx:eidx]
if u'开盘二' in quotes:
self._open_2= quotes[u'开盘二'][sidx:eidx]
self._close_2= quotes[u'收盘二'][sidx:eidx]
self._high_2= quotes[u'最高二'][sidx:eidx]
self._low_2= quotes[u'最低二'][sidx:eidx]
if u'简化二' in quotes: self._simple_2= quotes[u'简化二'][sidx:eidx]
if u'换手率二' in quotes: self._torate_2= quotes[u'换手率二'][sidx:eidx]
if u'成交量二' in quotes: self._volume_2= quotes[u'成交量二'][sidx:eidx]
if u'成交额二' in quotes: self._turnover_2= quotes[u'成交额二'][sidx:eidx]
# 衍生数据
#==============================================================================================================
self._length= len(self._dates)
self._xindex= numpy.arange(self._length) # X 轴上的 index,一个辅助数据
self._zipoc= zip(self._open, self._close)
self._up= numpy.array( [ True if po < pc and po is not None else False for po, pc in self._zipoc] ) # 标示出该天股价日内上涨的一个序列
self._down= numpy.array( [ True if po > pc and po is not None else False for po, pc in self._zipoc] ) # 标示出该天股价日内下跌的一个序列
self._side= numpy.array( [ True if po == pc and po is not None else False for po, pc in self._zipoc] ) # 标示出该天股价日内走平的一个序列
if u'开盘二' in quotes:
self._zipoc_2= zip(self._open_2, self._close_2)
self._up_2= numpy.array( [ True if po < pc and po is not None else False for po, pc in self._zipoc_2] ) # 标示出该天股价日内上涨的一个序列
self._down_2= numpy.array( [ True if po > pc and po is not None else False for po, pc in self._zipoc_2] ) # 标示出该天股价日内下跌的一个序列
self._side_2= numpy.array( [ True if po == pc and po is not None else False for po, pc in self._zipoc_2] ) # 标示出该天股价日内走平的一个序列
self._compute_size()
def _compute_size(self):
'''
根据 pdata 计算自身尺寸
'''
def _compute_step(maxto):
'''
maxto 是 换手率 最大值。返回每格单位(最小 500, 代表 0.5%)以及格数
'''
for i in range(9):
if maxto > (4 * 500 * (2**i)): # 换手率最大是 100000, 代表 100%
continue
else:
tostep= 500 * (2**i)
tosize= int(round((maxto + tostep/2.0 - 1) / float(tostep), 0))
break
return (tostep, tosize)
quotes= self._pdata[u'行情']
xmargin= self._xparams['xmargin']
self._xsize= (self._length + xmargin*2) * self._shrink
maxto= max(self._torate)
self._tostep, self._yrange= _compute_step(maxto=maxto)
if u'换手率二' in quotes:
maxto_2= max(self._torate_2)
self._tostep_2, yrange_2= _compute_step(maxto=maxto_2)
self._yrange= max(self._yrange, yrange_2) # 成交量部分在 Y 轴所占的 “份数”
self._ysize= self._yrange * self._shrink
def get_size(self):
return (self._xsize, self._ysize)
def build_axes(self, figobj, rect):
# 第一只:添加 Axes 对象
#==================================================================================================================================================
axes= figobj.add_axes(rect, axis_bgcolor='black')
axes.set_axis_bgcolor('black')
axes.set_axisbelow(True) # 网格线放在底层
# 第一只:改变坐标线的颜色
#==================================================================================================================================================
for child in axes.get_children():
if isinstance(child, matplotlib.spines.Spine):
child.set_color(__color_gold__)
# child.set_zorder(3) # XXX: 放在上层,好像没什么用。
# 得到 X 轴 和 Y 轴 的两个 Axis 对象
#==================================================================================================================================================
xaxis= axes.get_xaxis()
yaxis= axes.get_yaxis()
# 设置两个坐标轴上的 grid
#==================================================================================================================================================
xaxis.grid(True, 'major', color='0.3', linestyle='solid', linewidth=0.2)
xaxis.grid(True, 'minor', color='0.3', linestyle='dotted', linewidth=0.1)
yaxis.grid(True, 'major', color='0.3', linestyle='solid', linewidth=0.2)
yaxis.grid(True, 'minor', color='0.3', linestyle='solid', linewidth=0.1)
self._Axes= axes
self._AxisX= xaxis
self._AxisY= yaxis
if u'换手率二' in self._pdata[u'行情']:
# 添加 Axes 对象
#==================================================================================================================================================
axes_2= axes.twinx()
# XXX: 下面这三行把第一个 axes 放在上面,这样不会被第二个 axes 的图形遮盖。用 zorder 不顶用。
axes.figure.axes[-2:]= [axes_2, axes] # XXX: 把第一个 axes 放在上面,用 zorder 不顶用。
axes.set_frame_on(False) # 如果不做此设定,axes_2 的内容会看不见
axes_2.set_frame_on(True)
axes_2.set_axis_bgcolor('black')
axes_2.set_axisbelow(True) # 网格线放在底层
# 改变坐标线的颜色
#==================================================================================================================================================
for child in axes_2.get_children():
if isinstance(child, matplotlib.spines.Spine):
child.set_color(__color_gold__)
# 得到 X 轴 和 Y 轴 的两个 Axis 对象
#==================================================================================================================================================
xaxis_2= axes_2.get_xaxis()
yaxis_2= axes_2.get_yaxis()
# 设置网格线
#==================================================================================================================================================
# xaxis_2.grid(True, 'major', color='0.3', linestyle='solid', linewidth=0.2)
# xaxis_2.grid(True, 'minor', color='0.3', linestyle='dotted', linewidth=0.1)
# yaxis_2.grid(True, 'major', color='0.3', linestyle='solid', linewidth=0.2)
# yaxis_2.grid(True, 'minor', color='0.3', linestyle='dotted', linewidth=0.1)
self._Axes_2= axes_2
self._AxisX_2= xaxis_2
self._AxisY_2= yaxis_2
def get_axes(self):
return self._Axes
def plot(self):
'''
绘制换手率图形
'''
self.plot_torate()
self.set_xticks()
self.set_yticks()
if u'换手率二' in self._pdata[u'行情']:
self.plot_torate_2()
self.set_xticks_2()
self.set_yticks_2()
def plot_torate(self):
'''
绘制换手率
'''
xindex= self._xindex
stopset= self._xparams['mdindex'] if self._name == 'torate' else self._xparams['sdindex']
axes= self._Axes
up= self._up
down= self._down
side= self._side
rarray_to= numpy.array(self._torate)
tozeros= numpy.zeros(self._length) # 辅助数据
lwidth= 3.0 if self._name == 'torate' else 2.4 * self._shrink
# XXX: 如果 up/down/side 各项全部为 False,那么 vlines() 会报错。
if True in up:
axes.vlines(xindex[up], tozeros[up], rarray_to[up], edgecolor='red', linewidth=lwidth, label='_nolegend_', alpha=0.5)
if True in down:
axes.vlines(xindex[down], tozeros[down], rarray_to[down], edgecolor='green', linewidth=lwidth, label='_nolegend_', alpha=0.5)
if True in side:
axes.vlines(xindex[side], tozeros[side], rarray_to[side], edgecolor='0.7', linewidth=lwidth, label='_nolegend_', alpha=0.5)
# 绘制平均换手率(直线)
toeffect= [num for num in self._torate if num is not None]
toaverage= sum(toeffect) / float(len(toeffect))
axes.plot([-1, self._length], [toaverage, toaverage], '-', color='yellow', linewidth=0.2, alpha=0.7)
# 换手率数值在图中间的显示
#==================================================================================================================================================
for ix in stopset[2:-1:3]:
newlab= axes.text(ix+8, toaverage, str(round(toaverage/1000.0, 2)) + '%')
newlab.set_font_properties(__font_properties__)
newlab.set_color('yellow')
newlab.set_fontsize(3)
# newlab.set_zorder(0) # XXX: 放在底层
# newlab.set_verticalalignment('center')
def plot_torate_2(self):
'''
绘制第二条换手率柱状图
'''
quotes= self._pdata[u'行情']
xindex= self._xindex
axes= self._Axes_2
up= self._up_2
down= self._down_2
side= self._side_2
rarray_to= numpy.array(self._torate_2)
tozeros= numpy.zeros(self._length) # 辅助数据
lwidth, alpha= (0.7, 0.5) if self._name == 'torate' else (0.3, 0.7)
# XXX: 如果 up/down/side 各项全部为 False,那么 vlines() 会报错。
if True in up:
axes.vlines(xindex[up], tozeros[up], rarray_to[up], edgecolor='0.7', linewidth=lwidth, label='_nolegend_', alpha=alpha)
if True in down:
axes.vlines(xindex[down], tozeros[down], rarray_to[down], edgecolor='0.3', linewidth=lwidth, label='_nolegend_', alpha=alpha)
if True in side:
axes.vlines(xindex[side], tozeros[side], rarray_to[side], edgecolor='0.7', linewidth=lwidth, label='_nolegend_', alpha=1.0)
def set_xticks(self):
'''
X 轴坐标
'''
length= self._length
xmargin= self._xparams['xmargin']
axes= self._Axes
xaxis= self._AxisX
# xaxis.set_tick_params(which='both', direction='out') # XXX: 坐标点设到外面去,也可以用 Axes.tick_params(),好像 matplotlib 1.0.1 才有
# 设定 X 轴坐标的范围
#==================================================================================================================================================
axes.set_xlim(-xmargin, length + xmargin)
xMajorLocator= self._xparams['xMajorLocator']
xMinorLocator= self._xparams['xMinorLocator']
xMajorFormatter= self._xparams['xMajorFormatter']
xMinorFormatter= self._xparams['xMinorFormatter']
# 设定 X 轴的 Locator 和 Formatter
xaxis.set_major_locator(xMajorLocator)
xaxis.set_minor_locator(xMinorLocator)
if self._name == 'torate':
xaxis.set_major_formatter(xMajorFormatter)
xaxis.set_minor_formatter(xMinorFormatter)
# 设定 X 轴主要坐标点与辅助坐标点的样式
for mal in axes.get_xticklabels(minor=False):
mal.set_fontsize(4)
mal.set_horizontalalignment('right')
mal.set_rotation('45')
for mil in axes.get_xticklabels(minor=True):
mil.set_fontsize(4)
mil.set_color('blue')
mil.set_horizontalalignment('right')
mil.set_rotation('45')
else:
# 设为不可见
for mal in axes.get_xticklabels(minor=False):
mal.set_visible(False)
for mil in axes.get_xticklabels(minor=True):
mil.set_visible(False)
def set_xticks_2(self):
length= self._length
xmargin= self._xparams['xmargin']
axes= self._Axes_2
xaxis= self._AxisX_2
# xaxis.set_tick_params(which='both', direction='out') # XXX: 坐标点设到外面去,也可以用 Axes.tick_params(),好像 matplotlib 1.0.1 才有
# 设定 X 轴坐标的范围
#==================================================================================================================================================
axes.set_xlim(-xmargin, length + xmargin)
xMajorLocator= self._xparams['xMajorLocator']
xMinorLocator= self._xparams['xMinorLocator']
# 设定 X 轴的 Locator 和 Formatter
xaxis.set_major_locator(xMajorLocator)
xaxis.set_minor_locator(xMinorLocator)
# 设为不可见
for mal in axes.get_xticklabels(minor=False):
mal.set_visible(False)
for mil in axes.get_xticklabels(minor=True):
mil.set_visible(False)
def set_yticks(self):
'''
设置 Y 轴坐标
'''
axes= self._Axes
yaxis= self._AxisY
tostep= self._tostep
yrange= self._yrange
stopset= self._xparams['mdindex'] if self._name == 'torate' else self._xparams['sdindex']
# 设定换手率 Y 轴坐标的范围
#==================================================================================================================================================
axes.set_ylim(0, tostep*yrange)
# 主要坐标点
#==================================================================================================================================================
majorticks= [tostep*i for i in range(yrange)]
yMajorLocator= FixedLocator(numpy.array(majorticks))
# 确定 Y 轴的 MajorFormatter
def y_major_formatter(num, pos=None):
return str(round(num/1000.0, 2)) + '%'
yMajorFormatter= FuncFormatter(y_major_formatter)
# 确定 Y 轴的 MinorFormatter
yMinorFormatter= NullFormatter()
# 第一只:设定 X 轴的 Locator 和 Formatter
yaxis.set_major_locator(yMajorLocator)
yaxis.set_major_formatter(yMajorFormatter)
# 设定 Y 轴主要坐标点的样式
for mal in axes.get_yticklabels(minor=False):
mal.set_font_properties(__font_properties__)
mal.set_fontsize(5) # 这个必须放在前一句后面,否则作用会被覆盖
# 辅助坐标点
#==================================================================================================================================================
if self._name == 'torate':
minorticks= list( itertools.chain.from_iterable( mi for mi in [[ma + (tostep/4.0)*i for i in range(1, 4)] for ma in majorticks] ) )
yMinorLocator= FixedLocator(numpy.array(minorticks))
yaxis.set_minor_locator(yMinorLocator)
def y_minor_formatter(num, pos=None):
return str(round(num/1000.0, 3)) + '%'
yMinorFormatter= FuncFormatter(y_minor_formatter)
yaxis.set_minor_formatter(yMinorFormatter)
# 设定 Y 轴主要坐标点的样式
for mil in axes.get_yticklabels(minor=True):
mil.set_font_properties(__font_properties__)
mil.set_fontsize(4) # 这个必须放在前一句后面,否则作用会被覆盖
else:
# minorticks= list( itertools.chain.from_iterable( mi for mi in [[ma + (tostep/4.0)*i for i in range(1, 4)] for ma in majorticks] ) )
minorticks= list( [ma + (tostep/2.0) for ma in majorticks] )
yMinorLocator= FixedLocator(numpy.array(minorticks))
yaxis.set_minor_locator(yMinorLocator)
# 设定 Y 轴主要坐标点的样式
for mil in axes.get_yticklabels(minor=True):
mil.set_visible(False)
# 换手率数值在图中间的显示
#==================================================================================================================================================
for iy in range(int(tostep/2.0), tostep*yrange, int(tostep/2.0)):
for ix in stopset[1:-1:3]:
newlab= axes.text(ix+8, iy, y_major_formatter(iy))
newlab.set_font_properties(__font_properties__)
newlab.set_color('0.3')
newlab.set_fontsize(3)
newlab.set_zorder(0) # XXX: 放在底层
# newlab.set_verticalalignment('center')
def set_yticks_2(self):
'''
设置 Y 轴坐标
'''
axes= self._Axes_2
yaxis= self._AxisY_2
tostep= self._tostep_2
yrange= self._yrange # 与 1 是一样的
# 设定换手率 Y 轴坐标的范围
#==================================================================================================================================================
axes.set_ylim(0, tostep*yrange)
# 主要坐标点
#==================================================================================================================================================
majorticks= [tostep*i for i in range(yrange)]
yMajorLocator= FixedLocator(numpy.array(majorticks))
# 确定 Y 轴的 MajorFormatter
def y_major_formatter(num, pos=None):
return str(round(num/1000.0, 2)) + '%'
yMajorFormatter= FuncFormatter(y_major_formatter)
# 确定 Y 轴的 MinorFormatter
yMinorFormatter= NullFormatter()
# 第一只:设定 X 轴的 Locator 和 Formatter
yaxis.set_major_locator(yMajorLocator)
yaxis.set_major_formatter(yMajorFormatter)
# 设定 Y 轴主要坐标点的样式
for mal in axes.get_yticklabels(minor=False):
mal.set_font_properties(__font_properties__)
mal.set_fontsize(5) # 这个必须放在前一句后面,否则作用会被覆盖
# 辅助坐标点
#==================================================================================================================================================
if self._name == 'torate':
minorticks= list( itertools.chain.from_iterable( mi for mi in [[ma + (tostep/4.0)*i for i in range(1, 4)] for ma in majorticks] ) )
yMinorLocator= FixedLocator(numpy.array(minorticks))
def y_minor_formatter(num, pos=None):
return str(round(num/1000.0, 3)) + '%'
yMinorFormatter= FuncFormatter(y_minor_formatter)
yaxis.set_minor_locator(yMinorLocator)
yaxis.set_minor_formatter(yMinorFormatter)
# 设定 Y 轴主要坐标点的样式
for mil in axes.get_yticklabels(minor=True):
mil.set_font_properties(__font_properties__)
mil.set_fontsize(4) # 这个必须放在前一句后面,否则作用会被覆盖
else:
minorticks= list( [ma + (tostep/2.0) for ma in majorticks] )
yMinorLocator= FixedLocator(numpy.array(minorticks))
yaxis.set_minor_locator(yMinorLocator)
# 设定 Y 轴主要坐标点的样式
for mil in axes.get_yticklabels(minor=True):
mil.set_visible(False)
class SubPlot_TORate(SubPlot_TORateBase):
pass
class SubPlot_TORateFullSpan(SubPlot_TORateBase):
pass
class MyFigure:
'''
'''
def __init__(self, pdata):
self._pdata= pdata # 绘图数据
self._figfacecolor= __color_pink__
self._figedgecolor= __color_navy__
self._figdpi= 300
self._figlinewidth= 1.0
self._xfactor= 10.0 / 230.0 # x size * x factor = x length
self._yfactor= 0.3 # y size * y factor = y length
jobstat= pdata[u'任务描述']
self._xsize_left= 12.0 # left blank
self._xsize_right= 12.0 # right blank
self._ysize_top= 0.3 # top blank
self._ysize_bottom= 1.2 # bottom blank
self._ysize_gap1= 0.2
self._ysize_gap2= 0.3 if (jobstat[u'历史价格子图'] or jobstat[u'历史换手率子图'] or jobstat[u'财务指标子图']) else 0.0
# 建立 X 轴参数
#===============================================================================================================
if jobstat[u'价格子图'] or jobstat[u'换手率子图']:
xparams= {'xmargin': 1}
xparams.update(self._compute_xparams()) # 与 X 轴坐标点相关的数据结构
if jobstat[u'历史价格子图'] or jobstat[u'历史换手率子图'] or jobstat[u'财务指标子图']:
xparams_fs= {'xmargin': 3}
xparams_fs.update(self._compute_xparams_fullspan())
# 建立子图对象
#===============================================================================================================
self._subplots= {}
if jobstat[u'公司信息子图']:
name= 'basic'
self._subplots[name]= SubPlot_BasicInfo(pdata=pdata, parent=self, name=name)
if jobstat[u'历史价格子图']: # XXX: 这个要放在 价格子图 前面,因为后者可能会用到它的 Y 轴坐标点位置
name= 'pricefs'
self._subplots[name]= SubPlot_PriceFullSpan(pdata=pdata, parent=self, xparams=xparams_fs, name=name)
if jobstat[u'价格子图']:
name= 'price'
self._subplots[name]= SubPlot_Price(pdata=pdata, parent=self, xparams=xparams, name=name)
if jobstat[u'财务指标子图']:
name= 'financial'
self._subplots[name]= SubPlot_Financial(pdata=pdata, parent=self, xparams=xparams_fs, name=name)
if jobstat[u'换手率子图']:
name= 'torate'
self._subplots[name]= SubPlot_TORate(pdata=pdata, parent=self, xparams=xparams, name=name)
if jobstat[u'历史换手率子图']:
name= 'toratefs'
self._subplots[name]= SubPlot_TORateFullSpan(pdata=pdata, parent=self, xparams=xparams_fs, name=name)
# 根据子图对象的尺寸计算自身的尺寸
#===============================================================================================================
self._xsize, \
self._ysize= self._compute_size()
self._xlength= self._xsize * self._xfactor
self._ylength= self._ysize * self._yfactor
# 根据计算出的尺寸建立 Figure 对象
#===============================================================================================================
self._Fig= pyplot.figure(figsize=(self._xlength, self._ylength), dpi=self._figdpi, facecolor=self._figfacecolor, \
edgecolor=self._figedgecolor, linewidth=self._figlinewidth) # Figure 对象
# 用新建立的 Figure 对象交给子图对象,完成子图对象的初始化
#===============================================================================================================
rects= self._compute_rect()
if 'basic' in self._subplots:
self._subplots['basic'].build_axes(figobj=self._Fig, rect=rects['basic'])
# XXX: 这个要放在 price 前面,因为后者要用到它的 Axes 对象
if 'torate' in self._subplots:
self._subplots['torate'].build_axes(figobj=self._Fig, rect=rects['torate'])
if 'price' in self._subplots:
self._subplots['price'].build_axes(figobj=self._Fig, rect=rects['price'])
# XXX: 这个要放在 pricefs 前面
if 'toratefs' in self._subplots:
self._subplots['toratefs'].build_axes(figobj=self._Fig, rect=rects['toratefs'])
if 'pricefs' in self._subplots:
self._subplots['pricefs'].build_axes(figobj=self._Fig, rect=rects['pricefs'])
def _compute_size(self):
'''
根据子图的尺寸计算自身尺寸
'''
pdata= self._pdata
jobstat= pdata[u'任务描述']
x_left, x_right= self._xsize_left, self._xsize_right
y_top, y_bottom= self._ysize_top, self._ysize_bottom
y_gap1= self._ysize_gap1
y_gap2= self._ysize_gap2
x_basic, y_basic= self._subplots['basic'].get_size() if 'basic' in self._subplots else (0.0, 0.0)
x_price, y_price= self._subplots['price'].get_size() if 'price' in self._subplots else (0.0, 0.0)
x_pricefs, y_pricefs= self._subplots['pricefs'].get_size() if 'pricefs' in self._subplots else (0.0, 0.0)
x_torate, y_torate= self._subplots['torate'].get_size() if 'torate' in self._subplots else (0.0, 0.0)
x_toratefs, y_toratefs= self._subplots['toratefs'].get_size() if 'toratefs' in self._subplots else (0.0, 0.0)
x_financial, y_financial= self._subplots['financial'].get_size() if 'financial' in self._subplots else (0.0, 0.0)
x_all= x_left + max(x_price, x_basic, x_pricefs) + x_right
y_all= y_top + y_basic + y_gap1 + y_pricefs + y_toratefs + y_financial + y_gap2 + y_price + y_torate + y_bottom
return (x_all, y_all)
def get_sizeset(self):
sizeset= {
'x': self._xsize,
'y': self._ysize,
'top': self._ysize_top,
'bottom': self._ysize_bottom,
'left': self._xsize_left,
'right': self._xsize_right
}
return sizeset
def _compute_rect(self):
'''
'''
pdata= self._pdata
jobstat= pdata[u'任务描述']
x_left= self._xsize_left
x_right= self._xsize_right
y_top= self._ysize_top
y_bottom= self._ysize_bottom
x_all= self._xsize
y_all= self._ysize
y_gap1= self._ysize_gap1 # basic 与 financial 之间的空隙
y_gap2= self._ysize_gap2 # toratefs 与 price 之间的空隙
x_basic, y_basic= self._subplots['basic'].get_size() if 'basic' in self._subplots else (0.0, 0.0)
x_price, y_price= self._subplots['price'].get_size() if 'price' in self._subplots else (0.0, 0.0)
x_pricefs, y_pricefs= self._subplots['pricefs'].get_size() if 'pricefs' in self._subplots else (0.0, 0.0)
x_torate, y_torate= self._subplots['torate'].get_size() if 'torate' in self._subplots else (0.0, 0.0)
x_toratefs, y_toratefs= self._subplots['toratefs'].get_size() if 'toratefs' in self._subplots else (0.0, 0.0)
x_financial, y_financial= self._subplots['financial'].get_size() if 'financial' in self._subplots else (0.0, 0.0)
rects= {}
if 'basic' in self._subplots:
rect= ((x_left + (x_all-x_left-x_right-x_basic)/2) / x_all, (y_all - y_top - y_basic)/y_all, x_basic/x_all, y_basic/y_all) # K线图部分
rects['basic']= rect
if 'price' in self._subplots:
rect= ((x_left + (x_all-x_left-x_right-x_price)/2) / x_all, (y_bottom + y_torate)/y_all, x_price/x_all, y_price/y_all) # K线图部分
rects['price']= rect
if 'torate' in self._subplots:
rect= ((x_left + (x_all-x_left-x_right-x_torate)/2)/x_all, y_bottom/y_all, x_torate/x_all, y_torate/y_all) # 成交量部分
rects['torate']= rect
if 'pricefs' in self._subplots:
rect= ((x_left + (x_all-x_left-x_right-x_pricefs)/2)/x_all, (y_all - y_top - y_basic - y_gap1 - y_pricefs)/y_all, x_pricefs/x_all, y_pricefs/y_all)
rects['pricefs']= rect
if 'toratefs' in self._subplots:
rect= ((x_left + (x_all-x_left-x_right-x_toratefs)/2)/x_all, (y_bottom + y_torate + y_price + y_gap2)/y_all, x_toratefs/x_all, y_toratefs/y_all)
rects['toratefs']= rect
return rects
def _compute_xparams(self):
'''
主要坐标点是每月第一个交易日,辅助坐标点是每周第一个交易日
'''
quotes= self._pdata[u'行情']
sidx= self._pdata[u'任务描述'][u'起始偏移']
eidx= self._pdata[u'任务描述'][u'结束偏移']
# 设定 X 轴上的坐标
#==================================================================================================================================================
datelist= [ datetime.date(int(ys), int(ms), int(ds)) for ys, ms, ds in [ dstr.split('-') for dstr in quotes[u'日期'][sidx:eidx] ] ]
# 确定 X 轴的 MajorLocator
mdindex= [] # 每个月第一个交易日在所有日期列表中的 index
allyears= set([d.year for d in datelist]) # 所有的交易年份
for yr in sorted(allyears):
allmonths= set([d.month for d in datelist if d.year == yr]) # 当年所有的交易月份
for mon in sorted(allmonths):
monthday= min([dt for dt in datelist if dt.year==yr and dt.month==mon]) # 当月的第一个交易日
mdindex.append(datelist.index(monthday))
xMajorLocator= FixedLocator(numpy.array(mdindex))
# 确定 X 轴的 MinorLocator
wdindex= {} # value: 每周第一个交易日在所有日期列表中的 index; key: 当周的序号 week number(当周是第几周)
for d in datelist:
isoyear, weekno= d.isocalendar()[0:2]
dmark= isoyear*100 + weekno
if dmark not in wdindex:
wdindex[dmark]= datelist.index(d)
wdindex= sorted(wdindex.values())
xMinorLocator= FixedLocator(numpy.array(wdindex))
# 确定 X 轴的 MajorFormatter 和 MinorFormatter
def x_major_formatter(idx, pos=None):
return datelist[idx].strftime('%Y-%m-%d')
def x_minor_formatter(idx, pos=None):
return datelist[idx].strftime('%m-%d')
xMajorFormatter= FuncFormatter(x_major_formatter)
xMinorFormatter= FuncFormatter(x_minor_formatter)
return {'xMajorLocator': xMajorLocator,
'xMinorLocator': xMinorLocator,
'xMajorFormatter': xMajorFormatter,
'xMinorFormatter': xMinorFormatter,
'mdindex': mdindex,
'wdindex': wdindex
}
def _compute_xparams_fullspan(self):
'''
主要坐标点是每季第一个交易日,辅助坐标点是每月第一个交易日。是给宏观子图用的。
'''
quotes= self._pdata[u'行情']
datelist= [ datetime.date(int(ys), int(ms), int(ds)) for ys, ms, ds in [ dstr.split('-') for dstr in quotes[u'日期'] ] ]
# 确定 X 轴的 MinorLocator
mdindex= [] # 每个月第一个交易日在所有日期列表中的 index
sdindex= [] # 每季度第一个交易日在所有日期列表中的 index
ydindex= [] # 每年第一个交易日在所有日期列表中的 index
allyears= set([d.year for d in datelist]) # 所有的交易年份
for yr in sorted(allyears):
allmonths= set([d.month for d in datelist if d.year == yr]) # 当年所有的交易月份
for mon in sorted(allmonths):
monthday= min([dt for dt in datelist if dt.year==yr and dt.month==mon]) # 当月的第一个交易日
idx= datelist.index(monthday)
if mon in (1, 4, 7, 10):
sdindex.append(idx)
if mon == 1:
ydindex.append(idx)
else:
mdindex.append(idx)
xMajorLocator= FixedLocator(numpy.array(sdindex))
xMinorLocator= FixedLocator(numpy.array(mdindex))
# 确定 X 轴的 MajorFormatter 和 MinorFormatter
def x_major_formatter(idx, pos=None):
return datelist[idx].strftime('%Y-%m-%d')
def x_minor_formatter(idx, pos=None):
return datelist[idx].strftime('%m-%d')
xMajorFormatter= FuncFormatter(x_major_formatter)
xMinorFormatter= FuncFormatter(x_minor_formatter)
return {'xMajorLocator': xMajorLocator,
'xMinorLocator': xMinorLocator,
'xMajorFormatter': xMajorFormatter,
'xMinorFormatter': xMinorFormatter,
'sdindex': sdindex,
'mdindex': mdindex,
'ydindex': ydindex
}
def plot(self):
'''
'''
# self.plot_title()
# 调用子图对象的绘图函数
if 'basic' in self._subplots:
self._subplots['basic'].plot()
if 'price' in self._subplots:
self._subplots['price'].plot()
if 'torate' in self._subplots:
self._subplots['torate'].plot()
if 'pricefs' in self._subplots:
self._subplots['pricefs'].plot()
if 'toratefs' in self._subplots:
self._subplots['toratefs'].plot()
def plot_title(self):
'''
绘制整个 Figure 的标题
'''
info= self._pdata[u'公司信息']
figobj= self._Fig
# 整个 figure 的标题
subtitle= (info[u'代码'] + ' ' if u'代码' in info else '') + info[u'简称']
subtitle_2= (info[u'代码二'] + ' ' if u'代码二' in info else '') + info[u'简称二']
figobj.suptitle(subtitle + ' / ' + subtitle_2, fontsize=12, fontproperties=__font_properties__)
def savefig(self, figpath):
'''
保存图片
'''
self._Fig.savefig(figpath, dpi=self._figdpi, facecolor=self._figfacecolor, edgecolor=self._figedgecolor, linewidth=self._figlinewidth)
if __name__ == '__main__':
# pfile 指明存放绘图数据的 pickle file,figpath 指定图片需存放的路径
pfile= sys.argv[1]
figpath= sys.argv[2]
# 绘图数据 pdata
fileobj= open(name=pfile, mode='rb')
pdata= pickle.load(fileobj)
fileobj.close()
os.remove(pfile)
myfig= MyFigure(pdata=pdata)
myfig.plot()
myfig.savefig(figpath=figpath)
Python + 股票: 个股资讯表

---- 以上是 Vim 在全屏模式下的截图。全屏模式下 Vim 没有了程序标签栏,并且覆盖了 OS 的系统任务栏。用来切换全屏模式的按键定义:
nnoremap <S-F10> :silent !wmctrl -r :ACTIVE: -b toggle,fullscreen<CR>
需要外部命令 wmctrl 可用。感谢 闲耘,是从他的 vimrc 里抄来的。
---- 基本搞定了个股资讯表。内容包括新闻动态、重大事项、公司公告。
---- 表的结构:<代码> <日期> <时间> <类型> <来源> <序号> <内容> <属性>。下面一条查询语句:
SELECT t1.代码, t1.日期, t1.时间, t1.类型, t1.来源, t1.序号, t1.内容, t1.属性 FROM 个股资讯 AS t1
JOIN (
	SELECT 代码, 类型, MAX(日期) AS 最大日期 FROM 个股资讯 GROUP BY 类型, 代码
) AS t2
ON t1.代码=t2.代码 AND t1.类型=t2.类型 AND t1.日期=t2.最大日期;
耗时 20 多秒,读出 12000 多条记录。不知道是否设计有问题,怎么会这么慢。眼下没时间深究,先这样吧。
---- Plotting 模块改用多进程也基本搞定,结果比预想的还要好。我的电脑是双核的,所以在主进程之外又建立两个工作进程来执行绘图任务。粗略统计,与单进程相比的速度提升在 120% ~ 130% 之间,现在绘制一幅图形大概只需要 3 到 4 秒。
---- 但是遇到一个神秘 bug,好久才搞定。好像必须给进程对象的建立留有足够的时间,否则进程跑起来会出问题。目前在程序里加了一个延时语句 sleep(0.3),看上去是好了。因为程序结构比较复杂,没心思去重现它了,能用就行,也先这样吧。
---- 接下来要把图形再优化一下,新的内容加进去。差不多了以后开始建日线统计表。
让 Python 在下载的时候使用 IPv4 域名解析
---- 这个话题由来于我想从深交所的网站扒些信息下来,发现用 Python 下载时,每次都要 30 秒才能连上,浏览器访问却正常。于是查找原因,最后用抓包分析,发现问题出在域名解析阶段。浏览器访问时,向 DNS 服务器发送的是 A 型查询,要求做 IPv4 地址解析; 而 Python 的 urllib.request 模块发送的却是 AAAA 型查询,要求做 IPv6 地址解析,对深交所网址进行 IPv6 解析居然要花 30 秒,不知道为什么。
---- 然后就是各种 Google + 查看代码,追根溯源。不细说了,只贴结果:
def Resolver_IPv4(hostname):
	return socket.gethostbyname(hostname)    # 此函数返回 IPv4 地址

class HTTPConnection_IPv4(http.client.HTTPConnection):
	def connect(self):
		self.sock= socket.create_connection((Resolver_IPv4(self.host), self.port), self.timeout)

class HTTPHandler_IPv4(urllib.request.HTTPHandler):
	def http_open(self, req):
		return self.do_open(HTTPConnection_IPv4, req)

urlopen_IPv4= urllib.request.build_opener(HTTPHandler_IPv4).open
如此以后,用这个 urlopen_IPv4() 函数来取代平常用的 urllib.request.urlopen() 函数,就可以用 IPv4 地址解析的方式来下载:
webfile= urlopen_IPv4(fullurl='http://www.szse.cn/', timeout=3)
---- 最后说一下,抓包感觉就跟作弊一样,爽!