Jacky Liu's Blog
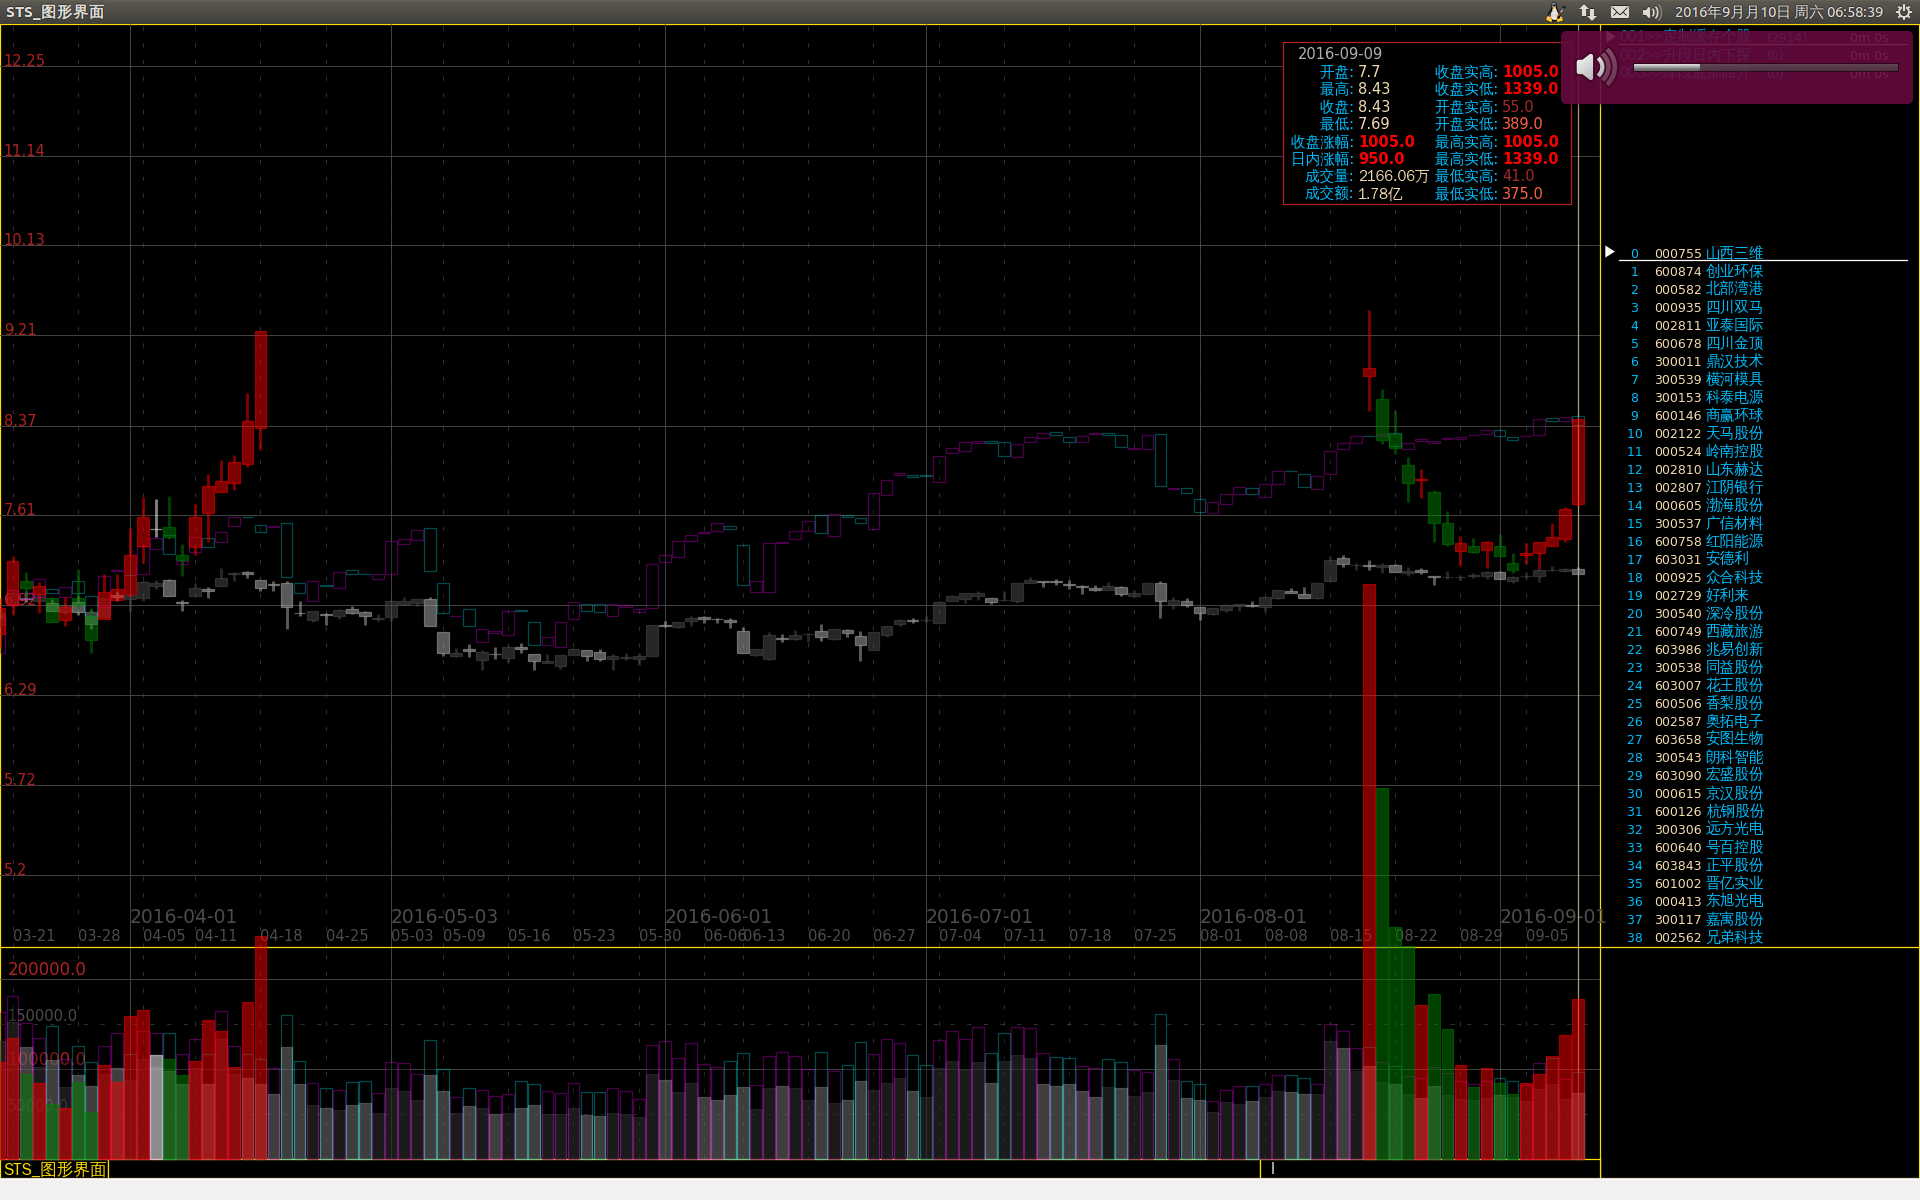
STS 图形界面
---- 动态图形操作界面,不是静态图片,仍然是基于 matplotlib 的。图形界面是对 Vim 文字界面的补充。一个程序两个界面,这样功能就更齐全了。
---- matplotlib 作为一个 Python 组件,跟 Vim 是一个整体,共享全部内存数据。如果用 PyQT,虽然绘图速度快,可是必须另起一个进程,靠 IPC 传数据。全市场的数据不仅量大而且结构复杂,必须放在一起,靠 IPC 不可行。
---- 如果既想要速度又想一体化,只能用 C++ 和 Qt 去直接扩展 Vim 了,这个我是不会去碰的。我是交易者,不是程序员。
---- 技术上已经没有什么太想写的东西了。前一阵子看了些量化和机器学习方面的材料,初步的印象是,它们对市场数据抽象得有点厉害。就像均线对价格求平均值掩盖掉了一些有用的细节一样,市场数据一旦被采样规整化,一些重要的 feature 也丢失了。不过这方面的思路和方法很重要,以后要继续深入。
---- 现在手上有一些看上去还不错的模式/策略,但还没有完全量化,需要人的介入。以后要摸索出最能够贴近原意而又简洁的量化 feature,目前已经部分成功,自己感觉有些 feature 真的定义得特别好。继续努力 ~
初次接触 PyQT, 鸣谢 散漫 童鞋
---- 这是 散漫 童鞋昨天发给我的 PyQT4 演示脚本画出来的图片。他只发了绘图脚本却没发数据文件给我,所以我生造了一个数据文件。因为错拿日线数据当成日内数据作为输入,所以图里的内容看起来很无稽,但只要能把图画出来就可以了:
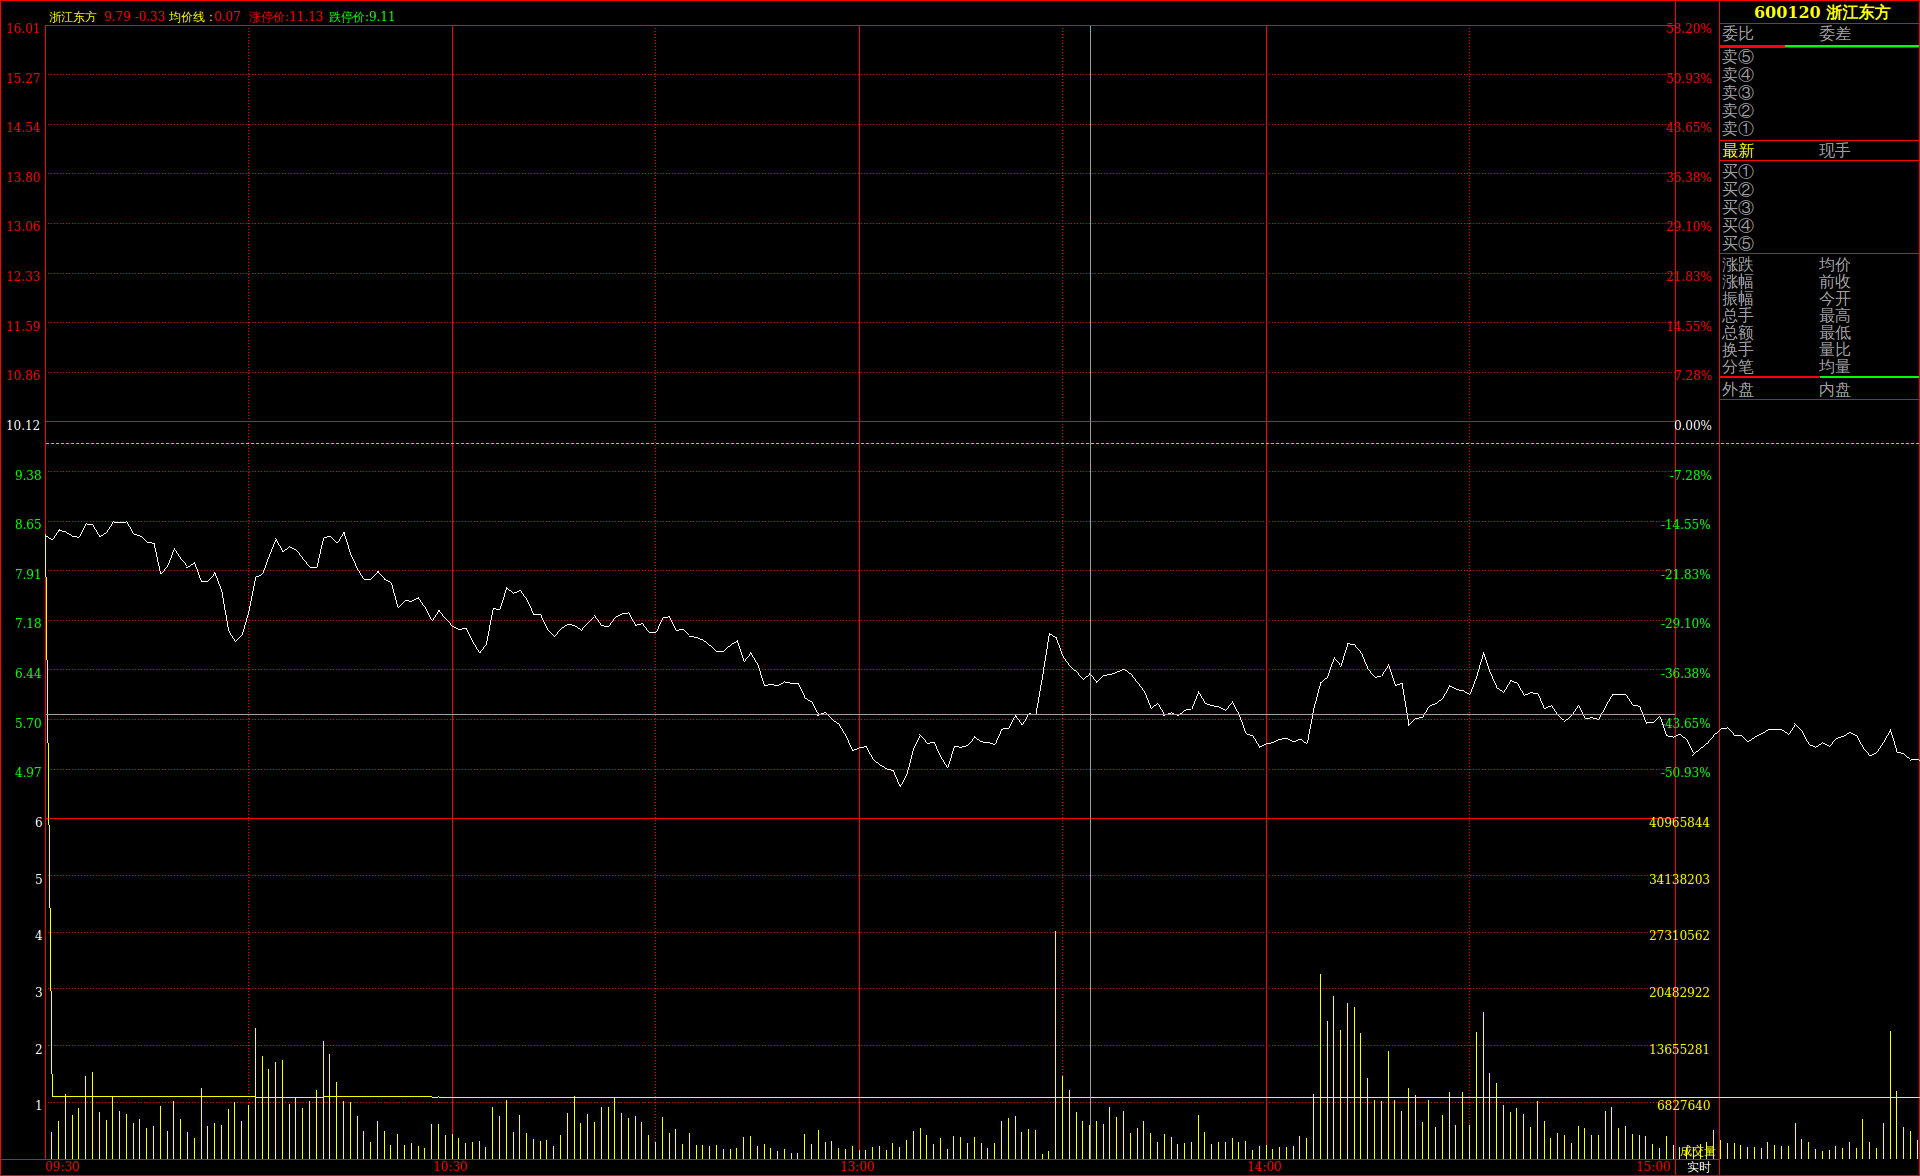
---- 发给我的脚本是跑在 windows 上面的,我在 ubuntu 下面改了一个 py2 版和一个 py3 版:
py2 版:
# -*- coding: utf-8 -*-


#!/usr/bin/python

import sys
import random
from PyQt4 import QtGui, QtCore,Qt

class report_painter:
    '''绘制行情类'''
    def __init__(self,parent):

        #初始化
        self.parent = parent
        self.paint = QtGui.QPainter()
        self.paint.begin(self.parent)

        #设置抗锯齿
        #self.paint.setRenderHint(QtGui.QPainter.Antialiasing)
        #度量尺对象
        self.metrics = self.paint.fontMetrics()

        #设置字体库
        self.fonts = dict()
        self.fonts['default'] = QtGui.QFont('Serif', 9, QtGui.QFont.Light)
        self.fonts['yahei_14_bold']= QtGui.QFont('Serif',12,QtGui.QFont.Bold)
        self.fonts['yahei_14']= QtGui.QFont('Serif',12,QtGui.QFont.Light)
        self.setFont('default')

        #设置笔刷样式库
        self.pens = dict()

        #红色 1px粗  1px点 2px距 线条
        self.pens['red_1px_dashline'] =  QtGui.QPen( QtCore.Qt.red, 1, QtCore.Qt.DashLine)
        self.pens['red_1px_dashline'].setDashPattern([1,2])

        #红色 1px粗 实线条
        self.pens['red'] = QtGui.QPen( QtCore.Qt.red, 1, QtCore.Qt.SolidLine)
        #红色 3px粗 实线条
        self.pens['red_2px'] = QtGui.QPen( QtCore.Qt.red, 2, QtCore.Qt.SolidLine)
        #红色 2px粗 实线条
        self.pens['red_3px'] = QtGui.QPen( QtCore.Qt.red, 3, QtCore.Qt.SolidLine)
        #黄色 1px粗 实线条
        self.pens['yellow'] = QtGui.QPen( QtCore.Qt.yellow, 1, QtCore.Qt.SolidLine)
        #白色 1px粗 实线条
        self.pens['white']  = QtGui.QPen( QtCore.Qt.white , 1, QtCore.Qt.SolidLine)
        #灰色 1px粗 实线条
        self.pens['gray']   = QtGui.QPen( QtCore.Qt.gray, 1, QtCore.Qt.SolidLine)
        #绿色 1px粗 实线条
        self.pens['green']   = QtGui.QPen( QtCore.Qt.green, 1, QtCore.Qt.SolidLine)
        #绿色 3px粗 实线条
        self.pens['green_2px']   = QtGui.QPen( QtCore.Qt.green, 2, QtCore.Qt.SolidLine)
        #亮蓝 1px粗  1px点 2px距 线条
        self.pens['cyan_1px_dashline'] =  QtGui.QPen( QtCore.Qt.cyan, 1, QtCore.Qt.DashLine)
        self.pens['cyan_1px_dashline'].setDashPattern([3,2])
        #获得窗口的长和宽
        size      = self.parent.size()
        self.w    = size.width()
        self.h    = size.height()

        #设置grid的上下左右补丁边距
        self.grid_padding_left   = 45  #左侧补丁边距
        self.grid_padding_right  = 245 #右侧补丁边距
        self.grid_padding_top    = 25  #顶部补丁边距
        self.grid_padding_bottom = 17  #底部补丁边距

        #开始绘制
        self.start_paint()


        self.paint.end()   #结束
    '''绘制流程步骤'''
    def start_paint(self):
        self.PriceGridPaint()
        self.rightGridPaint()
        self.timelinePaint()
        self.topInfoPaint()
        self.rulerPaint()
        self.VolumeGridPaint()
        self.volumePaint()
        self.pricePaint()
        self.xyPaint()
    '''设置使用的字体'''
    def setFont(self,code='default'):
        self.paint.setFont(self.fonts[code])

    '''设置使用的笔刷'''
    def setPen(self,code='default'):
        self.paint.setPen(self.pens[code])

    '''绘制股价走势表格'''
    def PriceGridPaint(self):
        self.setPen('red')
        self.paint.setBrush(QtCore.Qt.NoBrush)

        sum_width  = self.grid_padding_left+self.grid_padding_right
        sum_height = self.grid_padding_top+self.grid_padding_bottom

        grid_height = self.h-sum_height

        #画边框
        self.paint.drawRect(self.grid_padding_left,self.grid_padding_top,
                            self.w-sum_width,self.h-sum_height)
        #成交量和走势的分界线
        self.paint.drawLine(self.grid_padding_left,grid_height*0.7+self.grid_padding_top,
                            self.w-self.grid_padding_right,grid_height*0.7+self.grid_padding_top)

        #股票昨收中间线
        self.paint.drawLine(self.grid_padding_left+1,
                            grid_height*0.35+self.grid_padding_top,
                            self.w-self.grid_padding_right
                            ,grid_height*0.35+self.grid_padding_top)

        #其他线条
        self.paint.drawLine(0,self.h-self.grid_padding_bottom,self.w-self.grid_padding_right+44,self.h-self.grid_padding_bottom)
        self.paint.drawLine(0,self.h-self.grid_padding_bottom+16,self.w,self.h-self.grid_padding_bottom+16)

        self.paint.drawLine(self.w-self.grid_padding_right,0,
                            self.w-self.grid_padding_right,self.h-self.grid_padding_bottom+16)
        self.paint.drawLine(self.w-self.grid_padding_right+44,0,
                            self.w-self.grid_padding_right+44,self.h-self.grid_padding_bottom+16)
        self.setPen('yellow')
        self.paint.drawText(self.w-self.grid_padding_right+5,self.h-self.grid_padding_bottom-4,QtCore.QString(u'成交量'))
        self.setPen('white')
        #右下角文字
        self.paint.drawText(self.w-self.grid_padding_right+12,self.h-self.grid_padding_bottom+12,QtCore.QString(u'实时'))
    '''绘制成交量走势表格'''
    def VolumeGridPaint(self):
        sum_width  = self.grid_padding_left + self.grid_padding_right
        sum_height = self.grid_padding_top  + self.grid_padding_bottom

        grid_height = self.h-sum_height
        max_volume = self.parent.stk_data['max_vol']

        px_h_radio = max_volume/(grid_height*0.3)

        self.setPen('red_1px_dashline')


        grid_num = 6
        x = grid_num
        cnt = grid_height*0.3/grid_num
        for i in range(0,grid_num):
            self.setPen('red_1px_dashline')
            #计算坐标
            y1 = self.grid_padding_top+(grid_height*0.7)+i*cnt
            x1 = self.grid_padding_left
            x2 = self.grid_padding_left+self.w-sum_width

            self.paint.drawLine(x1,y1,x2,y1) #画价位虚线

            vol_int = int(cnt*x*px_h_radio)
            vol_str = str(vol_int)
            fw = self.metrics.width(vol_str) #获得文字宽度
            fh = self.metrics.height()/2   #获得文字高度
            self.setPen('yellow')
            self.paint.drawText(x2+40-fw,y1+fh,vol_str) #写入文字
            self.setPen('white')
            self.paint.drawText(x1-2-self.metrics.width(str(x)),y1+fh,str(x))    #写入文字
            x-=1


    '''绘制左侧信息栏和盘口等内容'''
    def rightGridPaint(self):
        self.setPen('red')
        #绘制信息内容之间的分割线
        _h = 0
        _x = self.w-self.grid_padding_right+44
        self.paint.drawLine(self.w-1,0,self.w-1,self.h-self.grid_padding_bottom+16)
        self.paint.drawLine(0,0,0,self.h-self.grid_padding_bottom+16)
        self.paint.drawLine(0,_h,self.w,_h)
        _h+=23
        self.paint.drawLine(_x,_h,self.w,_h)
        _h+=24
        self.paint.drawLine(_x,_h,self.w,_h)

        _h+=93
        self.paint.drawLine(_x,_h,self.w,_h)
        _h+=20
        self.paint.drawLine(_x,_h,self.w,_h)
        _h+=93
        self.paint.drawLine(_x,_h,self.w,_h)
        _h+=123
        self.paint.drawLine(_x,_h,self.w,_h)
        _h+=23
        self.paint.drawLine(_x,_h,self.w,_h)
        #股票名称和代码
        self.setFont('yahei_14_bold')
        self.setPen('yellow')
        name_str = QtCore.QString(u'%s %s'%(self.parent.stk_info['code'],self.parent.stk_info['name']))
        self.paint.drawText(_x+35,18,name_str)
        #委比和委差
        self.setFont('yahei_14')
        zx_str = QtCore.QString(u'最新')
        self.paint.drawText(_x+3  ,156,zx_str)
        self.setPen('gray')
        wb_str = QtCore.QString(u'委比')
        wc_str = QtCore.QString(u'委差')
        xs_str = QtCore.QString(u'现手')
        self.paint.drawText(_x+3  ,39,wb_str)
        self.paint.drawText(_x+100,39,wc_str)
        self.paint.drawText(_x+100,156,xs_str)
        fh = self.metrics.height()

        left_field_list = [u'涨跌',u'涨幅',u'振幅',u'总手',u'总额',u'换手',u'分笔']
        i = 1
        for field in left_field_list:
            field_str = QtCore.QString(field)
            self.paint.drawText(_x+3,253+(i*17),field_str)
            i+=1

        right_field_list = [u'均价',u'前收',u'今开',u'最高',u'最低',u'量比',u'均量']

        i = 1
        for field in right_field_list:
            field_str = QtCore.QString(field)
            self.paint.drawText(_x+100,253+(i*17),field_str)
            i+=1

        wp_str = QtCore.QString(u'外盘')
        np_str = QtCore.QString(u'内盘')
        self.paint.drawText(_x+3,395,wp_str)
        self.paint.drawText(_x+100,395,np_str)
        #卖①②③④⑤

        i = 0
        sell_queue = [u'卖⑤',u'卖④',u'卖③',u'卖②',u'卖①']
        for sell in sell_queue:
            sell_str = QtCore.QString(sell)
            self.paint.drawText(_x+3,62+(i*18),sell_str)
            i+=1
        #买①②③④⑤
        buy_queue = [u'买①',u'买②',u'买③',u'买④',u'买⑤']
        for buy in buy_queue:
            buy_str = QtCore.QString(buy)
            self.paint.drawText(_x+3,87+(i*18),buy_str)
            i+=1

        self.setPen('red_2px')
        self.paint.drawLine(_x+1,377,_x+99,377)
        self.paint.drawLine(_x+1,46,_x+65,46)
        self.setPen('green_2px')
        self.paint.drawLine(_x+102,377,_x+199,377)
        self.paint.drawLine(_x+67,46,_x+199,46)
        self.setFont('default')

    '''绘制左右侧的价格刻度'''
    def rulerPaint(self):

        sum_width  = self.grid_padding_left+self.grid_padding_right
        sum_height = self.grid_padding_top+self.grid_padding_bottom

        grid_height = self.h-sum_height

        high = self.parent.stk_data['high']
        low  = self.parent.stk_data['low']
        lastclose = self.parent.stk_data['lastclose']

        top = high-lastclose
        bottom = lastclose-low
        if top>bottom:
            padding = top
        else:
            padding = bottom

        limit_top = lastclose+padding
        limit_low = lastclose-padding


        px_h_radio = (grid_height*0.7)/((limit_top-limit_low)*100)


        self.setPen('red_1px_dashline')

        grid_num = 16
        cnt = grid_height*0.7/grid_num

        for i in range(0,grid_num):
            self.setPen('red_1px_dashline')
            #计算坐标
            y1 = self.grid_padding_top+i*cnt
            x1 = self.grid_padding_left
            x2 = self.grid_padding_left+self.w-sum_width

            self.paint.drawLine(x1,y1,x2,y1) #画价位虚线

            price_float = (limit_top - ((i*cnt)/px_h_radio/100)) #计算价格
            price = '%4.2f'%(price_float) #格式化价格成str

            fw = self.metrics.width(price) #获得文字宽度
            fh = self.metrics.height()/2   #获得文字高度

            radio_float = (price_float/lastclose-1)*100 #计算波动百分比
            radio_str   = "%2.2f%%"%(radio_float)      #格式化百分比成str

            r_fw = self.metrics.width(radio_str)
            r_fh = self.metrics.height()/2
            #判断文字使用的颜色
            if price_float == lastclose:
                self.setPen('white')
            if price_float < lastclose:
                self.setPen('green')

            self.paint.drawText(x1-fw-2,y1+fh,price) #写入文字
            self.paint.drawText(x2+40-r_fw,y1+r_fh,radio_str) #写入文字
    '''绘制x,y准星'''
    def xyPaint(self):
        if self.parent.m_x >= self.grid_padding_left and self.parent.m_x<=self.w-self.grid_padding_right and self.parent.m_y>=self.grid_padding_top and self.parent.m_y<=self.h-self.grid_padding_bottom:
            self.setPen('gray')
            x1 = self.grid_padding_left
            x2 = self.w-self.grid_padding_right
            y1 = self.grid_padding_top
            y2 = self.h-self.grid_padding_bottom
            self.paint.drawLine(x1+1,self.parent.m_y,x2-1,self.parent.m_y)
            self.paint.drawLine(self.parent.m_x,y1+1,self.parent.m_x,y2-1)


    '''绘制时间轴刻度'''
    def timelinePaint(self):

        fw = self.metrics.width(u'00:00') #计算文字的宽度

        sum_width  = self.grid_padding_left+self.grid_padding_right
        sum_height = self.grid_padding_top+self.grid_padding_bottom

        grid_width = self.w-sum_width-2


        y1 = self.grid_padding_top
        y2 = y1+(self.h-sum_height)

        #时间轴中线
        self.setPen('red')
        x_pos = grid_width/2+self.grid_padding_left

        self.paint.drawLine(x_pos,y1,x_pos,y2)
        self.paint.drawText(x_pos-fw/2,y2+12,QtCore.QString(u'13:00'))

        #时间轴09点30分
        x_pos = self.grid_padding_left
        self.paint.drawText(x_pos,y2+12,QtCore.QString(u'09:30'))

        #时间轴10点30分
        x_pos = grid_width*0.25+self.grid_padding_left
        self.paint.drawLine(x_pos,y1,x_pos,y2)
        self.paint.drawText(x_pos-fw/2,y2+12,QtCore.QString(u'10:30'))

        #时间轴14点00分
        x_pos = grid_width*0.75+self.grid_padding_left
        self.paint.drawLine(x_pos,y1,x_pos,y2)
        self.paint.drawText(x_pos-fw/2,y2+12,QtCore.QString(u'14:00'))

        #时间轴15点00分
        x_pos = grid_width+self.grid_padding_left
        self.paint.drawText(x_pos-fw,y2+12,QtCore.QString(u'15:00'))

        #时间虚线 by 30min
        self.setPen('red_1px_dashline')
        x_pos_array = [0.125,0.375,0.625,0.875]
        for i in x_pos_array:
            x_pos = grid_width*i+self.grid_padding_left
            self.paint.drawLine(x_pos,y1,x_pos,y2)


    '''绘制表格上方的股票信息'''
    def topInfoPaint(self):
        self.setPen('yellow')
        self.paint.drawText(4+self.grid_padding_left,self.grid_padding_top-4
                            ,QtCore.QString(self.parent.stk_info['name'])) #股票名称
        self.paint.drawText(4+self.grid_padding_left+120,self.grid_padding_top-4
                            ,QtCore.QString(u'均价线:')) #均价线
        lastclose = self.parent.stk_data['lastclose']
        close     = self.parent.stk_data['close']
        mma       = self.parent.stk_data['list']['mma'][-1]

        if lastclose>close:
            self.setPen('green')
            str_1 = '%.2f -%.2f'%(close,lastclose-close)
        if lastclose==close:
            self.setPen('white')
            str_1 = '%.2f +%.2f'%(close,0.00)
        if lastclose<close:
            self.setPen('red')
            str_1 = '%.2f +%.2f'%(close,close-lastclose)

        if mma>close:
            self.setPen('green')
        if mma==close:
            self.setPen('white')
        if mma<close:
            self.setPen('red')

        self.paint.drawText(4+self.grid_padding_left+55,self.grid_padding_top-4,QtCore.QString(str_1))
        self.paint.drawText(4+self.grid_padding_left+165,self.grid_padding_top-4,QtCore.QString('%.2f'%mma)) #均价

        #涨停价
        self.setPen('red')
        self.paint.drawText(4+self.grid_padding_left+200,self.grid_padding_top-4,QtCore.QString(u'涨停价:%.2f'%(lastclose*1.1))) #均价
        #跌停价
        self.setPen('green')
        self.paint.drawText(4+self.grid_padding_left+280,self.grid_padding_top-4,QtCore.QString(u'跌停价:%.2f'%(lastclose*0.9))) #均价
    '''绘制股价走势'''
    def pricePaint(self):
        sum_width  = self.grid_padding_left+self.grid_padding_right
        sum_height = self.grid_padding_top+self.grid_padding_bottom

        grid_height = self.h-sum_height-2

        high = self.parent.stk_data['high']
        low  = self.parent.stk_data['low']
        lastclose = self.parent.stk_data['lastclose']

        top = high-lastclose
        bottom = lastclose-low
        if top>bottom:
            padding = top
        else:
            padding = bottom

        limit_top = lastclose+padding
        limit_low = lastclose-padding

        h_radio = (grid_height*0.7)/((limit_top-limit_low)*100)

        w_radio = (self.w-sum_width-2)/240.00
        w = self.grid_padding_left

        self.setPen('white')
        path = QtGui.QPainterPath()
        path.moveTo(w,(limit_top-self.parent.stk_data['open'])*100*h_radio+self.grid_padding_top)
        i  = 1
        for price in self.parent.stk_data['list']['close']:
            w = i*w_radio+self.grid_padding_left
            y = (limit_top-price)*100*h_radio+self.grid_padding_top
            path.lineTo(w,y)
            i+=1
        self.paint.drawPath(path)
        self.setPen('cyan_1px_dashline')
        self.paint.drawLine(self.grid_padding_left+1,y,w-1,y)
        self.setPen('yellow')
        path = QtGui.QPainterPath()
        w = self.grid_padding_left
        path.moveTo(w,(limit_top-self.parent.stk_data['open'])*100*h_radio+self.grid_padding_top)
        i  = 1
        for price in self.parent.stk_data['list']['mma']:
            w = i*w_radio+self.grid_padding_left
            y = (limit_top-price)*100*h_radio+self.grid_padding_top
            path.lineTo(w,y)
            i+=1
        self.paint.drawPath(path)


    '''绘制成交量'''
    def volumePaint(self):
        sum_width  = self.grid_padding_left + self.grid_padding_right
        sum_height = self.grid_padding_top  + self.grid_padding_bottom

        max_volume = self.parent.stk_data['max_vol'] #最大分钟成交量

        w_radio = (self.w-sum_width-2)/240.00
        h_radio = ((self.h-sum_height-2)*0.3)/max_volume

        y = (self.h-sum_height)+self.grid_padding_top

        self.setPen('yellow')


        for i in range(1,len(self.parent.stk_data['list']['vol'])+1):
            x = i*w_radio+self.grid_padding_left
            y2 = h_radio*self.parent.stk_data['list']['vol'][i-1]
            self.paint.drawLine(x,y-1,x,y-y2)

class Test(QtGui.QWidget):
    def __init__(self, parent=None):
        QtGui.QWidget.__init__(self, parent)
        self.setMinimumSize(640, 430) #设置窗口最小尺寸
        self.setGeometry(300, 300, 960, 650)
        self.setWindowTitle(QtCore.QString(u'超级狙击手[内部开发测试版]-行情实时走势'))
        self.setStyleSheet("QWidget { background-color: black }")
        self.setWindowIcon(QtGui.QIcon('ruby.png'))
        self.setMouseTracking(True)
        self.m_x = 0 #光标x轴位置
        self.m_y = 0 #光标y轴位置

        self.stk_info = {}

        self.stk_info['name'] = u'浙江东方'
        self.stk_info['code'] = u'600120'
        self.stk_info['market'] = 'SH'

        self.stk_data = {}
        self.stk_data['list'] = {} #股价序列
        self.stk_data['list']['time']  = [] #时间
        self.stk_data['list']['open']  = [] #开盘价
        self.stk_data['list']['high']  = [] #最高价
        self.stk_data['list']['low']   = [] #最低价
        self.stk_data['list']['close'] = [] #收盘价
        self.stk_data['list']['vol']   = [] #成交量
        self.stk_data['list']['amount']= [] #成交额
        self.stk_data['list']['mma']= []   #分时均价

        self.stk_data['list']['buy_port'] = [(0.00,0),(0.00,0),(0.00,0),(0.00,0),(0.00,0)]  #买盘前五
        self.stk_data['list']['sell_port'] = [(0.00,0),(0.00,0),(0.00,0),(0.00,0),(0.00,0)] #卖盘前五

        #读取数据
        f = open('SH600120.txt','r')
        data = f.readlines()
        f.close()

        for row in data:
            vars = row.split(' ')
            self.stk_data['list']['time'].append(vars[1])
            self.stk_data['list']['open'].append(float(vars[2]))
            self.stk_data['list']['high'].append(float(vars[3]))
            self.stk_data['list']['low'].append(float(vars[4]))
            self.stk_data['list']['close'].append(float(vars[5]))
            self.stk_data['list']['vol'].append(int(float(vars[6])))
            self.stk_data['list']['amount'].append(int(float(vars[7])))

            sum_vol = sum(self.stk_data['list']['vol'])
            sum_amt = sum(self.stk_data['list']['amount'])

            self.stk_data['list']['mma'].append(float(sum_amt)/(sum_vol*100.00))

        self.stk_data['lastclose'] = 10.12 #上一个交易日收盘价
        self.stk_data['open'] = self.stk_data['list']['open'][0]       #开盘价
        self.stk_data['high'] = max(self.stk_data['list']['high'])     #最高价
        self.stk_data['low']  = min(self.stk_data['list']['low'])      #最低价
        self.stk_data['close']= self.stk_data['list']['close'][-1]     #收盘价
        self.stk_data['max_vol']  = max(self.stk_data['list']['vol'])  #当日最高成交量


    def mouseMoveEvent(self, event):
        self.m_x =  int(event.x())
        self.m_y =  int(event.y())
        self.repaint()
    def paintEvent(self, event):
        report_painter(self)

app = QtGui.QApplication(sys.argv)
dt = Test()
dt.show()
app.exec_()
py3 版:
# -*- coding: utf-8 -*-


#!/usr/bin/python

import sys
import random
from PyQt4 import QtGui, QtCore,Qt

class report_painter:
    '''绘制行情类'''
    def __init__(self,parent):

        #初始化
        self.parent = parent
        self.paint = QtGui.QPainter()
        self.paint.begin(self.parent)

        #设置抗锯齿
        #self.paint.setRenderHint(QtGui.QPainter.Antialiasing)
        #度量尺对象
        self.metrics = self.paint.fontMetrics()

        #设置字体库
        self.fonts = dict()
        self.fonts['default'] = QtGui.QFont('Serif', 9, QtGui.QFont.Light)
        self.fonts['yahei_14_bold']= QtGui.QFont('Serif',12,QtGui.QFont.Bold)
        self.fonts['yahei_14']= QtGui.QFont('Serif',12,QtGui.QFont.Light)
        self.setFont('default')

        #设置笔刷样式库
        self.pens = dict()

        #红色 1px粗  1px点 2px距 线条
        self.pens['red_1px_dashline'] =  QtGui.QPen( QtCore.Qt.red, 1, QtCore.Qt.DashLine)
        self.pens['red_1px_dashline'].setDashPattern([1,2])

        #红色 1px粗 实线条
        self.pens['red'] = QtGui.QPen( QtCore.Qt.red, 1, QtCore.Qt.SolidLine)
        #红色 3px粗 实线条
        self.pens['red_2px'] = QtGui.QPen( QtCore.Qt.red, 2, QtCore.Qt.SolidLine)
        #红色 2px粗 实线条
        self.pens['red_3px'] = QtGui.QPen( QtCore.Qt.red, 3, QtCore.Qt.SolidLine)
        #黄色 1px粗 实线条
        self.pens['yellow'] = QtGui.QPen( QtCore.Qt.yellow, 1, QtCore.Qt.SolidLine)
        #白色 1px粗 实线条
        self.pens['white']  = QtGui.QPen( QtCore.Qt.white , 1, QtCore.Qt.SolidLine)
        #灰色 1px粗 实线条
        self.pens['gray']   = QtGui.QPen( QtCore.Qt.gray, 1, QtCore.Qt.SolidLine)
        #绿色 1px粗 实线条
        self.pens['green']   = QtGui.QPen( QtCore.Qt.green, 1, QtCore.Qt.SolidLine)
        #绿色 3px粗 实线条
        self.pens['green_2px']   = QtGui.QPen( QtCore.Qt.green, 2, QtCore.Qt.SolidLine)
        #亮蓝 1px粗  1px点 2px距 线条
        self.pens['cyan_1px_dashline'] =  QtGui.QPen( QtCore.Qt.cyan, 1, QtCore.Qt.DashLine)
        self.pens['cyan_1px_dashline'].setDashPattern([3,2])
        #获得窗口的长和宽
        size      = self.parent.size()
        self.w    = size.width()
        self.h    = size.height()

        #设置grid的上下左右补丁边距
        self.grid_padding_left   = 45  #左侧补丁边距
        self.grid_padding_right  = 245 #右侧补丁边距
        self.grid_padding_top    = 25  #顶部补丁边距
        self.grid_padding_bottom = 17  #底部补丁边距

        #开始绘制
        self.start_paint()


        self.paint.end()   #结束
    '''绘制流程步骤'''
    def start_paint(self):
        self.PriceGridPaint()
        self.rightGridPaint()
        self.timelinePaint()
        self.topInfoPaint()
        self.rulerPaint()
        self.VolumeGridPaint()
        self.volumePaint()
        self.pricePaint()
        self.xyPaint()
    '''设置使用的字体'''
    def setFont(self,code='default'):
        self.paint.setFont(self.fonts[code])

    '''设置使用的笔刷'''
    def setPen(self,code='default'):
        self.paint.setPen(self.pens[code])

    '''绘制股价走势表格'''
    def PriceGridPaint(self):
        self.setPen('red')
        self.paint.setBrush(QtCore.Qt.NoBrush)

        sum_width  = self.grid_padding_left+self.grid_padding_right
        sum_height = self.grid_padding_top+self.grid_padding_bottom

        grid_height = self.h-sum_height

        #画边框
        self.paint.drawRect(self.grid_padding_left,self.grid_padding_top,
                            self.w-sum_width,self.h-sum_height)
        #成交量和走势的分界线
        self.paint.drawLine(self.grid_padding_left,grid_height*0.7+self.grid_padding_top,
                            self.w-self.grid_padding_right,grid_height*0.7+self.grid_padding_top)

        #股票昨收中间线
        self.paint.drawLine(self.grid_padding_left+1,
                            grid_height*0.35+self.grid_padding_top,
                            self.w-self.grid_padding_right
                            ,grid_height*0.35+self.grid_padding_top)

        #其他线条
        self.paint.drawLine(0,self.h-self.grid_padding_bottom,self.w-self.grid_padding_right+44,self.h-self.grid_padding_bottom)
        self.paint.drawLine(0,self.h-self.grid_padding_bottom+16,self.w,self.h-self.grid_padding_bottom+16)

        self.paint.drawLine(self.w-self.grid_padding_right,0,
                            self.w-self.grid_padding_right,self.h-self.grid_padding_bottom+16)
        self.paint.drawLine(self.w-self.grid_padding_right+44,0,
                            self.w-self.grid_padding_right+44,self.h-self.grid_padding_bottom+16)
        self.setPen('yellow')
        self.paint.drawText(self.w-self.grid_padding_right+5,self.h-self.grid_padding_bottom-4,str('成交量'))
        self.setPen('white')
        #右下角文字
        self.paint.drawText(self.w-self.grid_padding_right+12,self.h-self.grid_padding_bottom+12,str('实时'))
    '''绘制成交量走势表格'''
    def VolumeGridPaint(self):
        sum_width  = self.grid_padding_left + self.grid_padding_right
        sum_height = self.grid_padding_top  + self.grid_padding_bottom

        grid_height = self.h-sum_height
        max_volume = self.parent.stk_data['max_vol']

        px_h_radio = max_volume/(grid_height*0.3)

        self.setPen('red_1px_dashline')


        grid_num = 6
        x = grid_num
        cnt = grid_height*0.3/grid_num
        for i in range(0,grid_num):
            self.setPen('red_1px_dashline')
            #计算坐标
            y1 = self.grid_padding_top+(grid_height*0.7)+i*cnt
            x1 = self.grid_padding_left
            x2 = self.grid_padding_left+self.w-sum_width

            self.paint.drawLine(x1,y1,x2,y1) #画价位虚线

            vol_int = int(cnt*x*px_h_radio)
            vol_str = str(vol_int)
            fw = self.metrics.width(vol_str) #获得文字宽度
            fh = self.metrics.height()/2   #获得文字高度
            self.setPen('yellow')
            self.paint.drawText(x2+40-fw,y1+fh,vol_str) #写入文字
            self.setPen('white')
            self.paint.drawText(x1-2-self.metrics.width(str(x)),y1+fh,str(x))    #写入文字
            x-=1


    '''绘制左侧信息栏和盘口等内容'''
    def rightGridPaint(self):
        self.setPen('red')
        #绘制信息内容之间的分割线
        _h = 0
        _x = self.w-self.grid_padding_right+44
        self.paint.drawLine(self.w-1,0,self.w-1,self.h-self.grid_padding_bottom+16)
        self.paint.drawLine(0,0,0,self.h-self.grid_padding_bottom+16)
        self.paint.drawLine(0,_h,self.w,_h)
        _h+=23
        self.paint.drawLine(_x,_h,self.w,_h)
        _h+=24
        self.paint.drawLine(_x,_h,self.w,_h)

        _h+=93
        self.paint.drawLine(_x,_h,self.w,_h)
        _h+=20
        self.paint.drawLine(_x,_h,self.w,_h)
        _h+=93
        self.paint.drawLine(_x,_h,self.w,_h)
        _h+=123
        self.paint.drawLine(_x,_h,self.w,_h)
        _h+=23
        self.paint.drawLine(_x,_h,self.w,_h)
        #股票名称和代码
        self.setFont('yahei_14_bold')
        self.setPen('yellow')
        name_str = str('%s %s'%(self.parent.stk_info['code'],self.parent.stk_info['name']))
        self.paint.drawText(_x+35,18,name_str)
        #委比和委差
        self.setFont('yahei_14')
        zx_str = str('最新')
        self.paint.drawText(_x+3  ,156,zx_str)
        self.setPen('gray')
        wb_str = str('委比')
        wc_str = str('委差')
        xs_str = str('现手')
        self.paint.drawText(_x+3  ,39,wb_str)
        self.paint.drawText(_x+100,39,wc_str)
        self.paint.drawText(_x+100,156,xs_str)
        fh = self.metrics.height()

        left_field_list = ['涨跌','涨幅','振幅','总手','总额','换手','分笔']
        i = 1
        for field in left_field_list:
            field_str = str(field)
            self.paint.drawText(_x+3,253+(i*17),field_str)
            i+=1

        right_field_list = ['均价','前收','今开','最高','最低','量比','均量']

        i = 1
        for field in right_field_list:
            field_str = str(field)
            self.paint.drawText(_x+100,253+(i*17),field_str)
            i+=1

        wp_str = str('外盘')
        np_str = str('内盘')
        self.paint.drawText(_x+3,395,wp_str)
        self.paint.drawText(_x+100,395,np_str)
        #卖①②③④⑤

        i = 0
        sell_queue = ['卖⑤','卖④','卖③','卖②','卖①']
        for sell in sell_queue:
            sell_str = str(sell)
            self.paint.drawText(_x+3,62+(i*18),sell_str)
            i+=1
        #买①②③④⑤
        buy_queue = ['买①','买②','买③','买④','买⑤']
        for buy in buy_queue:
            buy_str = str(buy)
            self.paint.drawText(_x+3,87+(i*18),buy_str)
            i+=1

        self.setPen('red_2px')
        self.paint.drawLine(_x+1,377,_x+99,377)
        self.paint.drawLine(_x+1,46,_x+65,46)
        self.setPen('green_2px')
        self.paint.drawLine(_x+102,377,_x+199,377)
        self.paint.drawLine(_x+67,46,_x+199,46)
        self.setFont('default')

    '''绘制左右侧的价格刻度'''
    def rulerPaint(self):

        sum_width  = self.grid_padding_left+self.grid_padding_right
        sum_height = self.grid_padding_top+self.grid_padding_bottom

        grid_height = self.h-sum_height

        high = self.parent.stk_data['high']
        low  = self.parent.stk_data['low']
        lastclose = self.parent.stk_data['lastclose']

        top = high-lastclose
        bottom = lastclose-low
        if top>bottom:
            padding = top
        else:
            padding = bottom

        limit_top = lastclose+padding
        limit_low = lastclose-padding


        px_h_radio = (grid_height*0.7)/((limit_top-limit_low)*100)


        self.setPen('red_1px_dashline')

        grid_num = 16
        cnt = grid_height*0.7/grid_num

        for i in range(0,grid_num):
            self.setPen('red_1px_dashline')
            #计算坐标
            y1 = self.grid_padding_top+i*cnt
            x1 = self.grid_padding_left
            x2 = self.grid_padding_left+self.w-sum_width

            self.paint.drawLine(x1,y1,x2,y1) #画价位虚线

            price_float = (limit_top - ((i*cnt)/px_h_radio/100)) #计算价格
            price = '%4.2f'%(price_float) #格式化价格成str

            fw = self.metrics.width(price) #获得文字宽度
            fh = self.metrics.height()/2   #获得文字高度

            radio_float = (price_float/lastclose-1)*100 #计算波动百分比
            radio_str   = "%2.2f%%"%(radio_float)      #格式化百分比成str

            r_fw = self.metrics.width(radio_str)
            r_fh = self.metrics.height()/2
            #判断文字使用的颜色
            if price_float == lastclose:
                self.setPen('white')
            if price_float < lastclose:
                self.setPen('green')

            self.paint.drawText(x1-fw-2,y1+fh,price) #写入文字
            self.paint.drawText(x2+40-r_fw,y1+r_fh,radio_str) #写入文字
    '''绘制x,y准星'''
    def xyPaint(self):
        if self.parent.m_x >= self.grid_padding_left and self.parent.m_x<=self.w-self.grid_padding_right and self.parent.m_y>=self.grid_padding_top and self.parent.m_y<=self.h-self.grid_padding_bottom:
            self.setPen('gray')
            x1 = self.grid_padding_left
            x2 = self.w-self.grid_padding_right
            y1 = self.grid_padding_top
            y2 = self.h-self.grid_padding_bottom
            self.paint.drawLine(x1+1,self.parent.m_y,x2-1,self.parent.m_y)
            self.paint.drawLine(self.parent.m_x,y1+1,self.parent.m_x,y2-1)


    '''绘制时间轴刻度'''
    def timelinePaint(self):

        fw = self.metrics.width('00:00') #计算文字的宽度

        sum_width  = self.grid_padding_left+self.grid_padding_right
        sum_height = self.grid_padding_top+self.grid_padding_bottom

        grid_width = self.w-sum_width-2


        y1 = self.grid_padding_top
        y2 = y1+(self.h-sum_height)

        #时间轴中线
        self.setPen('red')
        x_pos = grid_width/2+self.grid_padding_left

        self.paint.drawLine(x_pos,y1,x_pos,y2)
        self.paint.drawText(x_pos-fw/2,y2+12,str('13:00'))

        #时间轴09点30分
        x_pos = self.grid_padding_left
        self.paint.drawText(x_pos,y2+12,str('09:30'))

        #时间轴10点30分
        x_pos = grid_width*0.25+self.grid_padding_left
        self.paint.drawLine(x_pos,y1,x_pos,y2)
        self.paint.drawText(x_pos-fw/2,y2+12,str('10:30'))

        #时间轴14点00分
        x_pos = grid_width*0.75+self.grid_padding_left
        self.paint.drawLine(x_pos,y1,x_pos,y2)
        self.paint.drawText(x_pos-fw/2,y2+12,str('14:00'))

        #时间轴15点00分
        x_pos = grid_width+self.grid_padding_left
        self.paint.drawText(x_pos-fw,y2+12,str('15:00'))

        #时间虚线 by 30min
        self.setPen('red_1px_dashline')
        x_pos_array = [0.125,0.375,0.625,0.875]
        for i in x_pos_array:
            x_pos = grid_width*i+self.grid_padding_left
            self.paint.drawLine(x_pos,y1,x_pos,y2)


    '''绘制表格上方的股票信息'''
    def topInfoPaint(self):
        self.setPen('yellow')
        self.paint.drawText(4+self.grid_padding_left,self.grid_padding_top-4
                            ,str(self.parent.stk_info['name'])) #股票名称
        self.paint.drawText(4+self.grid_padding_left+120,self.grid_padding_top-4
                            ,str('均价线:')) #均价线
        lastclose = self.parent.stk_data['lastclose']
        close     = self.parent.stk_data['close']
        mma       = self.parent.stk_data['list']['mma'][-1]

        if lastclose>close:
            self.setPen('green')
            str_1 = '%.2f -%.2f'%(close,lastclose-close)
        if lastclose==close:
            self.setPen('white')
            str_1 = '%.2f +%.2f'%(close,0.00)
        if lastclose<close:
            self.setPen('red')
            str_1 = '%.2f +%.2f'%(close,close-lastclose)

        if mma>close:
            self.setPen('green')
        if mma==close:
            self.setPen('white')
        if mma<close:
            self.setPen('red')

        self.paint.drawText(4+self.grid_padding_left+55,self.grid_padding_top-4,str(str_1))
        self.paint.drawText(4+self.grid_padding_left+165,self.grid_padding_top-4,str('%.2f'%mma)) #均价

        #涨停价
        self.setPen('red')
        self.paint.drawText(4+self.grid_padding_left+200,self.grid_padding_top-4,str('涨停价:%.2f'%(lastclose*1.1))) #均价
        #跌停价
        self.setPen('green')
        self.paint.drawText(4+self.grid_padding_left+280,self.grid_padding_top-4,str('跌停价:%.2f'%(lastclose*0.9))) #均价
    '''绘制股价走势'''
    def pricePaint(self):
        sum_width  = self.grid_padding_left+self.grid_padding_right
        sum_height = self.grid_padding_top+self.grid_padding_bottom

        grid_height = self.h-sum_height-2

        high = self.parent.stk_data['high']
        low  = self.parent.stk_data['low']
        lastclose = self.parent.stk_data['lastclose']

        top = high-lastclose
        bottom = lastclose-low
        if top>bottom:
            padding = top
        else:
            padding = bottom

        limit_top = lastclose+padding
        limit_low = lastclose-padding

        h_radio = (grid_height*0.7)/((limit_top-limit_low)*100)

        w_radio = (self.w-sum_width-2)/240.00
        w = self.grid_padding_left

        self.setPen('white')
        path = QtGui.QPainterPath()
        path.moveTo(w,(limit_top-self.parent.stk_data['open'])*100*h_radio+self.grid_padding_top)
        i  = 1
        for price in self.parent.stk_data['list']['close']:
            w = i*w_radio+self.grid_padding_left
            y = (limit_top-price)*100*h_radio+self.grid_padding_top
            path.lineTo(w,y)
            i+=1
        self.paint.drawPath(path)
        self.setPen('cyan_1px_dashline')
        self.paint.drawLine(self.grid_padding_left+1,y,w-1,y)
        self.setPen('yellow')
        path = QtGui.QPainterPath()
        w = self.grid_padding_left
        path.moveTo(w,(limit_top-self.parent.stk_data['open'])*100*h_radio+self.grid_padding_top)
        i  = 1
        for price in self.parent.stk_data['list']['mma']:
            w = i*w_radio+self.grid_padding_left
            y = (limit_top-price)*100*h_radio+self.grid_padding_top
            path.lineTo(w,y)
            i+=1
        self.paint.drawPath(path)


    '''绘制成交量'''
    def volumePaint(self):
        sum_width  = self.grid_padding_left + self.grid_padding_right
        sum_height = self.grid_padding_top  + self.grid_padding_bottom

        max_volume = self.parent.stk_data['max_vol'] #最大分钟成交量

        w_radio = (self.w-sum_width-2)/240.00
        h_radio = ((self.h-sum_height-2)*0.3)/max_volume

        y = (self.h-sum_height)+self.grid_padding_top

        self.setPen('yellow')


        for i in range(1,len(self.parent.stk_data['list']['vol'])+1):
            x = i*w_radio+self.grid_padding_left
            y2 = h_radio*self.parent.stk_data['list']['vol'][i-1]
            self.paint.drawLine(x,y-1,x,y-y2)

class Test(QtGui.QWidget):
    def __init__(self, parent=None):
        QtGui.QWidget.__init__(self, parent)
        self.setMinimumSize(640, 430) #设置窗口最小尺寸
        self.setGeometry(300, 300, 960, 650)
        self.setWindowTitle(str('超级狙击手[内部开发测试版]-行情实时走势'))
        self.setStyleSheet("QWidget { background-color: black }")
        self.setWindowIcon(QtGui.QIcon('ruby.png'))
        self.setMouseTracking(True)
        self.m_x = 0 #光标x轴位置
        self.m_y = 0 #光标y轴位置

        self.stk_info = {}

        self.stk_info['name'] = '浙江东方'
        self.stk_info['code'] = '600120'
        self.stk_info['market'] = 'SH'

        self.stk_data = {}
        self.stk_data['list'] = {} #股价序列
        self.stk_data['list']['time']  = [] #时间
        self.stk_data['list']['open']  = [] #开盘价
        self.stk_data['list']['high']  = [] #最高价
        self.stk_data['list']['low']   = [] #最低价
        self.stk_data['list']['close'] = [] #收盘价
        self.stk_data['list']['vol']   = [] #成交量
        self.stk_data['list']['amount']= [] #成交额
        self.stk_data['list']['mma']= []   #分时均价

        self.stk_data['list']['buy_port'] = [(0.00,0),(0.00,0),(0.00,0),(0.00,0),(0.00,0)]  #买盘前五
        self.stk_data['list']['sell_port'] = [(0.00,0),(0.00,0),(0.00,0),(0.00,0),(0.00,0)] #卖盘前五

        #读取数据
        f = open('SH600120.txt','r')
        data = f.readlines()
        f.close()

        for row in data:
            vars = row.split(' ')
            self.stk_data['list']['time'].append(vars[1])
            self.stk_data['list']['open'].append(float(vars[2]))
            self.stk_data['list']['high'].append(float(vars[3]))
            self.stk_data['list']['low'].append(float(vars[4]))
            self.stk_data['list']['close'].append(float(vars[5]))
            self.stk_data['list']['vol'].append(int(float(vars[6])))
            self.stk_data['list']['amount'].append(int(float(vars[7])))

            sum_vol = sum(self.stk_data['list']['vol'])
            sum_amt = sum(self.stk_data['list']['amount'])

            self.stk_data['list']['mma'].append(float(sum_amt)/(sum_vol*100.00))

        self.stk_data['lastclose'] = 10.12 #上一个交易日收盘价
        self.stk_data['open'] = self.stk_data['list']['open'][0]       #开盘价
        self.stk_data['high'] = max(self.stk_data['list']['high'])     #最高价
        self.stk_data['low']  = min(self.stk_data['list']['low'])      #最低价
        self.stk_data['close']= self.stk_data['list']['close'][-1]     #收盘价
        self.stk_data['max_vol']  = max(self.stk_data['list']['vol'])  #当日最高成交量


    def mouseMoveEvent(self, event):
        self.m_x =  int(event.x())
        self.m_y =  int(event.y())
        self.repaint()
    def paintEvent(self, event):
        report_painter(self)

app = QtGui.QApplication(sys.argv)
dt = Test()
dt.show()
app.exec_()
还有这个是生造的数据文件:
600120 2011-07-01 8.430 8.480 8.340 8.360 3149769 26493056
600120 2011-07-04 8.410 8.520 8.340 8.510 4516001 38210836
600120 2011-07-05 8.540 8.560 8.410 8.480 7777481 65878192
600120 2011-07-06 8.490 8.490 8.300 8.420 5242033 43893128
600120 2011-07-07 8.440 8.460 8.300 8.400 6127618 51328900
600120 2011-07-08 8.350 8.650 8.310 8.600 9963714 84713360
600120 2011-07-11 8.560 8.740 8.520 8.580 10380010 89564168
600120 2011-07-12 8.500 8.560 8.380 8.410 5574160 46996364
600120 2011-07-13 8.400 8.520 8.390 8.470 4701829 39824976
600120 2011-07-14 8.500 8.690 8.460 8.630 7504610 64556320
600120 2011-07-15 8.630 8.660 8.530 8.620 5705629 48998892
600120 2011-07-18 8.610 8.730 8.560 8.630 5320452 46000688
600120 2011-07-19 8.580 8.600 8.420 8.450 4248058 36036192
600120 2011-07-20 8.510 8.550 8.340 8.420 4750361 40079624
600120 2011-07-21 8.420 8.460 8.320 8.330 3736405 31312912
600120 2011-07-22 8.320 8.390 8.270 8.310 3932585 32756464
600120 2011-07-25 8.290 8.290 7.830 7.850 6353668 51000860
600120 2011-07-26 7.880 8.010 7.860 7.970 3276690 25987310
600120 2011-07-27 8.010 8.330 8.010 8.230 6893659 56675756
600120 2011-07-28 8.140 8.200 7.900 8.080 4816761 38835260
600120 2011-07-29 8.100 8.110 7.900 7.960 3186438 25420588
600120 2011-08-01 7.990 8.070 7.980 8.020 2529614 20283316
600120 2011-08-02 8.000 8.000 7.660 7.740 8525883 66058452
600120 2011-08-03 7.610 7.790 7.590 7.750 3920131 30255948
600120 2011-08-04 7.760 7.900 7.710 7.870 4260037 33309532
600120 2011-08-05 7.550 7.670 7.540 7.600 4065619 31001802
600120 2011-08-08 7.550 7.590 6.840 7.010 5930435 42265528
600120 2011-08-09 6.780 6.900 6.400 6.850 6868576 45893344
600120 2011-08-10 7.000 7.060 6.900 6.950 4487516 31282836
600120 2011-08-11 6.720 7.350 6.690 7.300 6402779 44976020
600120 2011-08-12 7.260 7.820 7.250 7.810 15766826 120297096
600120 2011-08-15 7.810 8.080 7.700 7.850 12323882 97571784
600120 2011-08-16 7.810 8.230 7.800 8.130 10745946 86445416
600120 2011-08-17 8.100 8.380 8.030 8.370 11671606 95696840
600120 2011-08-18 8.360 8.590 8.150 8.190 11869045 98933000
600120 2011-08-19 8.100 8.290 7.870 8.260 6530784 52682404
600120 2011-08-22 8.240 8.510 8.130 8.210 7418123 62068352
600120 2011-08-23 8.300 8.300 7.930 8.080 6113382 49369428
600120 2011-08-24 8.080 8.170 7.800 7.950 6902403 54820380
600120 2011-08-25 7.990 8.000 7.800 7.950 8225919 65140832
600120 2011-08-26 7.980 8.580 7.870 8.390 14188172 117105688
600120 2011-08-29 8.280 8.600 8.200 8.420 12552920 105444392
600120 2011-08-30 8.470 8.650 8.290 8.310 9278734 78914264
600120 2011-08-31 8.390 8.600 8.260 8.470 6950031 58692324
600120 2011-09-01 8.460 8.530 8.120 8.150 6783869 56098000
600120 2011-09-02 8.130 8.150 7.800 7.930 5169247 41035356
600120 2011-09-05 7.900 7.900 7.610 7.770 3367080 25931720
600120 2011-09-06 7.650 7.840 7.630 7.780 1994604 15473853
600120 2011-09-07 7.800 7.920 7.710 7.890 4524852 35365940
600120 2011-09-08 8.000 8.000 7.750 7.780 3260041 25597960
600120 2011-09-09 7.790 7.850 7.690 7.720 1670190 12958421
600120 2011-09-13 7.610 7.610 7.220 7.350 2993141 22118428
600120 2011-09-14 7.410 7.490 7.280 7.460 1601320 11858549
600120 2011-09-15 7.460 7.540 7.380 7.450 1813248 13502755
600120 2011-09-16 7.490 7.570 7.380 7.500 1562320 11709203
600120 2011-09-19 7.380 7.490 7.350 7.350 1256729 9314678
600120 2011-09-20 7.390 7.420 7.070 7.160 4164802 30099376
600120 2011-09-21 7.160 7.350 7.030 7.310 4105156 29545046
600120 2011-09-22 7.240 7.420 7.180 7.190 2778893 20283590
600120 2011-09-23 6.990 7.260 6.930 7.080 3005942 21362102
600120 2011-09-26 7.140 7.280 7.000 7.030 2440617 17473004
600120 2011-09-27 7.100 7.140 6.970 7.050 1876199 13234751
600120 2011-09-28 7.110 7.130 6.850 6.850 1999641 13997734
600120 2011-09-29 6.850 6.850 6.620 6.680 2083164 14028082
600120 2011-09-30 6.800 6.850 6.660 6.810 1446665 9784671
600120 2011-10-10 6.800 7.490 6.800 7.340 6157517 44781964
600120 2011-10-11 7.410 7.550 7.180 7.330 5113073 37712548
600120 2011-10-12 7.330 7.850 7.200 7.650 7080724 53702240
600120 2011-10-13 7.650 7.700 7.480 7.570 3228726 24474174
600120 2011-10-14 7.520 7.830 7.510 7.610 5204745 40001128
600120 2011-10-17 7.530 7.640 7.420 7.470 3093406 23189326
600120 2011-10-18 7.470 7.470 7.240 7.250 2355012 17249810
600120 2011-10-19 7.300 7.350 7.150 7.250 2051058 14839307
600120 2011-10-20 7.200 7.260 6.950 7.040 2177500 15435905
600120 2011-10-21 7.050 7.050 6.850 6.920 1479998 10263274
600120 2011-10-24 6.920 7.050 6.820 7.040 2828763 19645222
600120 2011-10-25 7.090 7.150 6.900 7.110 5454243 38421580
600120 2011-10-26 7.080 7.250 6.980 7.090 7561318 53553768
600120 2011-10-27 7.090 7.110 6.990 7.020 4331955 30494264
600120 2011-10-28 7.080 7.160 7.050 7.130 5397767 38375040
600120 2011-10-31 7.130 7.230 7.120 7.230 4416981 31686934
600120 2011-11-01 7.190 7.240 7.080 7.090 6221598 44541308
600120 2011-11-02 6.970 7.090 6.790 7.070 6240368 43274104
600120 2011-11-03 7.060 7.250 7.060 7.210 7434887 53413296
600120 2011-11-04 7.190 7.310 7.160 7.260 5469346 39634672
600120 2011-11-07 7.230 7.330 7.170 7.280 4881876 35415712
600120 2011-11-08 7.280 7.300 7.030 7.090 5152319 36909572
600120 2011-11-09 7.090 7.140 6.990 7.120 4396667 31023112
600120 2011-11-10 7.010 7.060 6.950 6.980 2874227 20162434
600120 2011-11-11 6.980 7.040 6.940 6.980 1971345 13774011
600120 2011-11-14 7.020 7.220 7.000 7.200 5005408 35833604
600120 2011-11-15 7.170 7.260 7.160 7.220 3018996 21752406
600120 2011-11-16 7.220 7.250 7.000 7.020 3599804 25579700
600120 2011-11-17 7.020 7.090 6.980 7.030 1793379 12631356
600120 2011-11-18 7.000 7.100 6.910 6.930 3106221 21753164
600120 2011-11-21 6.910 6.970 6.800 6.910 1656054 11393588
600120 2011-11-22 6.850 6.900 6.800 6.870 1683639 11521032
600120 2011-11-23 6.870 6.910 6.760 6.790 1465450 10027905
600120 2011-11-24 6.720 6.790 6.650 6.700 1649095 11059988
600120 2011-11-25 6.710 6.750 6.660 6.710 1086150 7282331
600120 2011-11-28 6.750 6.820 6.720 6.800 1174999 7964600
600120 2011-11-29 6.910 6.920 6.780 6.860 1269253 8674397
600120 2011-11-30 6.810 6.860 6.520 6.550 2604110 17315016
600120 2011-12-01 6.690 6.750 6.630 6.680 2671312 17883724
600120 2011-12-02 6.680 6.680 6.450 6.510 1473269 9605086
600120 2011-12-05 6.480 6.480 6.110 6.200 1719220 10751089
600120 2011-12-06 6.170 6.240 6.140 6.210 1223995 7571687
600120 2011-12-07 6.220 6.260 6.180 6.200 961999 5985017
600120 2011-12-08 6.190 6.260 6.110 6.250 1161611 7200791
600120 2011-12-09 6.230 6.240 6.180 6.230 653267 4056483
600120 2011-12-12 6.200 6.240 6.130 6.230 652932 4044556
600120 2011-12-13 6.170 6.200 5.850 6.010 2992541 17886124
600120 2011-12-14 5.970 6.010 5.720 5.950 1722800 10140223
600120 2011-12-15 5.900 6.120 5.640 5.760 3439396 19840406
600120 2011-12-16 5.710 5.810 5.470 5.800 1940713 10971714
600120 2011-12-19 5.760 5.760 5.500 5.690 2164208 12149138
600120 2011-12-20 5.600 5.740 5.600 5.620 1237797 7036752
600120 2011-12-21 5.680 5.710 5.400 5.450 1137091 6378653
600120 2011-12-22 5.360 5.400 5.100 5.230 1565667 8225734
600120 2011-12-23 5.180 5.340 5.180 5.270 1033967 5447228
600120 2011-12-26 5.280 5.310 5.200 5.290 1060186 5591960
600120 2011-12-27 5.250 5.270 5.020 5.100 1373900 7103701
600120 2011-12-28 5.060 5.060 4.830 5.020 1516885 7513323
600120 2011-12-29 5.020 5.060 4.910 4.960 1074220 5366675
600120 2012-01-04 5.090 5.140 4.920 4.930 1904790 9586652
600120 2012-01-05 4.860 4.870 4.680 4.690 1409501 6735327
600120 2012-01-06 5.020 5.100 4.800 4.880 2230808 10954823
600120 2012-01-09 4.890 5.290 4.880 5.260 3338809 16978868
600120 2012-01-10 5.200 5.500 5.150 5.460 3648924 19501378
600120 2012-01-11 5.440 5.440 5.300 5.340 2861417 15362869
600120 2012-01-12 5.340 5.440 5.310 5.350 1763741 9495084
600120 2012-01-13 5.380 5.380 5.100 5.140 2438074 12696630
600120 2012-01-16 5.010 5.170 4.960 4.970 1145104 5807568
600120 2012-01-17 5.000 5.290 4.970 5.290 2698856 14019675
600120 2012-01-18 5.260 5.350 5.180 5.280 2634491 13893458
600120 2012-01-19 5.270 5.350 5.200 5.310 1816398 9624942
600120 2012-01-20 5.330 5.460 5.310 5.430 2573601 13906017
600120 2012-01-30 5.400 5.480 5.340 5.360 1832939 9883418
600120 2012-01-31 5.350 5.390 5.290 5.350 1242594 6630515
600120 2012-02-01 5.370 5.450 5.320 5.320 1841967 9919325
600120 2012-02-02 5.330 5.570 5.330 5.550 4581848 25035066
600120 2012-02-03 5.550 5.650 5.470 5.560 4893311 27319804
600120 2012-02-06 5.530 5.880 5.500 5.750 5100686 29265454
600120 2012-02-07 5.640 5.690 5.590 5.610 3227565 18154338
600120 2012-02-08 5.610 5.790 5.560 5.780 3591428 20524218
600120 2012-02-09 5.730 5.830 5.730 5.760 3408817 19736262
600120 2012-05-10 6.340 6.340 6.340 6.340 514959 3264840
600120 2012-05-14 6.970 6.970 6.970 6.970 931840 6494925
600120 2012-05-15 7.670 7.670 6.760 6.910 27411760 201302192
600120 2012-05-16 6.610 6.790 6.580 6.630 9972930 66460172
600120 2012-05-17 6.600 6.670 6.400 6.490 8248599 53690064
600120 2012-05-18 6.400 6.610 6.320 6.400 5609795 36256556
600120 2012-05-21 6.410 6.520 6.210 6.290 4537627 28691816
600120 2012-05-22 6.340 6.410 6.290 6.370 4063683 25810310
600120 2012-05-23 6.370 6.450 6.180 6.250 4498954 28159672
600120 2012-05-24 6.270 6.380 6.200 6.350 4195454 26358802
600120 2012-05-25 6.320 6.480 6.230 6.360 6258612 39857576
600120 2012-05-28 6.320 6.400 6.190 6.400 4998941 31474214
600120 2012-05-29 6.400 6.530 6.360 6.440 5729309 37068284
600120 2012-05-30 6.460 6.460 6.350 6.370 3101571 19816940
600120 2012-05-31 6.300 6.350 6.230 6.240 3738985 23467144
600120 2012-06-01 6.210 6.280 6.080 6.110 4507252 27767424
600120 2012-06-04 6.000 6.010 5.840 5.860 3086545 18299630
600120 2012-06-05 5.870 5.960 5.860 5.930 1942942 11496336
600120 2012-06-06 5.960 5.960 5.600 5.760 2998969 17440282
600120 2012-06-07 5.780 5.960 5.770 5.790 2594537 15175500
600120 2012-06-08 5.830 5.880 5.700 5.750 1808774 10501804
600120 2012-06-11 5.800 5.850 5.730 5.830 1861236 10775968
600120 2012-06-12 5.850 5.930 5.800 5.850 2007190 11774889
600120 2012-06-13 5.860 6.130 5.790 6.100 5304235 31868112
600120 2012-06-14 6.050 6.090 5.910 5.930 3202802 19241666
600120 2012-06-15 5.930 5.970 5.810 5.900 1774010 10459891
600120 2012-06-18 5.900 5.990 5.870 5.880 2001440 11862747
600120 2012-06-19 5.880 5.950 5.820 5.830 1968435 11601531
600120 2012-06-20 5.840 5.980 5.810 5.950 2428144 14288923
600120 2012-06-21 5.910 5.910 5.700 5.760 1990001 11558386
600120 2012-06-26 5.530 5.590 5.400 5.480 2086008 11426576
600120 2012-06-27 5.470 5.580 5.450 5.450 1080842 5962850
600120 2012-06-28 5.510 5.520 5.260 5.280 1549881 8344252
600120 2012-06-29 5.250 5.350 5.180 5.330 1597134 8426737
600120 2012-07-02 5.400 5.410 5.320 5.350 1118989 5986785
600120 2012-07-03 5.370 5.430 5.310 5.400 1379692 7439132
600120 2012-07-04 5.400 5.470 5.380 5.410 1395455 7563382
600120 2012-07-05 5.410 5.410 5.280 5.360 1534313 8190450
600120 2012-07-06 5.400 5.520 5.320 5.400 2657751 14387281
600120 2012-07-09 5.400 5.490 5.320 5.330 2448854 13205528
600120 2012-07-10 5.350 5.860 5.340 5.860 7802024 45076920
600120 2012-07-11 6.110 6.330 6.060 6.240 22276192 137748160
600120 2012-07-12 6.130 6.330 6.030 6.320 16639952 103002552
600120 2012-07-13 6.250 6.890 6.170 6.610 19638960 127671288
600120 2012-07-16 6.500 6.750 6.410 6.490 15513604 102224928
600120 2012-07-17 6.360 6.950 6.260 6.820 18767700 124877352
600120 2012-07-18 6.720 7.000 6.560 6.800 18327382 124799976
600120 2012-07-19 6.700 6.860 6.550 6.680 15164894 101237520
600120 2012-07-20 6.550 6.630 6.380 6.440 9728719 63227360
600120 2012-07-23 6.330 6.370 6.160 6.320 7001618 44002316
600120 2012-07-24 6.270 6.450 6.220 6.340 6881987 43810260
600120 2012-07-25 6.250 6.660 6.210 6.500 12923801 83741672
600120 2012-07-26 6.450 6.550 6.150 6.200 7061937 44964776
600120 2012-07-27 6.410 6.420 6.110 6.230 5700987 35619536
600120 2012-07-30 6.170 6.240 5.610 5.610 8543043 49370452
600120 2012-07-31 5.600 5.940 5.480 5.710 7669121 44260340
600120 2012-08-01 5.620 5.830 5.550 5.720 4405627 25176060
600120 2012-08-02 5.730 5.970 5.680 5.890 7018821 41113080
600120 2012-08-03 5.850 5.940 5.830 5.930 3797656 22333222
600120 2012-08-06 5.930 6.050 5.820 6.010 5291014 31587280
600120 2012-08-07 6.010 6.330 6.000 6.190 8028181 49717732
600120 2012-08-08 6.220 6.220 6.060 6.140 4085520 24994584
600120 2012-08-09 6.100 6.120 5.810 6.120 8067361 48357004
600120 2012-08-10 6.050 6.190 6.010 6.060 4016290 24371520
600120 2012-08-13 6.200 6.670 6.200 6.330 15222520 97680776
600120 2012-08-14 6.500 6.900 6.350 6.680 17682586 117190552
600120 2012-08-15 6.690 6.690 6.330 6.390 10266937 66058708
600120 2012-08-16 6.400 6.660 6.150 6.160 9145371 58658368
600120 2012-08-17 6.120 6.160 5.940 6.100 6471054 39053048
600120 2012-08-20 6.100 6.290 5.980 6.270 5655946 34765680
600120 2012-08-21 6.150 6.300 6.120 6.230 6037340 37561272
600120 2012-08-22 6.230 6.230 6.000 6.050 5329714 32457810
600120 2012-08-23 5.940 6.140 5.940 6.090 3759488 22779714
600120 2012-08-24 6.150 6.290 6.050 6.080 6970082 42997304
600120 2012-08-27 6.050 6.050 5.720 5.850 4477758 26282412
600120 2012-08-28 5.860 5.930 5.770 5.900 2470654 14475564
600120 2012-08-29 5.900 5.900 5.750 5.750 3104898 17997202
600120 2012-08-30 5.690 5.850 5.590 5.670 2875641 16442648
600120 2012-08-31 5.670 5.780 5.600 5.750 1848001 10556758
600120 2012-09-03 5.740 5.930 5.680 5.900 3951762 23129270
600120 2012-09-04 5.920 5.920 5.690 5.700 3707201 21481764
600120 2012-09-05 5.690 5.750 5.620 5.720 2782154 15832339
600120 2012-09-06 5.750 5.780 5.640 5.690 2869553 16314120
600120 2012-09-07 5.760 5.970 5.700 5.890 5783402 33932288
600120 2012-09-10 5.890 6.080 5.860 6.060 6170653 37105776
600120 2012-09-11 6.040 6.060 5.910 6.060 3652909 21851064
600120 2012-09-12 6.100 6.130 6.020 6.060 3930014 23842410
600120 2012-09-13 6.080 6.100 5.910 5.910 2957667 17805100
600120 2012-09-14 5.920 6.000 5.830 5.890 2792995 16490332
600120 2012-09-17 5.820 5.890 5.640 5.640 2734759 15720210
600120 2012-09-18 5.640 5.760 5.610 5.650 1748883 9932194
600120 2012-09-19 5.680 5.780 5.680 5.740 1306841 7485999
600120 2012-09-20 5.740 5.740 5.380 5.450 2683344 14859092
600120 2012-09-21 5.440 5.470 5.300 5.430 1612603 8708786
600120 2012-09-24 5.450 5.510 5.380 5.480 1343010 7340127
600120 2012-09-25 5.480 5.490 5.340 5.380 1247570 6757381
600120 2012-09-26 5.360 5.440 5.130 5.180 1431045 7528501
600120 2012-09-27 5.170 5.330 5.140 5.260 1763023 9279980
600120 2012-09-28 5.200 5.360 5.200 5.340 2006394 10612739
600120 2012-10-08 5.360 5.560 5.350 5.460 3435758 18897262
600120 2012-10-09 5.460 5.550 5.450 5.550 2209764 12187114
600120 2012-10-10 5.540 5.580 5.480 5.570 1898232 10539406
600120 2012-10-11 5.550 5.570 5.410 5.460 1873838 10315861
600120 2012-10-12 5.460 5.490 5.360 5.460 1619960 8811500
600120 2012-10-15 5.480 5.480 5.330 5.360 1355799 7280243
600120 2012-10-16 5.390 5.430 5.330 5.430 1427428 7711129
600120 2012-10-17 5.440 5.500 5.400 5.480 1262048 6901247
600120 2012-10-18 5.450 5.560 5.450 5.540 1938503 10716095
600120 2012-10-19 5.500 5.560 5.500 5.550 1629063 9013752
600120 2012-10-22 5.500 5.540 5.460 5.540 1523985 8396867
600120 2012-10-23 5.520 5.550 5.470 5.470 1517978 8364718
600120 2012-10-24 5.480 5.640 5.480 5.620 4318489 24147084
600120 2012-10-25 5.600 5.620 5.460 5.510 2332800 12935266
600120 2012-10-26 5.500 5.520 5.300 5.320 1968179 10570681
600120 2012-10-29 5.300 5.350 5.240 5.280 1184547 6253799
600120 2012-10-30 5.280 5.370 5.270 5.350 861803 4588509
600120 2012-10-31 5.370 5.370 5.240 5.290 1023519 5407486
600120 2012-11-01 5.300 5.420 5.280 5.410 1483984 7962948
600120 2012-11-02 5.410 5.440 5.360 5.440 1308161 7073081
600120 2012-11-05 5.450 5.530 5.400 5.500 2027746 11118383
600120 2012-11-06 5.500 5.500 5.370 5.450 1314405 7139731
600120 2012-11-07 5.360 5.370 5.160 5.270 4737230 24837488
600120 2012-11-08 5.200 5.240 5.140 5.150 2036601 10567178
600120 2012-11-09 5.130 5.220 5.120 5.200 1307604 6757081
600120 2012-11-12 5.200 5.380 5.070 5.360 4254705 22151888
600120 2012-11-13 5.700 5.900 5.530 5.530 15434146 88320960
600120 2012-11-14 5.390 5.430 5.150 5.210 8091713 42871408
600120 2012-11-15 5.200 5.320 5.150 5.180 3814789 19947090
600120 2012-11-16 5.160 5.180 5.000 5.090 3265990 16524752
600120 2012-11-19 5.090 5.140 5.010 5.100 2257164 11403216
600120 2012-11-20 5.100 5.140 5.030 5.030 1571279 7984035
600120 2012-11-21 5.000 5.060 4.880 5.050 3050816 15147326
600120 2012-11-22 5.000 5.020 4.920 4.950 1788547 8869217
600120 2012-11-23 4.960 5.020 4.940 4.960 1372151 6832961
600120 2012-11-26 4.980 4.990 4.880 4.880 1137756 5597685
600120 2012-11-27 4.860 4.950 4.700 4.740 1689649 8158868
600120 2012-11-28 4.740 4.740 4.520 4.590 1284289 5941912
600120 2012-11-29 4.590 4.640 4.480 4.490 969922 4423860
600120 2012-11-30 4.450 4.560 4.450 4.520 1235100 5569609
600120 2012-12-03 4.520 4.550 4.310 4.320 1379623 6147945
600120 2012-12-04 4.320 4.410 4.230 4.380 1667153 7171231
600120 2012-12-05 4.360 4.580 4.360 4.580 2422869 10954693
600120 2012-12-06 4.580 4.620 4.500 4.540 1407798 6396522
600120 2012-12-07 4.510 4.700 4.510 4.680 2462421 11472038
600120 2012-12-10 4.680 4.880 4.680 4.830 3202908 15354105
600120 2012-12-11 4.830 4.910 4.740 4.740 3257935 15748287
600120 2012-12-12 4.740 4.780 4.650 4.730 2110366 9952871
600120 2012-12-13 4.700 4.800 4.650 4.720 2028066 9630472
600120 2012-12-14 4.680 4.930 4.680 4.890 4415891 21475120
600120 2012-12-17 4.870 5.090 4.870 4.940 5758027 28685946
600120 2012-12-18 4.910 5.030 4.900 4.920 3205939 15937582
600120 2012-12-19 4.950 4.970 4.890 4.940 1970912 9721340
600120 2012-12-20 4.910 4.970 4.860 4.960 2776664 13648103
600120 2012-12-21 5.000 5.020 4.930 4.940 2582680 12835924
600120 2012-12-24 4.900 4.990 4.900 4.950 1395443 6916473
600120 2012-12-25 4.910 5.040 4.910 5.030 3671653 18358908
600120 2012-12-26 5.030 5.080 4.990 5.070 3383588 17015576
600120 2012-12-27 5.050 5.100 5.020 5.030 3100081 15631201
600120 2012-12-28 5.020 5.050 5.000 5.040 3738248 18785418
600120 2012-12-31 5.050 5.210 5.020 5.180 5492425 28178540
600120 2013-01-04 5.180 5.250 5.040 5.160 4505342 23113802
600120 2013-01-07 5.140 5.240 5.100 5.230 3740693 19357138
600120 2013-01-08 5.230 5.250 5.160 5.230 3428131 17831330
600120 2013-01-09 5.750 5.750 5.620 5.750 15137964 86851376
600120 2013-01-10 5.890 5.890 5.590 5.680 19259634 109951720
600120 2013-01-11 5.710 6.190 5.600 5.830 17767632 104686280
600120 2013-01-14 5.700 6.140 5.690 6.080 17128604 103055384
600120 2013-01-15 6.050 6.110 5.950 6.080 11690986 70449808
600120 2013-01-16 6.060 6.060 5.810 5.940 9519043 56312520
600120 2013-01-17 5.940 5.940 5.760 5.820 5490334 31996616
600120 2013-01-18 5.840 5.910 5.800 5.870 4441257 26049472
600120 2013-01-21 5.900 5.950 5.830 5.950 4949409 29187012
600120 2013-01-22 5.920 5.960 5.800 5.890 5524068 32470218
600120 2013-01-23 5.890 5.920 5.670 5.760 5285930 30515522
600120 2013-01-24 5.830 5.990 5.700 5.810 8746975 51253216
600120 2013-01-25 5.710 5.780 5.670 5.690 2938357 16774085
600120 2013-01-28 5.720 5.920 5.720 5.920 5615520 32894768
600120 2013-01-29 5.920 6.030 5.870 5.970 7778448 46530040
600120 2013-01-30 5.970 6.170 5.970 6.050 7974663 48414056
600120 2013-01-31 6.450 6.660 6.250 6.330 20167094 129655856
600120 2013-02-01 6.330 6.850 6.260 6.480 15610902 102880336
600120 2013-02-04 6.330 6.330 6.080 6.130 11360102 70013160
600120 2013-02-05 6.030 6.160 6.020 6.140 4903472 29867632
600120 2013-02-06 6.170 6.230 6.120 6.170 3826076 23581090
600120 2013-02-07 6.140 6.220 6.130 6.180 3255472 20093372
600120 2013-02-08 6.200 6.260 6.180 6.190 4681355 29087642
600120 2013-02-18 6.280 6.310 6.200 6.260 4845549 30340608
600120 2013-02-19 6.250 6.320 6.100 6.130 4727252 29183232
600120 2013-02-20 6.170 6.300 6.130 6.300 5596862 34757520
600120 2013-02-21 6.260 6.490 6.200 6.440 12809449 81299392
600120 2013-02-22 6.410 6.510 6.270 6.290 7584128 48492400
600120 2013-02-25 6.280 6.330 6.160 6.310 5220263 32598266
600120 2013-02-26 6.320 6.420 6.220 6.240 6156654 38917012
600120 2013-02-27 6.210 6.320 6.190 6.240 4068847 25377816
600120 2013-02-28 6.270 6.410 6.220 6.370 7447814 47241996
600120 2013-03-01 6.360 6.610 6.260 6.610 14957895 96688696
600120 2013-03-04 6.520 6.780 6.440 6.550 13564858 89516888
600120 2013-03-05 6.500 6.800 6.500 6.720 11519010 76836992
600120 2013-03-06 6.920 7.390 6.800 7.390 26849848 189968432
600120 2013-03-07 7.780 8.130 7.670 8.030 40965844 322816768
600120 2013-03-08 7.950 8.220 7.730 7.790 28627918 228489488
600120 2013-03-11 7.870 7.870 7.180 7.530 18937636 141743744
600120 2013-03-12 7.450 7.620 7.170 7.480 15535111 115027416
600120 2013-03-13 7.410 7.540 7.230 7.420 10559835 78049992
600120 2013-03-14 7.350 7.630 7.340 7.450 11297736 84727264
600120 2013-03-15 7.490 7.710 7.310 7.540 14645334 110597144
600120 2013-03-18 7.400 7.400 6.900 7.010 13872665 98271352
600120 2013-03-19 6.980 7.150 6.770 6.910 10347213 71593536
600120 2013-03-20 6.940 7.260 6.850 7.200 11781630 83496264
600120 2013-03-21 7.150 7.520 7.150 7.490 12763050 94041384
600120 2013-03-22 7.420 7.670 7.280 7.570 13966066 104551368
600120 2013-03-25 7.750 7.990 7.610 7.630 15983236 124691712
600120 2013-03-26 7.630 8.390 7.600 8.380 26428312 211724464
600120 2013-03-27 8.250 8.540 8.090 8.260 24350716 202126576
600120 2013-03-28 8.170 8.770 7.890 8.500 34068656 286435744
600120 2013-03-29 8.370 8.600 8.240 8.240 14159268 118628944
600120 2013-04-01 8.310 8.740 8.280 8.500 17816092 152612272
600120 2013-04-02 8.690 8.700 7.810 8.000 18838794 156627616
600120 2013-04-03 7.990 8.200 7.800 7.920 11452403 91542184
600120 2013-04-08 7.730 8.550 7.560 8.470 13963396 113644160
600120 2013-04-09 8.540 8.970 8.460 8.840 18834228 165475248
600120 2013-04-10 8.790 8.870 8.630 8.770 10376445 90857848
600120 2013-04-11 8.770 8.850 8.560 8.610 8377727 72409424
600120 2013-04-12 8.720 9.080 8.720 8.890 19480370 173966848
600120 2013-04-15 8.910 8.980 8.620 8.630 10265764 89914552
600120 2013-04-16 8.480 8.930 8.190 8.840 13336577 114974256
600120 2013-04-17 8.790 9.040 8.630 8.940 11676056 103827328
600120 2013-04-18 8.860 9.280 8.800 9.080 11847024 107250600
600120 2013-04-19 9.100 9.990 8.980 9.790 33011634 318405920
---- 再次鸣谢 散漫 童鞋的热心。
---- 我在用 matplotlib 的时候有接触过 PyQT 和 wxPython 的概念,另外昨天也稍微股沟了一下。它们之间的关系: matplotlib 是前端,PyQT 或 wxPython 是后端。或者说 matplotlib 相当于 Python,而 PyQT 和 wxPython 相当于 C。
*. 实际用的时候,可以用 matplotlib 绘图,也可以直接用 PyQT 绘图,也可以用 PyQT 做一个 GUI 然后在后台调用 matplotlib 绘图,取舍的考虑也跟 Python 和 C 很像:PyQT 快些,但都是些底层的特性。matplotlib 用起来方便,但速度就不那么可观,只适合做一些不要求实时性的静态任务。
*. 用 matplotlib 绘图的时候可以指定使用哪种后台,比如这个:
import matplotlib

# 这个要紧跟在 import matplotlib 之后,而且必须安装了 wxpython 2.8 才行。
matplotlib.use("WXAgg", warn=True)
这个就是指定后台使用 wxPython,当然必须先安装了这个组件才行。
*. matplotlib 代码里可以直接使用 PyQT 等后端的特性,比如捕捉鼠标点击事件,等等。
---- 另外,有一位 伊莱·班德斯基 童鞋(看文章是个大牛)演示了怎样把 PyQT 和 matplotlib 整合在一起,用 PyQT 写图形界面,在后台调用 matplotlib 绘图:
http://eli.thegreenplace.net/2009/01/20/matplotlib-with-pyqt-guis/
---- 最后说明下,PyQT 只有 GPL 授权和商业授权可选。无论屌丝拿它开发了什么唯我独尊的牛B项目,只要还 买不起 不想购买商业许可,那只能门户开放,大家利益均沾。
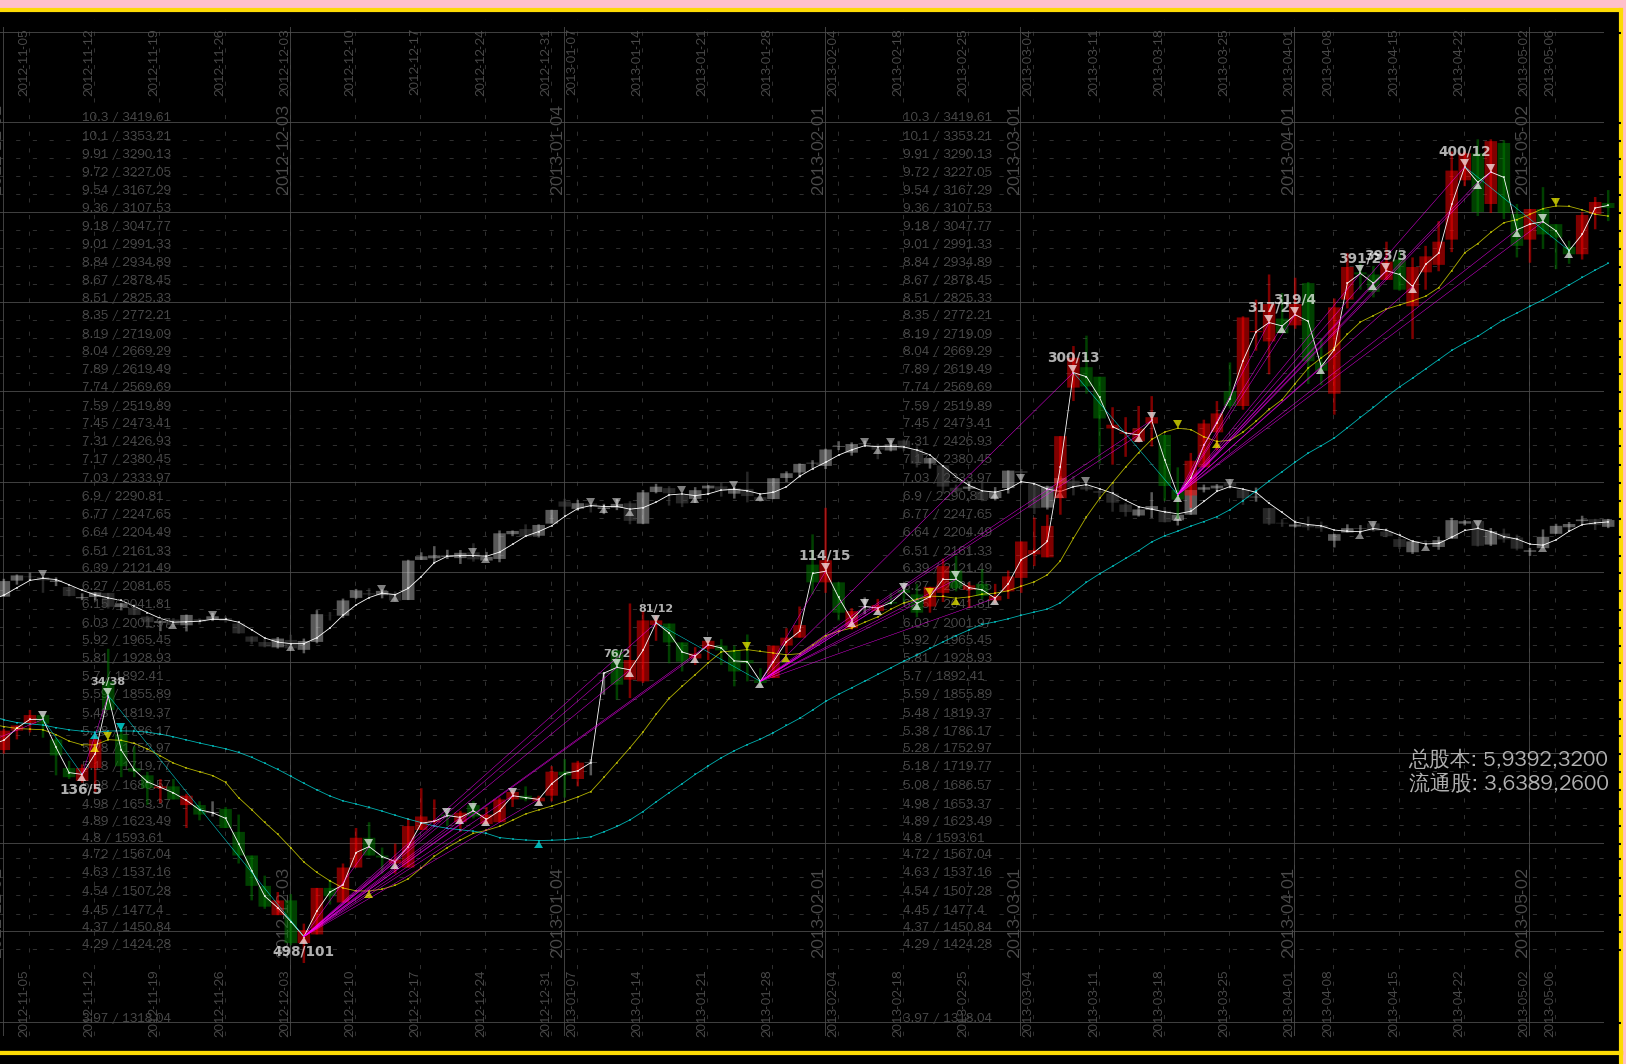
趋势线
---- 有句话怎么说来着,“只有趋势才是你的朋友”。
---- 对任意一点可以辨认它所处的趋势。算法保证如果 A 点和 B 点的趋势起点都在 O,那么 A、B 之间任意一点的趋势起点也在 O 点。
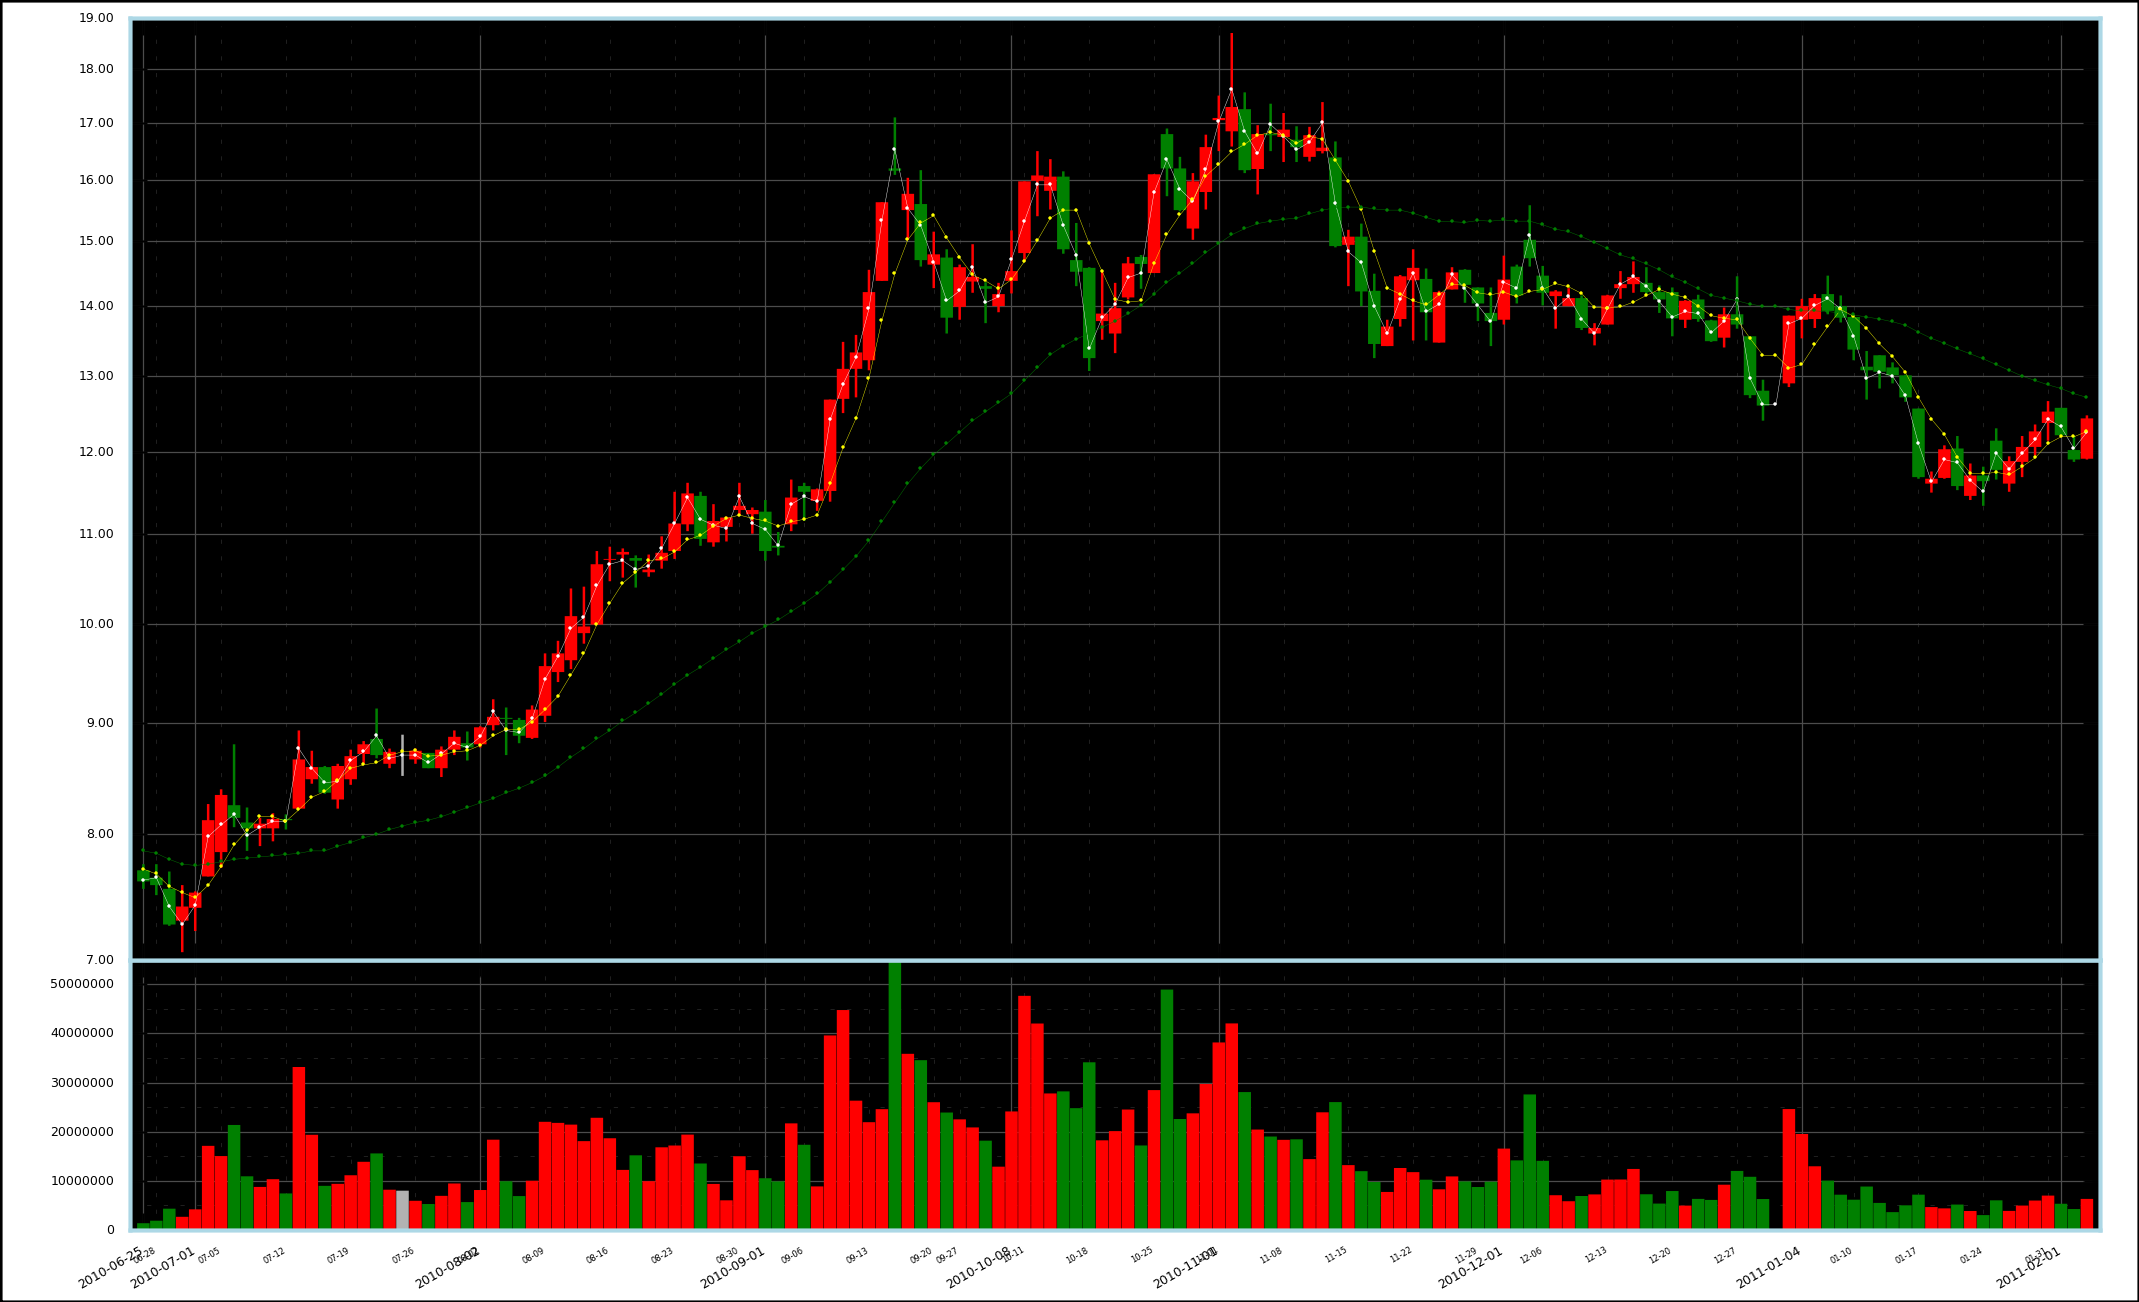
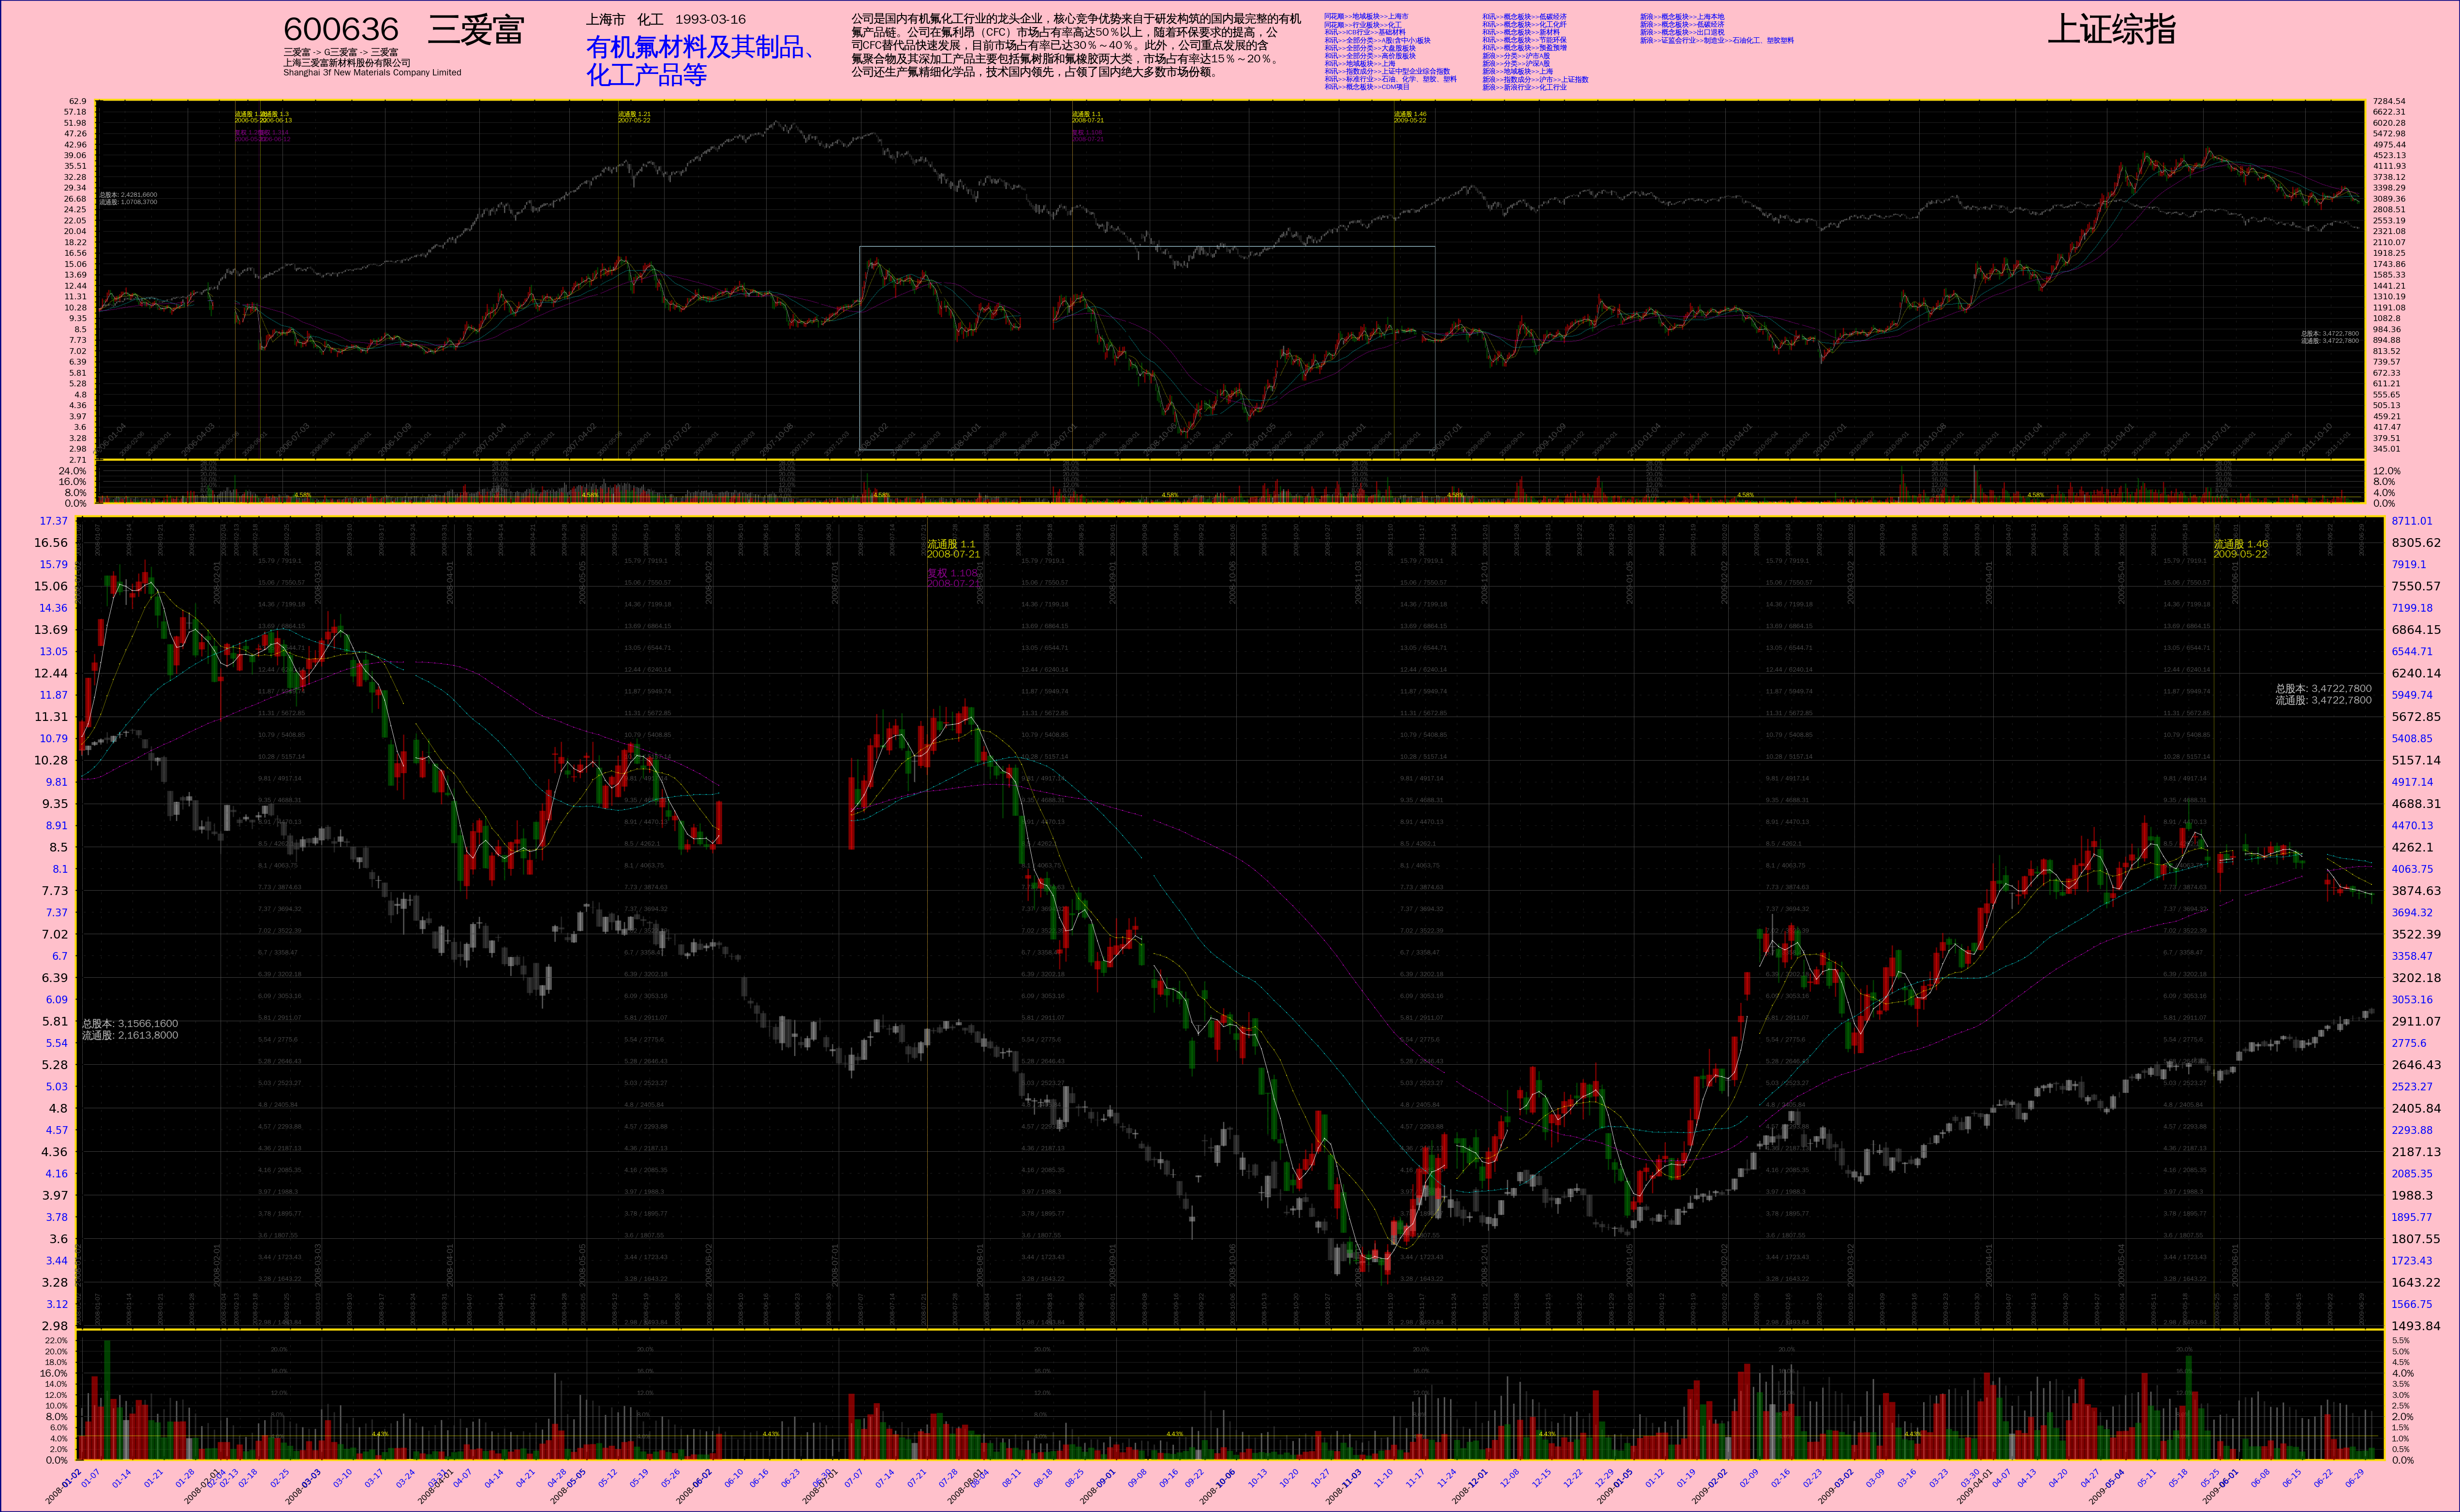
用 Python / Matplotlib 画出来的股票 K线图 (四)
---- 前一篇在这: 用 Python / Matplotlib 画出来的股票 K线图 (三)
---- 日线与分时对比行情:

---- 下面是绘图脚本与绘图数据合在一起的压缩文件。注意:
1. 是 py3 脚本,matplotlib 已经支持 py3。绝大部分都是中文写的,不想被英文虐出翔了。
2. 是 Linux 下写的,需要在 Linux 下执行。先解压,然后到生成的目录下执行:
python3 绘图.py
就可以了。会生成一个 绘图.log 文件和一个图片文件放在相同目录下。
<补记>:已经证实经过很小的改动就可以在 windows 下运行,输出中文字内容的大小样式有区别,其它一样,得益于 python 和 matplotlib 的跨平台特性。但是我不知道具体改哪些。
---- 解压后的文件结构:
日线分时对比行情/
├Public/
│├Public.py
│└__init__.py
├子图定义/
│├__init__.py
│├公司信息子图.py
│├分时价格子图.py
│├分时手数子图.py
│├实盘价格子图.py
│├实盘手数子图.py
│├日线价格子图.py
│└日线换手子图.py
├绘图.py
└绘图数据.pickle
---- 关于授权:除了特别说明的以外,本博客里的代码都用 “干啥随你便” 协议进行授权。
Unless otherwise noted, all code pieces in this blog are licensed under the "DWYW(Do What the f Whatever You Want)" agreement. Good luck.
---- Download
用 Python / Matplotlib 画出来的股票 K线图 (三)
---- 前一篇在这: 用 Python / Matplotlib 画出来的股票 K线图 (二)
---- 后一篇在这: 用 Python / Matplotlib 画出来的股票 K线图 (四)
---- 就像上回说的,新内容加进来。除此之外,与上一版代码相比最大的改动就是内部重构过,子图全部定义成 class。图中一共包含 5 个子图,从上到下依次是: 基本信息(就是那些文字)、历史价格、历史换手率、价格、换手率。通过输入的绘图数据进行控制,任何一个子图都可以关闭,关闭子图可以节省绘图时间和存储空间。本来还有一个财务信息子图要加进去,但是现在想暂时告一段落,先弄点其它的。
---- 作为输入的 Python pickle file 在 这里。
---- 最后是脚本,仍然是 Python 2 的:
# -*- coding: utf-8 -*-
import os
import sys
import pickle
import math
import datetime
import itertools
import matplotlib
matplotlib.use("WXAgg", warn=True) # 这个要紧跟在 import matplotlib 之后,而且必须安装了 wxpython 2.8 才行。
import matplotlib.pyplot as pyplot
import matplotlib.font_manager as font_manager
import numpy
from matplotlib.ticker import NullLocator, FixedLocator, MultipleLocator, FuncFormatter, NullFormatter
from matplotlib.patches import Ellipse
__font_properties__= font_manager.FontProperties(fname='/usr/share/fonts/truetype/wqy/wqy-zenhei.ttc')
__color_lightsalmon__= '#ffa07a'
__color_pink__= '#ffc0cb'
__color_navy__= '#000080'
__color_gold__= '#FDDB05'
__color_gray30__= '0.3'
__color_gray70__= '0.7'
__color_lightblue__= 'lightblue'
__shrink__= 1.0 / 4
__expbase__= 1.1
class SubPlot_BasicInfo:
'''
公司的基本信息
Note: this is not "real" subplot, no Axes object contained.
'''
def __init__(self, pdata, parent, name):
self._name= name
self._pdata= pdata
self._cominfo= self._pdata[u'公司信息']
self._parent= parent
self._Axes= None
self._xsize, \
self._ysize= self._compute_size()
def _compute_size(self):
return (300.0, 1.8)
def get_size(self):
return (self._xsize, self._ysize)
def build_axes(self, figobj, rect):
axes= figobj.add_axes(rect)
axes.set_frame_on(False)
self._Axes= axes
self.set_xticks()
self.set_yticks()
def set_xticks(self):
axes= self._Axes
xaxis= axes.get_xaxis()
# 设定 X 轴坐标的范围
#==================================================================================================================================================
axes.set_xlim(0, self._xsize)
xaxis.set_major_locator(NullLocator())
for mal in axes.get_xticklabels(minor=False):
mal.set_visible(False)
for mil in axes.get_xticklabels(minor=True):
mil.set_visible(False)
def set_yticks(self):
axes= self._Axes
yaxis= axes.get_yaxis()
# 设定 X 轴坐标的范围
#==================================================================================================================================================
axes.set_ylim(0, self._ysize)
yaxis.set_major_locator(NullLocator())
for mal in axes.get_yticklabels(minor=False):
mal.set_visible(False)
for mil in axes.get_yticklabels(minor=True):
mil.set_visible(False)
def plot(self):
self.plot_codesymbol(xbase=0.0, ybase=self._ysize)
self.plot_codesymbol_2(xbase=self._xsize, ybase=self._ysize)
self.plot_companyname(xbase=0.0, ybase=self._ysize-0.8)
self.plot_companylocation(xbase=48.0, ybase=self._ysize)
self.plot_mainbusiness(xbase=48.0, ybase=self._ysize)
self.plot_description(xbase=90.0, ybase=self._ysize)
self.plot_sortinginfo(xbase=165.0, ybase=self._ysize)
def plot_codesymbol(self, xbase, ybase):
'''
交易代码、公司简称
'''
txtstr= self._cominfo[u'代码'] + u' ' + self._cominfo[u'简称']
label= self._Axes.text(xbase, ybase, txtstr, fontproperties=__font_properties__, verticalalignment='top', horizontalalignment='left')
label.set_fontsize(16.0)
def plot_codesymbol_2(self, xbase, ybase):
txtstr= self._cominfo[u'简称二']
label= self._Axes.text(xbase, ybase, txtstr, fontproperties=__font_properties__, verticalalignment='top', horizontalalignment='right')
label.set_fontsize(16.0)
def plot_companyname(self, xbase, ybase):
'''
曾用名、全名、英文名
'''
txtstr= self._cominfo[u'基本情况'][u'曾用名']
txtlist= txtstr.split('->')
if len(txtlist) > 15:
txtstr= ' -> '.join(txtlist[:5]) + ' ->\n' + ' -> '.join(txtlist[5:10]) + ' ->\n' + ' -> '.join(txtlist[10:15]) + ' ->\n' + ' -> '.join(txtlist[15:]) + '\n'
elif len(txtlist) > 10:
txtstr= ' -> '.join(txtlist[:5]) + ' ->\n' + ' -> '.join(txtlist[5:10]) + ' ->\n' + ' -> '.join(txtlist[10:]) + '\n'
elif len(txtlist) > 5:
txtstr= ' -> '.join(txtlist[:5]) + ' ->\n' + ' -> '.join(txtlist[5:]) + '\n'
else:
txtstr= ' -> '.join(txtlist) + '\n'
txtstr += self._cominfo[u'基本情况'][u'公司名称'] + '\n'
txtstr += self._cominfo[u'基本情况'][u'英文名称']
label= self._Axes.text(xbase, ybase, txtstr, fontproperties=__font_properties__, verticalalignment='top', horizontalalignment='left')
label.set_fontsize(4.5)
def plot_companylocation(self, xbase, ybase):
'''
地域、所属行业、上市日期
'''
txtstr= self._cominfo[u'公司概况'][u'区域'] + ' ' + self._cominfo[u'公司概况'][u'所属行业'] + ' ' + self._cominfo[u'发行相关'][u'上市日期']
label= self._Axes.text(xbase, ybase, txtstr, fontproperties=__font_properties__, verticalalignment='top', horizontalalignment='left')
label.set_fontsize(6.5)
def plot_mainbusiness(self, xbase, ybase):
'''
主营业务
'''
# 查找表: (<文字长度>, <每行字数>, <字体大小>, <Y轴偏移量>)
lookups= (
(20, 10, 12.0, 0.5),
(45, 15, 8.2, 0.5),
(80, 20, 6.2, 0.5),
(125, 25, 5.0, 0.5),
(180, 30, 4.1, 0.5),
(245, 35, 3.5, 0.4),
(999999, 37, 3.4, 0.4)
)
txtstr= self._cominfo[u'基本情况'][u'主营业务']
length= len(txtstr)
for sizelimit, linelimit, fontsize, yshift in lookups:
if length <= sizelimit:
txtstr= '\n'.join([txtstr[linelimit*idx : linelimit*(idx+1)] for idx in range(length//linelimit + 1)])
fsize= fontsize
ycoord= ybase - yshift
break
label= self._Axes.text(xbase, ycoord, txtstr, fontproperties=__font_properties__, verticalalignment='top', horizontalalignment='left', color='blue')
label.set_fontsize(fsize)
def plot_description(self, xbase, ybase):
'''
公司简介
'''
# 查找表: (<文字长度>, <每行字数>, <字体大小>)
lookups= (
(150, 30, 7.0),
(240, 40, 5.6),
(329, 47, 4.8),
(432, 54, 4.2),
(576, 64, 3.5),
(670, 67, 3.4),
(792, 72, 3.1),
(960, 80, 2.8),
(1222, 94, 2.4),
(1428, 102, 2.26),
(1620, 108, 2.12),
(1938, 114, 2.00),
(999999, 130, 1.75)
)
txtstr= self._cominfo[u'公司概况'][u'公司简介'] # 26 ~ 2600 字符
length= len(txtstr)
for sizelimit, linelimit, fontsize in lookups:
if length <= sizelimit:
txtstr= '\n'.join([txtstr[linelimit*idx : linelimit*(idx+1)] for idx in range(length//linelimit + 1)])
fsize= fontsize
break
label= self._Axes.text(xbase, ybase, txtstr, fontproperties=__font_properties__, verticalalignment='top', horizontalalignment='left')
label.set_fontsize(fsize)
def plot_sortinginfo(self, xbase, ybase):
'''
行业板块信息
'''
infolist= self._cominfo[u'行业板块']
for idx in range(len(infolist)//10 + 1):
txtstr= '\n'.join(infolist[10*idx : 10*(idx+1)])
if not txtstr:
break
xcoord= xbase + 25.0*idx
label= self._Axes.text(xcoord, ybase, txtstr, fontproperties=__font_properties__, verticalalignment='top', horizontalalignment='left', color='blue')
label.set_fontsize(3.4)
class SubPlot_Financial:
'''
换手率子图
'''
pass
class SubPlot_PriceBase:
'''
'''
def __init__(self, pdata, parent, xparams, name):
'''
'''
self._name= name # 派生类自己设置
self._pdata= pdata
self._parent= parent
self._expbase= __expbase__
self._xparams= xparams
self._shrink= __shrink__ if name == 'pricefs' else 1.0
# 绘图数据
quotes= pdata[u'行情']
if name == 'pricefs':
self._dates= quotes[u'日期']
self._open= quotes[u'开盘']
self._close= quotes[u'收盘']
self._high= quotes[u'最高']
self._low= quotes[u'最低']
if u'简化' in quotes: self._simple= quotes[u'简化']
# if u'换手率' in quotes: self._torate= quotes[u'换手率']
# if u'成交量' in quotes: self._volume= quotes[u'成交量']
# if u'成交额' in quotes: self._turnover= quotes[u'成交额']
if u'3日均' in quotes: self._average3= quotes[u'3日均']
if u'5日均' in quotes: self._average5= quotes[u'5日均']
if u'10日均' in quotes: self._average10= quotes[u'10日均']
if u'30日均' in quotes: self._average30= quotes[u'30日均']
if u'60日均' in quotes: self._average60= quotes[u'60日均']
if u'开盘二' in quotes:
self._open_2= quotes[u'开盘二']
self._close_2= quotes[u'收盘二']
self._high_2= quotes[u'最高二']
self._low_2= quotes[u'最低二']
if u'简化二' in quotes: self._simple_2= quotes[u'简化二']
# if u'换手率二' in quotes: self._torate_2= quotes[u'换手率二']
# if u'成交量二' in quotes: self._volume_2= quotes[u'成交量二']
# if u'成交额二' in quotes: self._turnover_2= quotes[u'成交额二']
if u'3日均二' in quotes: self._average3_2= quotes[u'3日均二']
if u'5日均二' in quotes: self._average5_2= quotes[u'5日均二']
if u'10日均二' in quotes: self._average10_2= quotes[u'10日均二']
if u'30日均二' in quotes: self._average30_2= quotes[u'30日均二']
if u'60日均二' in quotes: self._average60_2= quotes[u'60日均二']
else:
sidx, eidx= pdata[u'任务描述'][u'起始偏移'], pdata[u'任务描述'][u'结束偏移']
self._dates= quotes[u'日期'][sidx:eidx]
self._open= quotes[u'开盘'][sidx:eidx]
self._close= quotes[u'收盘'][sidx:eidx]
self._high= quotes[u'最高'][sidx:eidx]
self._low= quotes[u'最低'][sidx:eidx]
if u'简化' in quotes: self._simple= quotes[u'简化'][sidx:eidx]
# if u'换手率' in quotes: self._torate= quotes[u'换手率'][sidx:eidx]
# if u'成交量' in quotes: self._volume= quotes[u'成交量'][sidx:eidx]
# if u'成交额' in quotes: self._turnover= quotes[u'成交额'][sidx:eidx]
if u'3日均' in quotes: self._average3= quotes[u'3日均'][sidx:eidx]
if u'5日均' in quotes: self._average5= quotes[u'5日均'][sidx:eidx]
if u'10日均' in quotes: self._average10= quotes[u'10日均'][sidx:eidx]
if u'30日均' in quotes: self._average30= quotes[u'30日均'][sidx:eidx]
if u'60日均' in quotes: self._average60= quotes[u'60日均'][sidx:eidx]
if u'开盘二' in quotes:
self._open_2= quotes[u'开盘二'][sidx:eidx]
self._close_2= quotes[u'收盘二'][sidx:eidx]
self._high_2= quotes[u'最高二'][sidx:eidx]
self._low_2= quotes[u'最低二'][sidx:eidx]
if u'简化二' in quotes: self._simple_2= quotes[u'简化二'][sidx:eidx]
# if u'换手率二' in quotes: self._torate_2= quotes[u'换手率二'][sidx:eidx]
# if u'成交量二' in quotes: self._volume_2= quotes[u'成交量二'][sidx:eidx]
# if u'成交额二' in quotes: self._turnover_2= quotes[u'成交额二'][sidx:eidx]
if u'3日均二' in quotes: self._average3_2= quotes[u'3日均二'][sidx:eidx]
if u'5日均二' in quotes: self._average5_2= quotes[u'5日均二'][sidx:eidx]
if u'10日均二' in quotes: self._average10_2= quotes[u'10日均二'][sidx:eidx]
if u'30日均二' in quotes: self._average30_2= quotes[u'30日均二'][sidx:eidx]
if u'60日均二' in quotes: self._average60_2= quotes[u'60日均二'][sidx:eidx]
self._length= len(self._dates) # XXX: 由派生类设定
# 衍生数据
#==============================================================================================================
self._xindex= numpy.arange(self._length) # X 轴上的 index,一个辅助数据
self._zipoc= zip(self._open, self._close)
self._up= numpy.array( [ True if po < pc and po is not None else False for po, pc in self._zipoc] ) # 标示出该天股价日内上涨的一个序列
self._down= numpy.array( [ True if po > pc and po is not None else False for po, pc in self._zipoc] ) # 标示出该天股价日内下跌的一个序列
self._side= numpy.array( [ True if po == pc and po is not None else False for po, pc in self._zipoc] ) # 标示出该天股价日内走平的一个序列
if u'开盘二' in quotes:
self._zipoc_2= zip(self._open_2, self._close_2)
self._up_2= numpy.array( [ True if po < pc and po is not None else False for po, pc in self._zipoc_2] ) # 标示出该天股价日内上涨的一个序列
self._down_2= numpy.array( [ True if po > pc and po is not None else False for po, pc in self._zipoc_2] ) # 标示出该天股价日内下跌的一个序列
self._side_2= numpy.array( [ True if po == pc and po is not None else False for po, pc in self._zipoc_2] ) # 标示出该天股价日内走平的一个序列
self._Axes= None
self._AxisX= None
self._AxisY= None
self._xsize= 0.0
self._ysize= 0.0
self._yhighlim= 0 # Y 轴最大坐标
self._ylowlim= 0 # Y 轴最小坐标
if u'开盘二' in self._pdata[u'行情']:
self._Axes_2= None # 如果有第二个行情数据,就建立另一个 Axes 对象
self._AxisX_2= None
self._AxisY_2= None
self._yhighlim_2= 0 # Y 轴最大坐标
self._ylowlim_2= 0 # Y 轴最小坐标
self._compute_size()
self._ytickset= self._compute_ytickset() # 需放在前一句后面
def _compute_size(self):
'''
根据绘图数据 pdata 计算出本子图的尺寸,修改数据成员
'''
quotes= self._pdata[u'行情']
popen= self._open[0] # int 类型
phigh= max( [ph for ph in self._high if ph is not None] ) # 最高价
plow= min( [pl for pl in self._low if pl is not None] ) # 最低价
# Y 轴范围
if self._name == 'pricefs':
yhighlim= phigh * 1.2 # K线子图 Y 轴最大坐标
ylowlim= plow / 1.2 # K线子图 Y 轴最小坐标
else:
yhighlim= phigh * 1.1 # K线子图 Y 轴最大坐标
ylowlim= plow / 1.1 # K线子图 Y 轴最小坐标
self._yhighlim= yhighlim
self._ylowlim= ylowlim
if u'开盘二' in quotes:
popen_2= self._open_2[0] # 同上
phigh_2= max( [ph for ph in self._high_2 if ph is not None] ) # 第二个行情的最高价
phigh= max(phigh, int(phigh_2 * popen / float(popen_2))) # 以第一个行情为基准修正出的总最高价
plow_2= min( [pl for pl in self._low_2 if pl is not None] ) # 最低价
plow= min(plow, int(plow_2 * popen / float(popen_2))) # 以第一个行情为基准修正出的总最低价
if self._name == 'pricefs':
yhighlim= phigh * 1.2 # K线子图 Y 轴最大坐标
ylowlim= plow / 1.2 # K线子图 Y 轴最小坐标
else:
yhighlim= phigh * 1.1 # K线子图 Y 轴最大坐标
ylowlim= plow / 1.1 # K线子图 Y 轴最小坐标
ylowlim_2= ylowlim * popen_2 / float(popen)
yhighlim_2= yhighlim * popen_2 / float(popen)
self._yhighlim= yhighlim
self._ylowlim= ylowlim
self._yhighlim_2= yhighlim_2
self._ylowlim_2= ylowlim_2
# XXX: 价格在 Y 轴上的 “份数”。注意,虽然最高与最低价是以第一个行情为基准修正出来的,但其中包含的倍数因子对结果无影响,即:
# log(base, num1) - log(base, num2) ==
# log(base, num1/num2) ==
# log(base, k*num1/k*num2) ==
# log(base, k*num1) - log(base, k*num2)
# ,这是对数运算的性质。
xmargin= self._xparams['xmargin']
self._xsize= (self._length + xmargin*2) * self._shrink # int, 所有数据的长度,就是天数
self._ysize= (math.log(yhighlim, self._expbase) - math.log(ylowlim, self._expbase)) * self._shrink # float
def get_size(self):
return (self._xsize, self._ysize)
def get_ylimits(self):
return (self._yhighlim, self._ylowlim)
def build_axes(self, figobj, rect):
'''
初始化 self._Axes 对象
'''
# 添加 Axes 对象
#==================================================================================================================================================
if self._name == 'price' and 'torate' in self._parent._subplots:
sharex= self._parent._subplots['torate'].get_axes()
axes= figobj.add_axes(rect, axis_bgcolor='black', sharex=sharex)
elif self._name == 'pricefs' and 'toratefs' in self._parent._subplots:
sharex= self._parent._subplots['toratefs'].get_axes()
axes= figobj.add_axes(rect, axis_bgcolor='black', sharex=sharex)
else:
axes= figobj.add_axes(rect, axis_bgcolor='black')
axes.set_axisbelow(True) # 网格线放在底层
# axes.set_zorder(1) # XXX: 不顶用
# axes.patch.set_visible(False) # hide the 'canvas'
axes.set_yscale('log', basey=self._expbase) # 使用对数坐标
# 改变坐标线的颜色
#==================================================================================================================================================
for child in axes.get_children():
if isinstance(child, matplotlib.spines.Spine):
child.set_color(__color_gold__)
# 得到 X 轴 和 Y 轴 的两个 Axis 对象
#==================================================================================================================================================
xaxis= axes.get_xaxis()
yaxis= axes.get_yaxis()
# 设置两个坐标轴上的网格线
#==================================================================================================================================================
xaxis.grid(True, 'major', color='0.3', linestyle='solid', linewidth=0.2)
xaxis.grid(True, 'minor', color='0.3', linestyle='dotted', linewidth=0.1)
if self._name == 'pricefs': # 如果是小图,就不设辅助网格线
yaxis.grid(True, 'major', color='0.3', linestyle='solid', linewidth=0.1)
else:
yaxis.grid(True, 'major', color='0.3', linestyle='solid', linewidth=0.2)
yaxis.grid(True, 'minor', color='0.3', linestyle='dotted', linewidth=0.1)
yaxis.set_label_position('left')
self._Axes= axes
self._AxisX= xaxis
self._AxisY= yaxis
if u'开盘二' in self._pdata[u'行情']:
# 添加 Axes 对象。注意,设置 axes_2 而不是 axes 的网格线,从而不会跑到 axes 边框上边的做法不顶用。
#==================================================================================================================================================
axes_2= axes.twinx() # twinx is problematic, no use no more.
# XXX: 下面这三行把第一个 axes 放在上面,这样不会被第二个 axes 的图形遮盖。用 zorder 不顶用。
axes.figure.axes[-2:]= [axes_2, axes] # XXX:
axes.set_frame_on(False) # 如果不做此设定,axes_2 的内容会看不见
axes_2.set_frame_on(True)
axes_2.set_axis_bgcolor('black')
axes_2.set_axisbelow(True) # 网格线放在底层
axes_2.set_yscale('log', basey=self._expbase) # 使用对数坐标
# 改变坐标线的颜色
#==================================================================================================================================================
for child in axes_2.get_children():
if isinstance(child, matplotlib.spines.Spine):
child.set_color(__color_gold__)
# 得到 X 轴 和 Y 轴 的两个 Axis 对象
#==================================================================================================================================================
xaxis_2= axes_2.get_xaxis()
yaxis_2= axes_2.get_yaxis()
# 设置两个坐标轴上的网格线
#==================================================================================================================================================
# xaxis_2.grid(True, 'major', color='0.3', linestyle='solid', linewidth=0.2)
# xaxis_2.grid(True, 'minor', color='0.3', linestyle='dotted', linewidth=0.1)
# if self._name == 'pricefs': # 如果是小图,就不设辅助网格线
# yaxis_2.grid(True, 'major', color='0.3', linestyle='solid', linewidth=0.1)
# else:
# yaxis_2.grid(True, 'major', color='0.3', linestyle='solid', linewidth=0.2)
# yaxis_2.grid(True, 'minor', color='0.3', linestyle='dotted', linewidth=0.1)
yaxis_2.set_label_position('right')
self._Axes_2= axes_2
self._AxisX_2= xaxis_2
self._AxisY_2= yaxis_2
def set_xticks(self):
xMajorLocator= self._xparams['xMajorLocator']
xMinorLocator= self._xparams['xMinorLocator']
axes= self._Axes
xaxis= self._AxisX
# 设定 X 轴坐标的范围
#==================================================================================================================================================
xmargin= self._xparams['xmargin']
axes.set_xlim(-xmargin, self._length + xmargin)
# 先设置 label 位置,再将 X 轴上的坐标设为不可见。因为与 成交量子图 共用 X 轴
#==================================================================================================================================================
# 设定 X 轴的 Locator 和 Formatter
xaxis.set_major_locator(xMajorLocator)
# xaxis.set_major_formatter(xMajorFormatter)
xaxis.set_minor_locator(xMinorLocator)
# xaxis.set_minor_formatter(xMinorFormatter)
# 将 X 轴上的坐标设为不可见。
for mal in axes.get_xticklabels(minor=False):
mal.set_visible(False)
for mil in axes.get_xticklabels(minor=True):
mil.set_visible(False)
def set_xticks_2(self):
quotes= self._pdata[u'行情']
axes= self._Axes_2
xaxis= self._AxisX_2
xMajorLocator= self._xparams['xMajorLocator']
xMinorLocator= self._xparams['xMinorLocator']
# 设定 X 轴坐标的范围
#==================================================================================================================================================
xmargin= self._xparams['xmargin']
axes.set_xlim(-xmargin, self._length + xmargin)
# 先设置 label 位置,再将 X 轴上的坐标设为不可见。因为与 成交量子图 共用 X 轴
#==================================================================================================================================================
# 设定 X 轴的 Locator 和 Formatter
xaxis.set_major_locator(xMajorLocator)
# xaxis.set_major_formatter(xMajorFormatter)
xaxis.set_minor_locator(xMinorLocator)
# xaxis.set_minor_formatter(xMinorFormatter)
# 将 X 轴上的坐标设为不可见。
for mal in axes.get_xticklabels(minor=False):
mal.set_visible(False)
for mil in axes.get_xticklabels(minor=True):
mil.set_visible(False)
def _compute_ytickset(self):
'''
计算 Y 轴坐标点的位置,包括第二个行情
'''
quotes= self._pdata[u'行情']
expbase= self._expbase
ytickset= {}
yhighlim= self._yhighlim
ylowlim= self._ylowlim
if u'开盘二' in quotes:
yhighlim_2= self._yhighlim_2
ylowlim_2= self._ylowlim_2
if self._name == 'price' and 'pricefs' in self._parent._subplots:
tsetfs= self._parent._subplots['pricefs'].get_ytickset()
majors= tsetfs['major']
while majors[-1] < yhighlim: majors.append(majors[-1] * expbase)
while majors[0] > ylowlim: majors.insert(0, majors[0] / expbase)
minors= tsetfs['minor']
while minors[-1] < yhighlim: minors.append(minors[-1] * expbase)
while minors[0] > ylowlim: minors.insert(0, minors[0] / expbase)
ytickset['major']= [loc for loc in majors if loc > ylowlim and loc < yhighlim]
ytickset['minor']= [loc for loc in minors if loc > ylowlim and loc < yhighlim]
else:
# 主要坐标点
#----------------------------------------------------------------------------
majors= [ylowlim]
while majors[-1] < yhighlim: majors.append(majors[-1] * 1.1)
# 辅助坐标点
#----------------------------------------------------------------------------
minors= [ylowlim * 1.1**0.5]
while minors[-1] < yhighlim: minors.append(minors[-1] * 1.1)
ytickset['major']= [loc for loc in majors if loc > ylowlim and loc < yhighlim] # 注意,第一项(ylowlim)被排除掉了
ytickset['minor']= [loc for loc in minors if loc > ylowlim and loc < yhighlim]
if u'开盘二' in quotes:
popen= self._open[0] # int 类型
popen_2= self._open_2[0] # 同上
ytickset['major_2']= [loc * popen_2 / popen for loc in ytickset['major']]
ytickset['minor_2']= [loc * popen_2 / popen for loc in ytickset['minor']]
return ytickset
def get_ytickset(self):
return self._ytickset
def set_yticks(self):
'''
设置第一只行情的 Y 轴坐标,包括坐标值在图中间的显示
'''
axes= self._Axes
ylowlim= self._ylowlim
yhighlim= self._yhighlim
yaxis= self._AxisY
majorticks= self._ytickset['major']
minorticks= self._ytickset['minor']
# 设定 Y 轴坐标的范围
#==================================================================================================================================================
axes.set_ylim(ylowlim, yhighlim)
# 设定 Y 轴上的坐标
#==================================================================================================================================================
# 主要坐标点
#----------------------------------------------------------------------------
yMajorLocator= FixedLocator(numpy.array(majorticks))
# 确定 Y 轴的 MajorFormatter
def y_major_formatter(num, pos=None):
return str(round(num/1000.0, 2))
yMajorFormatter= FuncFormatter(y_major_formatter)
# 设定 X 轴的 Locator 和 Formatter
yaxis.set_major_locator(yMajorLocator)
yaxis.set_major_formatter(yMajorFormatter)
# 设定 Y 轴主要坐标点与辅助坐标点的样式
fsize= 4 if self._name == 'pricefs' else 6
for mal in axes.get_yticklabels(minor=False):
mal.set_fontsize(fsize)
# 辅助坐标点
#----------------------------------------------------------------------------
yMinorLocator= FixedLocator(numpy.array(minorticks))
# 确定 Y 轴的 MinorFormatter
def y_minor_formatter(num, pos=None):
return str(round(num/1000.0, 2))
yMinorFormatter= FuncFormatter(y_minor_formatter)
# 设定 X 轴的 Locator 和 Formatter
yaxis.set_minor_locator(yMinorLocator)
yaxis.set_minor_formatter(yMinorFormatter)
# 设定 Y 轴辅助坐标点的样式
if self._name == 'pricefs':
for mil in axes.get_yticklabels(minor=True):
mil.set_visible(False)
else:
for mil in axes.get_yticklabels(minor=True):
mil.set_fontsize(5)
mil.set_color('blue')
def set_yticks_2(self):
'''
子图右侧的 Y 轴坐标
'''
axes= self._Axes_2
yaxis= self._AxisY_2
yhighlim_2= self._yhighlim_2
ylowlim_2= self._ylowlim_2
majorticks_2= self._ytickset['major_2']
minorticks_2= self._ytickset['minor_2']
# 设定 Y 轴坐标的范围
#==================================================================================================================================================
axes.set_ylim(ylowlim_2, yhighlim_2)
# 设定 Y 轴上的坐标
#==================================================================================================================================================
# 主要坐标点
#----------------------------------------------------------------------------
yMajorLocator= FixedLocator(numpy.array(majorticks_2))
# 确定 Y 轴的 MajorFormatter
def y_major_formatter(num, pos=None):
return str(round(num/1000.0, 2))
yMajorFormatter= FuncFormatter(y_major_formatter)
# 设定 X 轴的 Locator 和 Formatter
yaxis.set_major_locator(yMajorLocator)
yaxis.set_major_formatter(yMajorFormatter)
# 设定 Y 轴主要坐标点与辅助坐标点的样式
fsize= 4 if self._name == 'pricefs' else 6
for mal in axes.get_yticklabels(minor=False):
mal.set_fontsize(fsize)
# 辅助坐标点
#----------------------------------------------------------------------------
yMinorLocator= FixedLocator(numpy.array(minorticks_2)) # XXX minor ticks 已经在上面一并设置,这里不需要了。
# 确定 Y 轴的 MinorFormatter
def y_minor_formatter(num, pos=None):
return str(round(num/1000.0, 2))
yMinorFormatter= FuncFormatter(y_minor_formatter)
# 设定 X 轴的 Locator 和 Formatter
yaxis.set_minor_locator(yMinorLocator)
yaxis.set_minor_formatter(yMinorFormatter)
# 设定 Y 轴主要坐标点与辅助坐标点的样式
if self._name == 'pricefs':
for mil in axes.get_yticklabels(minor=True):
mil.set_visible(False)
else:
for mil in axes.get_yticklabels(minor=True):
mil.set_fontsize(5)
mil.set_color('blue')
def plot(self):
'''
由派生类自己定义
'''
pass
def plot_candlestick(self):
'''
绘制 K 线
'''
axes= self._Axes
xindex= self._xindex
up= self._up
down= self._down
side= self._side
# 绘制 K 线部分
#==================================================================================================================================================
# 对开收盘价进行视觉修正
for idx, poc in enumerate(self._zipoc):
if poc[0] == poc[1] and None not in poc:
variant= int(round((poc[1]+1000)/2000.0, 0))
self._open[idx]= poc[0] - variant # 稍微偏离一点,使得在图线上不致于完全看不到
self._close[idx]= poc[1] + variant
rarray_open= numpy.array(self._open)
rarray_close= numpy.array(self._close)
rarray_high= numpy.array(self._high)
rarray_low= numpy.array(self._low)
# XXX: 如果 up, down, side 里有一个全部为 False 组成,那么 vlines() 会报错。
# XXX: 可以使用 alpha 参数调节透明度
if True in up:
axes.vlines(xindex[up], rarray_low[up], rarray_high[up], edgecolor='red', linewidth=0.6, label='_nolegend_', alpha=0.5)
axes.vlines(xindex[up], rarray_open[up], rarray_close[up], edgecolor='red', linewidth=3.0, label='_nolegend_', alpha=0.5)
if True in down:
axes.vlines(xindex[down], rarray_low[down], rarray_high[down], edgecolor='green', linewidth=0.6, label='_nolegend_', alpha=0.5)
axes.vlines(xindex[down], rarray_open[down], rarray_close[down], edgecolor='green', linewidth=3.0, label='_nolegend_', alpha=0.5)
if True in side:
axes.vlines(xindex[side], rarray_low[side], rarray_high[side], edgecolor='0.7', linewidth=0.6, label='_nolegend_', alpha=0.5)
axes.vlines(xindex[side], rarray_open[side], rarray_close[side], edgecolor='0.7', linewidth=3.0, label='_nolegend_', alpha=0.5)
def plot_simplified(self):
'''
绘制简化行情
'''
xindex= self._xindex
axes= self._Axes
rarray_simple= numpy.array(self._simple)
axes.plot(xindex, rarray_simple, 'o-', color='white', linewidth=0.3, label='simple', \
markersize=0.3, markeredgecolor='white', markeredgewidth=0.1, alpha=0.3) # 简化行情
def plot_average(self):
'''
绘制均线
'''
# 绘制均线部分
#==================================================================================================================================================
quotes= self._pdata[u'行情']
xindex= self._xindex
axes= self._Axes
if self._name == 'pricefs':
widthw= 0.1
widthn= 0.07
mksize= 0.07
mkwidth= 0.1
alpha= 1.0
else:
widthw= 0.2
widthn= 0.1
mksize= 0.3
mkwidth= 0.1
alpha= 1.0
if u'3日均' in quotes:
rarray_3dayave= numpy.array(self._average3)
axes.plot(xindex, rarray_3dayave, 'o-', color='white', linewidth=widthw, label='avg_3', \
markersize=mksize, markeredgecolor='white', markeredgewidth=mkwidth, alpha=alpha) # 3日均线
if u'5日均' in quotes:
rarray_5dayave= numpy.array(self._average5)
axes.plot(xindex, rarray_5dayave, 'o-', color='white', linewidth=widthn, label='avg_5', \
markersize=mksize, markeredgecolor='white', markeredgewidth=mkwidth, alpha=alpha) # 5日均线
if u'10日均' in quotes:
rarray_10dayave= numpy.array(self._average10)
axes.plot(xindex, rarray_10dayave, 'o-', color='yellow', linewidth=widthn, label='avg_10', \
markersize=mksize, markeredgecolor='yellow', markeredgewidth=mkwidth, alpha=alpha) # 10日均线
if u'30日均' in quotes:
rarray_30dayave= numpy.array(self._average30)
axes.plot(xindex, rarray_30dayave, 'o-', color='cyan', linewidth=widthn, label='avg_30', \
markersize=mksize, markeredgecolor='cyan', markeredgewidth=mkwidth, alpha=alpha) # 30日均线
if u'60日均' in quotes:
rarray_60dayave= numpy.array(self._average60)
axes.plot(xindex, rarray_60dayave, 'o-', color='magenta', linewidth=widthn, label='avg_60', \
markersize=mksize, markeredgecolor='magenta', markeredgewidth=mkwidth, alpha=alpha) # 60日均线
def plot_adjustnotes(self):
'''
绘制复权提示
'''
quotes= self._pdata[u'行情']
firstday= self._dates[0]
lastday= self._dates[-1]
ylowlim= self._ylowlim
yhighlim= self._yhighlim
axes= self._Axes
# 使用 annotate() 进行标注。不用了,留作纪念。
#===========================================================================================================================
# adjdict= dict(quotes[u'相对复权']) # key 是 date string,value 是相对复权因子(float 类型)
# el= Ellipse((2, -1), 0.5, 0.5)
# for idx, dstr in enumerate(self._dates):
# if dstr in adjdict:
# axes.plot([idx, idx], [ylowlim, yhighlim], '-', color='purple', linewidth=0.1)
# axes.annotate(u'复权\n' + str(adjdict[dstr]),
# fontproperties=__font_properties__,
# xy=(idx, yhighlim/1.1), xycoords='data',
# xytext=(10, 5), textcoords='offset points', size=5, verticalalignment="center",
# bbox=dict(boxstyle="round", facecolor='white', edgecolor='purple'),
# arrowprops=dict(arrowstyle="wedge,tail_width=1.",
# facecolor='white', edgecolor='purple',
# patchA=None,
# patchB=el,
# relpos=(0.2, 0.8),
# connectionstyle="arc3,rad=-0.1"),
# alpha=0.5
# )
adjrecs= [rec for rec in quotes[u'相对复权'] if rec[0] >= firstday and rec[0] <= lastday]
if self._name == 'pricefs':
fsize= 3.0
ycoord= yhighlim/1.3
alpha= 1.0
else:
fsize= 5.0
ycoord= yhighlim/1.12
alpha= 1.0
for dstr, afac in adjrecs:
idx= self._dates.index(dstr)
axes.plot([idx, idx], [ylowlim, yhighlim], '-', color='purple', linewidth=0.1)
label= axes.text( \
idx, ycoord, \
u'复权 ' + str(afac) + u'\n' + dstr, \
fontproperties=__font_properties__, \
horizontalalignment='left', \
verticalalignment='top', \
color='purple', \
alpha=alpha
)
label.set_fontsize(fsize)
def plot_capchangenotes(self):
'''
绘制流通股本变更提示
注意两个问题:
1. 流通股本变更提示中的日期可能不是交易日期
2. 流通股本变更提示涵盖个股的所有历史,有些内容可能在绘图目标区间以外
'''
pdata= self._pdata
axes= self._Axes
ylowlim= self._ylowlim
yhighlim= self._yhighlim
firstday= self._dates[0]
lastday= self._dates[-1]
# 把目标区间之外的记录滤掉
changerecs= [rec for rec in pdata[u'公司信息'][u'流通股变更'] if rec[u'变更日期'] >= firstday and rec[u'变更日期'] <= lastday]
# 使用 annotate() 进行标注。不用了,留作纪念。
#===========================================================================================================================
# el= Ellipse((2, -1), 0.5, 0.5)
# for datestr, chrate in changerecs:
# dstr= [ds for ds in self._dates if ds >= datestr][0]
# idx= self._dates.index(dstr)
# axes.plot([idx, idx], [ylowlim, yhighlim], '-', color='yellow', linewidth=0.1)
# axes.annotate(u'流通股\n' + str(chrate),
# fontproperties=__font_properties__,
# xy=(idx, yhighlim/1.1), xycoords='data',
# xytext=(10, 5), textcoords='offset points', size=5, verticalalignment="center",
# bbox=dict(boxstyle="round", facecolor='white', edgecolor='yellow'),
# arrowprops=dict(arrowstyle="wedge,tail_width=1.",
# facecolor='white', edgecolor='yellow',
# patchA=None,
# patchB=el,
# relpos=(0.2, 0.8),
# connectionstyle="arc3,rad=-0.1"),
# alpha=0.5
# )
if self._name == 'pricefs':
fsize= 3.0
ycoord= yhighlim/1.1
alpha= 1.0
else:
fsize= 5.0
ycoord= yhighlim/1.05
alpha= 0.8
for record in changerecs:
datestr= record[u'变更日期']
chrate= record[u'变更比']
dstr= [ds for ds in self._dates if ds >= datestr][0]
idx= self._dates.index(dstr)
axes.plot([idx, idx], [ylowlim, yhighlim], '-', color='yellow', linewidth=0.1)
label= axes.text( \
idx, ycoord, \
u'流通股 ' + str(chrate) + u'\n' + datestr, \
fontproperties=__font_properties__, \
horizontalalignment='left', \
verticalalignment='top', \
color='yellow', \
alpha=alpha
)
label.set_fontsize(fsize)
def plot_candlestick_2(self):
'''
绘制第二条 K 线
'''
xindex= self._xindex
axes= self._Axes_2
up= self._up_2
down= self._down_2
side= self._side_2
# 对开收盘价进行视觉修正
for idx, poc in enumerate( self._zipoc_2 ):
if poc[0] == poc[1] and None not in poc:
self._open_2[idx]= poc[0] - 5 # 稍微偏离一点,使得在图线上不致于完全看不到
self._close_2[idx]= poc[1] + 5
rarray_open= numpy.array(self._open_2)
rarray_close= numpy.array(self._close_2)
rarray_high= numpy.array(self._high_2)
rarray_low= numpy.array(self._low_2)
# XXX: 如果 up, down, side 里有一个全部为 False 组成,那么 vlines() 会报错。
# XXX: 可以使用 alpha 参数调节透明度
if True in up:
axes.vlines(xindex[up], rarray_low[up], rarray_high[up], edgecolor='0.7', linewidth=0.6, label='_nolegend_', alpha=0.5)
axes.vlines(xindex[up], rarray_open[up], rarray_close[up], edgecolor='0.7', linewidth=3.0, label='_nolegend_', alpha=0.5)
if True in down:
axes.vlines(xindex[down], rarray_low[down], rarray_high[down], edgecolor='0.3', linewidth=0.6, label='_nolegend_', alpha=0.5)
axes.vlines(xindex[down], rarray_open[down], rarray_close[down], edgecolor='0.3', linewidth=3.0, label='_nolegend_', alpha=0.5)
if True in side:
axes.vlines(xindex[side], rarray_low[side], rarray_high[side], edgecolor='1.0', linewidth=0.6, label='_nolegend_', alpha=1.0)
axes.vlines(xindex[side], rarray_open[side], rarray_close[side], edgecolor='1.0', linewidth=3.0, label='_nolegend_', alpha=1.0)
def plot_capitalinfo(self):
'''
绘制行情首日和尾日的股本信息
'''
def find_biggestblank(didx):
'''
找出 X 轴某个位置图中最大的空隙
'''
pstart= self._open[0]
ptarget= self._open[didx]
compseq= [yhighlim, ptarget, ylowlim]
if u'开盘二' in quotes:
pstart_2= self._open_2[0]
ptarget_2= self._open_2[didx]
padjust= int(ptarget_2 * pstart / float(pstart_2))
compseq.append(padjust)
compseq.sort(reverse=True) # 图中的三个或四个关键点,高到底排序
diff, hi, low= max([(math.log(compseq[idx]/float(compseq[idx+1]), expbase), compseq[idx], compseq[idx+1]) for idx in range(len(compseq)-1)])
# XXX: for debugging
# print(compseq)
# print([diff, hi, low])
return (hi*low)**0.5 # 相乘再开平方,在 log 坐标系里看起来就是在中间位置。
def repr_int(intnum):
'''
123456789 --> '1,2345,6789'
'''
if type(intnum) not in (int, long): return str(intnum)
if intnum == 0: return '0'
if intnum < 0:
intnum= -intnum
isminus= True
else:
isminus= False
intstr= str(intnum)
intstr= '0'*((4-len(intstr)%4)%4) + intstr
intlist= [intstr[i:i+4] for i in range(0, len(intstr), 4)]
intlist[0]= intlist[0].lstrip('0')
return ('-' + ','.join(intlist)) if isminus else ','.join(intlist)
pdata= self._pdata
quotes= pdata[u'行情']
ylowlim= self._ylowlim
yhighlim= self._yhighlim
length= self._length
expbase= self._expbase
capinfo= pdata[u'公司信息'][u'股本变更记录']
axes= self._Axes
firstday, lastday= self._dates[0], self._dates[-1]
fsize= 5.0 if self._name == 'price' else 3.0
# 首日总股本与流通股信息
#====================================================================================================================================
chunk= [rec for rec in capinfo if rec[u'变更日期'] <= firstday]
if chunk:
allshares= repr_int(chunk[-1][u'总股本'])
circulating= repr_int(chunk[-1][u'流通股'])
else:
allshares= 'None'
circulating= 'None'
infostr= u'总股本: ' + allshares + '\n' + u'流通股: ' + circulating
label= axes.text(0, find_biggestblank(didx=0), infostr, fontproperties=__font_properties__, color='0.7')
label.set_fontsize(fsize)
# label.set_zorder(0) # XXX: 放在底层
# 尾日总股本与流通股信息
#====================================================================================================================================
chunk= [rec for rec in capinfo if rec[u'变更日期'] <= lastday]
if chunk:
allshares= repr_int(chunk[-1][u'总股本'])
circulating= repr_int(chunk[-1][u'流通股'])
else:
allshares= 'None'
circulating= 'None'
infostr= u'总股本: ' + allshares + '\n' + u'流通股: ' + circulating
label= axes.text(length-1, find_biggestblank(didx=length-1), infostr, fontproperties=__font_properties__, horizontalalignment='right', color='0.7')
label.set_fontsize(fsize)
# label.set_zorder(0) # XXX: 放在底层
def plot_usernotes(self):
'''
'''
pdata= self._pdata
quotes= pdata[u'行情']
sidx= self._pdata[u'任务描述'][u'起始偏移']
eidx= self._pdata[u'任务描述'][u'结束偏移']
axes= self._Axes
usernotes= pdata[u'用户标记']
alldates= quotes[u'日期'][sidx:eidx]
lowprices= quotes[u'最低'][sidx:eidx]
expbase= self._expbase
# 绘制短线买点标记
for note in usernotes:
if note[u'类型'] == u'筛选结果':
dstr= note[u'日期']
# 日期不在绘图区间范围内,忽略
if dstr not in alldates:
continue
# 决定箭头的颜色
result= note[u'结果']
color= 'magenta' if result == u'上涨' else 'cyan' if result == u'下跌' else 'white'
# 箭头的起始位置
idx= alldates.index(dstr)
xpos= idx
ypos= lowprices[idx] / expbase
# 箭头的长度
dx= 0.0
dy= ypos * (expbase-1) * 0.9
# 头端的长度
head_length= dy * 0.2
# 绘制箭头
arrow_params={'length_includes_head':True, 'shape':'full', 'head_starts_at_zero':False}
axes.arrow(xpos, ypos, dx, dy, facecolor=color, edgecolor=color, linewidth=0.7, head_width=0.6, head_length=head_length, **arrow_params)
def plot_vlines(self):
xindex= self._xindex
up= self._up
down= self._down
side= self._side
axes= self._Axes
lwidth= 2.4 * self._shrink
# 绘制 K 线部分
#==================================================================================================================================================
rarray_high= numpy.array(self._high)
rarray_low= numpy.array(self._low)
# XXX: 如果 up, down, side 里有一个全部为 False 组成,那么 vlines() 会报错。
# XXX: 可以使用 alpha 参数调节透明度
if True in up:
axes.vlines(xindex[up], rarray_low[up], rarray_high[up], edgecolor='red', linewidth=lwidth, label='_nolegend_', alpha=0.5)
if True in down:
axes.vlines(xindex[down], rarray_low[down], rarray_high[down], edgecolor='green', linewidth=lwidth, label='_nolegend_', alpha=0.5)
if True in side:
axes.vlines(xindex[side], rarray_low[side], rarray_high[side], edgecolor='0.7', linewidth=lwidth, label='_nolegend_', alpha=0.5)
def plot_vlines_2(self):
xindex= self._xindex
axes= self._Axes_2
up= self._up_2
down= self._down_2
side= self._side_2
lwidth= 2.4 * self._shrink
rarray_high= numpy.array(self._high_2)
rarray_low= numpy.array(self._low_2)
# XXX: 如果 up, down, side 里有一个全部为 False 组成,那么 vlines() 会报错。
# XXX: 可以使用 alpha 参数调节透明度
if True in up:
axes.vlines(xindex[up], rarray_low[up], rarray_high[up], edgecolor='0.7', linewidth=lwidth, label='_nolegend_', alpha=0.5)
if True in down:
axes.vlines(xindex[down], rarray_low[down], rarray_high[down], edgecolor='0.3', linewidth=lwidth, label='_nolegend_', alpha=0.5)
if True in side:
axes.vlines(xindex[side], rarray_low[side], rarray_high[side], edgecolor='1.0', linewidth=lwidth, label='_nolegend_', alpha=1.0)
def plot_datenotes(self):
'''
内部的日期注释,由派生类定义
'''
pass
def plot_pricenotes(self):
'''
内部的价格注释,由派生类定义
'''
pass
class SubPlot_PriceFullSpan(SubPlot_PriceBase):
'''
'''
def plot(self):
'''
绘图
'''
pdata= self._pdata
# if u'简化' in pdata:
# self.plot_simplified()
# else:
# self.plot_candlestick()
self.plot_vlines()
self.plot_average()
if u'相对复权' in pdata[u'行情']:
self.plot_adjustnotes()
if u'流通股变更' in pdata[u'公司信息']:
self.plot_capchangenotes()
if u'股本变更记录' in pdata[u'公司信息']:
self.plot_capitalinfo()
self.set_xticks()
self.set_yticks()
if u'开盘二' in pdata[u'行情']:
self.plot_vlines_2()
self.set_xticks_2()
self.set_yticks_2()
self.plot_datenotes()
if 'price' in self._parent._subplots:
self.plot_windowspan()
def plot_datenotes(self):
'''
日期在图中间的显示
'''
ylowlim= self._ylowlim
axes= self._Axes
sdindex= self._xparams['sdindex']
mdindex= self._xparams['mdindex']
# 每季度第一个交易日
for ix in sdindex:
newlab= axes.text(ix - (1/self._shrink), ylowlim*1.03, self._dates[ix])
newlab.set_font_properties(__font_properties__)
newlab.set_color('0.3')
newlab.set_fontsize(4)
newlab.set_rotation('45')
# newlab.set_rotation('vertical')
# newlab.set_horizontalalignment('left')
# newlab.set_verticalalignment('bottom')
# newlab.set_verticalalignment('center')
newlab.set_zorder(0) # XXX: 放在底层
# 每月第一个交易日
for ix in mdindex:
newlab= axes.text(ix - (0.8/self._shrink), ylowlim * 1.03, self._dates[ix])
newlab.set_font_properties(__font_properties__)
newlab.set_color('0.3')
newlab.set_fontsize(3)
newlab.set_rotation('45')
# newlab.set_rotation('vertical')
# newlab.set_horizontalalignment('left')
# newlab.set_verticalalignment('top') # 不行
# newlab.set_verticalalignment('center')
# newlab.set_verticalalignment('bottom')
newlab.set_zorder(0) # XXX: 放在底层
def plot_windowspan(self):
axes= self._Axes
jobstat= self._pdata[u'任务描述']
sindex, eindex= jobstat[u'起始偏移'], jobstat[u'结束偏移']
hibdry, lobdry= self._parent._subplots['price'].get_ylimits()
xcoord= sindex - 1
width= eindex - sindex + 1
ycoord= lobdry
height= hibdry - lobdry
window= matplotlib.patches.Rectangle((xcoord, ycoord), width, height, fill=False, edgecolor=__color_lightblue__, linewidth=0.3, alpha=0.7)
window.set_zorder(-1) # 放在底层
axes.add_patch(window)
class SubPlot_Price(SubPlot_PriceBase):
'''
'''
def plot(self):
'''
绘图
'''
pdata= self._pdata
# if u'简化' in pdata:
# self.plot_simplified()
# else:
# self.plot_candlestick()
self.plot_candlestick()
self.plot_average()
if u'相对复权' in pdata[u'行情']:
self.plot_adjustnotes()
if u'流通股变更' in pdata[u'公司信息']:
self.plot_capchangenotes()
if u'股本变更记录' in pdata[u'公司信息']:
self.plot_capitalinfo()
if u'用户标记' in pdata:
self.plot_usernotes()
self.set_xticks()
self.set_yticks()
if u'开盘二' in pdata[u'行情']:
self.plot_candlestick_2()
self.set_xticks_2()
self.set_yticks_2()
self.plot_pricenotes()
self.plot_datenotes()
def plot_datenotes(self):
'''
日期在图中间的显示
'''
ylowlim= self._ylowlim
yhighlim= self._yhighlim
axes= self._Axes
mdindex= self._xparams['mdindex']
wdindex= self._xparams['wdindex']
# 每月第一个交易日
for iy in [ylowlim*1.1, yhighlim/1.21]:
for ix in mdindex:
newlab= axes.text(ix-1, iy, self._dates[ix])
newlab.set_font_properties(__font_properties__)
newlab.set_color('0.3')
newlab.set_fontsize(4)
newlab.set_rotation('vertical')
# newlab.set_horizontalalignment('left')
# newlab.set_verticalalignment('bottom')
# newlab.set_verticalalignment('center')
newlab.set_zorder(0) # XXX: 放在底层
# 每周第一个交易日,根据这个可以推算出全部确切的日期。
# for iy in minorticks[0:-1:6]:
for iy in [ylowlim*1.01, yhighlim/1.09]:
for ix in wdindex:
newlab= axes.text(ix-0.8, iy, self._dates[ix])
newlab.set_font_properties(__font_properties__)
newlab.set_color('0.3')
newlab.set_fontsize(3)
newlab.set_rotation('vertical')
# newlab.set_horizontalalignment('left')
# newlab.set_verticalalignment('top') # 不行
# newlab.set_verticalalignment('center')
# newlab.set_verticalalignment('bottom')
newlab.set_zorder(0) # XXX: 放在底层
def plot_pricenotes(self):
# 价格数值在图中间的显示
#==================================================================================================================================================
quotes= self._pdata[u'行情']
axes= self._Axes
majorticks= self._ytickset['major']
minorticks= self._ytickset['minor']
mdindex= self._xparams['mdindex']
def price_note(num):
return str(round(num/1000.0, 2))
if u'开盘二' in quotes:
majorticks_2= self._ytickset['major_2']
minorticks_2= self._ytickset['minor_2']
for iy, iy2 in zip(sorted(majorticks[:-1] + minorticks[1:-1]), sorted(majorticks_2[:-1] + minorticks_2[1:-1])):
for ix in mdindex[1:-1:3]:
newlab= axes.text(ix+6, iy*1.001, price_note(iy) + ' / ' + price_note(iy2))
newlab.set_font_properties(__font_properties__)
newlab.set_color('0.3')
newlab.set_fontsize(3)
newlab.set_zorder(0) # XXX: 放在底层
else:
for iy in sorted(majorticks[:-1] + minorticks[1:-1]):
for ix in mdindex[1:-1:3]:
newlab= axes.text(ix+9, iy*1.001, price_note(iy))
newlab.set_font_properties(__font_properties__)
newlab.set_color('0.3')
newlab.set_fontsize(3)
newlab.set_zorder(0) # XXX: 放在底层
class SubPlot_TORateBase:
'''
换手率子图
'''
def __init__(self, pdata, parent, xparams, name):
self._name= name
self._pdata= pdata
self._parent= parent
self._xparams= xparams
self._shrink= __shrink__ if name == 'toratefs' else 1.0
self._tostep= 0 # 每一格代表的换手率数值
self._yrange= 0
self._xsize= 0 # int
self._ysize= 0 # int
self._Axes= None
self._AxisX= None
self._AxisY= None
if u'换手率二' in pdata[u'行情']:
self._Axes_2= None
self._AxisX_2= None
self._AxisY_2= None
self._tostep_2= 0
# 绘图数据
quotes= pdata[u'行情']
if name == 'toratefs':
self._dates= quotes[u'日期']
self._open= quotes[u'开盘']
self._close= quotes[u'收盘']
self._high= quotes[u'最高']
self._low= quotes[u'最低']
if u'简化' in quotes: self._simple= quotes[u'简化']
if u'换手率' in quotes: self._torate= quotes[u'换手率']
if u'成交量' in quotes: self._volume= quotes[u'成交量']
if u'成交额' in quotes: self._turnover= quotes[u'成交额']
if u'开盘二' in quotes:
self._open_2= quotes[u'开盘二']
self._close_2= quotes[u'收盘二']
self._high_2= quotes[u'最高二']
self._low_2= quotes[u'最低二']
if u'简化二' in quotes: self._simple_2= quotes[u'简化二']
if u'换手率二' in quotes: self._torate_2= quotes[u'换手率二']
if u'成交量二' in quotes: self._volume_2= quotes[u'成交量二']
if u'成交额二' in quotes: self._turnover_2= quotes[u'成交额二']
else:
sidx, eidx= pdata[u'任务描述'][u'起始偏移'], pdata[u'任务描述'][u'结束偏移']
self._dates= quotes[u'日期'][sidx:eidx]
self._open= quotes[u'开盘'][sidx:eidx]
self._close= quotes[u'收盘'][sidx:eidx]
self._high= quotes[u'最高'][sidx:eidx]
self._low= quotes[u'最低'][sidx:eidx]
if u'简化' in quotes: self._simple= quotes[u'简化'][sidx:eidx]
if u'换手率' in quotes: self._torate= quotes[u'换手率'][sidx:eidx]
if u'成交量' in quotes: self._volume= quotes[u'成交量'][sidx:eidx]
if u'成交额' in quotes: self._turnover= quotes[u'成交额'][sidx:eidx]
if u'开盘二' in quotes:
self._open_2= quotes[u'开盘二'][sidx:eidx]
self._close_2= quotes[u'收盘二'][sidx:eidx]
self._high_2= quotes[u'最高二'][sidx:eidx]
self._low_2= quotes[u'最低二'][sidx:eidx]
if u'简化二' in quotes: self._simple_2= quotes[u'简化二'][sidx:eidx]
if u'换手率二' in quotes: self._torate_2= quotes[u'换手率二'][sidx:eidx]
if u'成交量二' in quotes: self._volume_2= quotes[u'成交量二'][sidx:eidx]
if u'成交额二' in quotes: self._turnover_2= quotes[u'成交额二'][sidx:eidx]
# 衍生数据
#==============================================================================================================
self._length= len(self._dates)
self._xindex= numpy.arange(self._length) # X 轴上的 index,一个辅助数据
self._zipoc= zip(self._open, self._close)
self._up= numpy.array( [ True if po < pc and po is not None else False for po, pc in self._zipoc] ) # 标示出该天股价日内上涨的一个序列
self._down= numpy.array( [ True if po > pc and po is not None else False for po, pc in self._zipoc] ) # 标示出该天股价日内下跌的一个序列
self._side= numpy.array( [ True if po == pc and po is not None else False for po, pc in self._zipoc] ) # 标示出该天股价日内走平的一个序列
if u'开盘二' in quotes:
self._zipoc_2= zip(self._open_2, self._close_2)
self._up_2= numpy.array( [ True if po < pc and po is not None else False for po, pc in self._zipoc_2] ) # 标示出该天股价日内上涨的一个序列
self._down_2= numpy.array( [ True if po > pc and po is not None else False for po, pc in self._zipoc_2] ) # 标示出该天股价日内下跌的一个序列
self._side_2= numpy.array( [ True if po == pc and po is not None else False for po, pc in self._zipoc_2] ) # 标示出该天股价日内走平的一个序列
self._compute_size()
def _compute_size(self):
'''
根据 pdata 计算自身尺寸
'''
def _compute_step(maxto):
'''
maxto 是 换手率 最大值。返回每格单位(最小 500, 代表 0.5%)以及格数
'''
for i in range(9):
if maxto > (4 * 500 * (2**i)): # 换手率最大是 100000, 代表 100%
continue
else:
tostep= 500 * (2**i)
tosize= int(round((maxto + tostep/2.0 - 1) / float(tostep), 0))
break
return (tostep, tosize)
quotes= self._pdata[u'行情']
xmargin= self._xparams['xmargin']
self._xsize= (self._length + xmargin*2) * self._shrink
maxto= max(self._torate)
self._tostep, self._yrange= _compute_step(maxto=maxto)
if u'换手率二' in quotes:
maxto_2= max(self._torate_2)
self._tostep_2, yrange_2= _compute_step(maxto=maxto_2)
self._yrange= max(self._yrange, yrange_2) # 成交量部分在 Y 轴所占的 “份数”
self._ysize= self._yrange * self._shrink
def get_size(self):
return (self._xsize, self._ysize)
def build_axes(self, figobj, rect):
# 第一只:添加 Axes 对象
#==================================================================================================================================================
axes= figobj.add_axes(rect, axis_bgcolor='black')
axes.set_axis_bgcolor('black')
axes.set_axisbelow(True) # 网格线放在底层
# 第一只:改变坐标线的颜色
#==================================================================================================================================================
for child in axes.get_children():
if isinstance(child, matplotlib.spines.Spine):
child.set_color(__color_gold__)
# child.set_zorder(3) # XXX: 放在上层,好像没什么用。
# 得到 X 轴 和 Y 轴 的两个 Axis 对象
#==================================================================================================================================================
xaxis= axes.get_xaxis()
yaxis= axes.get_yaxis()
# 设置两个坐标轴上的 grid
#==================================================================================================================================================
xaxis.grid(True, 'major', color='0.3', linestyle='solid', linewidth=0.2)
xaxis.grid(True, 'minor', color='0.3', linestyle='dotted', linewidth=0.1)
yaxis.grid(True, 'major', color='0.3', linestyle='solid', linewidth=0.2)
yaxis.grid(True, 'minor', color='0.3', linestyle='solid', linewidth=0.1)
self._Axes= axes
self._AxisX= xaxis
self._AxisY= yaxis
if u'换手率二' in self._pdata[u'行情']:
# 添加 Axes 对象
#==================================================================================================================================================
axes_2= axes.twinx()
# XXX: 下面这三行把第一个 axes 放在上面,这样不会被第二个 axes 的图形遮盖。用 zorder 不顶用。
axes.figure.axes[-2:]= [axes_2, axes] # XXX: 把第一个 axes 放在上面,用 zorder 不顶用。
axes.set_frame_on(False) # 如果不做此设定,axes_2 的内容会看不见
axes_2.set_frame_on(True)
axes_2.set_axis_bgcolor('black')
axes_2.set_axisbelow(True) # 网格线放在底层
# 改变坐标线的颜色
#==================================================================================================================================================
for child in axes_2.get_children():
if isinstance(child, matplotlib.spines.Spine):
child.set_color(__color_gold__)
# 得到 X 轴 和 Y 轴 的两个 Axis 对象
#==================================================================================================================================================
xaxis_2= axes_2.get_xaxis()
yaxis_2= axes_2.get_yaxis()
# 设置网格线
#==================================================================================================================================================
# xaxis_2.grid(True, 'major', color='0.3', linestyle='solid', linewidth=0.2)
# xaxis_2.grid(True, 'minor', color='0.3', linestyle='dotted', linewidth=0.1)
# yaxis_2.grid(True, 'major', color='0.3', linestyle='solid', linewidth=0.2)
# yaxis_2.grid(True, 'minor', color='0.3', linestyle='dotted', linewidth=0.1)
self._Axes_2= axes_2
self._AxisX_2= xaxis_2
self._AxisY_2= yaxis_2
def get_axes(self):
return self._Axes
def plot(self):
'''
绘制换手率图形
'''
self.plot_torate()
self.set_xticks()
self.set_yticks()
if u'换手率二' in self._pdata[u'行情']:
self.plot_torate_2()
self.set_xticks_2()
self.set_yticks_2()
def plot_torate(self):
'''
绘制换手率
'''
xindex= self._xindex
stopset= self._xparams['mdindex'] if self._name == 'torate' else self._xparams['sdindex']
axes= self._Axes
up= self._up
down= self._down
side= self._side
rarray_to= numpy.array(self._torate)
tozeros= numpy.zeros(self._length) # 辅助数据
lwidth= 3.0 if self._name == 'torate' else 2.4 * self._shrink
# XXX: 如果 up/down/side 各项全部为 False,那么 vlines() 会报错。
if True in up:
axes.vlines(xindex[up], tozeros[up], rarray_to[up], edgecolor='red', linewidth=lwidth, label='_nolegend_', alpha=0.5)
if True in down:
axes.vlines(xindex[down], tozeros[down], rarray_to[down], edgecolor='green', linewidth=lwidth, label='_nolegend_', alpha=0.5)
if True in side:
axes.vlines(xindex[side], tozeros[side], rarray_to[side], edgecolor='0.7', linewidth=lwidth, label='_nolegend_', alpha=0.5)
# 绘制平均换手率(直线)
toeffect= [num for num in self._torate if num is not None]
toaverage= sum(toeffect) / float(len(toeffect))
axes.plot([-1, self._length], [toaverage, toaverage], '-', color='yellow', linewidth=0.2, alpha=0.7)
# 换手率数值在图中间的显示
#==================================================================================================================================================
for ix in stopset[2:-1:3]:
newlab= axes.text(ix+8, toaverage, str(round(toaverage/1000.0, 2)) + '%')
newlab.set_font_properties(__font_properties__)
newlab.set_color('yellow')
newlab.set_fontsize(3)
# newlab.set_zorder(0) # XXX: 放在底层
# newlab.set_verticalalignment('center')
def plot_torate_2(self):
'''
绘制第二条换手率柱状图
'''
quotes= self._pdata[u'行情']
xindex= self._xindex
axes= self._Axes_2
up= self._up_2
down= self._down_2
side= self._side_2
rarray_to= numpy.array(self._torate_2)
tozeros= numpy.zeros(self._length) # 辅助数据
lwidth, alpha= (0.7, 0.5) if self._name == 'torate' else (0.3, 0.7)
# XXX: 如果 up/down/side 各项全部为 False,那么 vlines() 会报错。
if True in up:
axes.vlines(xindex[up], tozeros[up], rarray_to[up], edgecolor='0.7', linewidth=lwidth, label='_nolegend_', alpha=alpha)
if True in down:
axes.vlines(xindex[down], tozeros[down], rarray_to[down], edgecolor='0.3', linewidth=lwidth, label='_nolegend_', alpha=alpha)
if True in side:
axes.vlines(xindex[side], tozeros[side], rarray_to[side], edgecolor='0.7', linewidth=lwidth, label='_nolegend_', alpha=1.0)
def set_xticks(self):
'''
X 轴坐标
'''
length= self._length
xmargin= self._xparams['xmargin']
axes= self._Axes
xaxis= self._AxisX
# xaxis.set_tick_params(which='both', direction='out') # XXX: 坐标点设到外面去,也可以用 Axes.tick_params(),好像 matplotlib 1.0.1 才有
# 设定 X 轴坐标的范围
#==================================================================================================================================================
axes.set_xlim(-xmargin, length + xmargin)
xMajorLocator= self._xparams['xMajorLocator']
xMinorLocator= self._xparams['xMinorLocator']
xMajorFormatter= self._xparams['xMajorFormatter']
xMinorFormatter= self._xparams['xMinorFormatter']
# 设定 X 轴的 Locator 和 Formatter
xaxis.set_major_locator(xMajorLocator)
xaxis.set_minor_locator(xMinorLocator)
if self._name == 'torate':
xaxis.set_major_formatter(xMajorFormatter)
xaxis.set_minor_formatter(xMinorFormatter)
# 设定 X 轴主要坐标点与辅助坐标点的样式
for mal in axes.get_xticklabels(minor=False):
mal.set_fontsize(4)
mal.set_horizontalalignment('right')
mal.set_rotation('45')
for mil in axes.get_xticklabels(minor=True):
mil.set_fontsize(4)
mil.set_color('blue')
mil.set_horizontalalignment('right')
mil.set_rotation('45')
else:
# 设为不可见
for mal in axes.get_xticklabels(minor=False):
mal.set_visible(False)
for mil in axes.get_xticklabels(minor=True):
mil.set_visible(False)
def set_xticks_2(self):
length= self._length
xmargin= self._xparams['xmargin']
axes= self._Axes_2
xaxis= self._AxisX_2
# xaxis.set_tick_params(which='both', direction='out') # XXX: 坐标点设到外面去,也可以用 Axes.tick_params(),好像 matplotlib 1.0.1 才有
# 设定 X 轴坐标的范围
#==================================================================================================================================================
axes.set_xlim(-xmargin, length + xmargin)
xMajorLocator= self._xparams['xMajorLocator']
xMinorLocator= self._xparams['xMinorLocator']
# 设定 X 轴的 Locator 和 Formatter
xaxis.set_major_locator(xMajorLocator)
xaxis.set_minor_locator(xMinorLocator)
# 设为不可见
for mal in axes.get_xticklabels(minor=False):
mal.set_visible(False)
for mil in axes.get_xticklabels(minor=True):
mil.set_visible(False)
def set_yticks(self):
'''
设置 Y 轴坐标
'''
axes= self._Axes
yaxis= self._AxisY
tostep= self._tostep
yrange= self._yrange
stopset= self._xparams['mdindex'] if self._name == 'torate' else self._xparams['sdindex']
# 设定换手率 Y 轴坐标的范围
#==================================================================================================================================================
axes.set_ylim(0, tostep*yrange)
# 主要坐标点
#==================================================================================================================================================
majorticks= [tostep*i for i in range(yrange)]
yMajorLocator= FixedLocator(numpy.array(majorticks))
# 确定 Y 轴的 MajorFormatter
def y_major_formatter(num, pos=None):
return str(round(num/1000.0, 2)) + '%'
yMajorFormatter= FuncFormatter(y_major_formatter)
# 确定 Y 轴的 MinorFormatter
yMinorFormatter= NullFormatter()
# 第一只:设定 X 轴的 Locator 和 Formatter
yaxis.set_major_locator(yMajorLocator)
yaxis.set_major_formatter(yMajorFormatter)
# 设定 Y 轴主要坐标点的样式
for mal in axes.get_yticklabels(minor=False):
mal.set_font_properties(__font_properties__)
mal.set_fontsize(5) # 这个必须放在前一句后面,否则作用会被覆盖
# 辅助坐标点
#==================================================================================================================================================
if self._name == 'torate':
minorticks= list( itertools.chain.from_iterable( mi for mi in [[ma + (tostep/4.0)*i for i in range(1, 4)] for ma in majorticks] ) )
yMinorLocator= FixedLocator(numpy.array(minorticks))
yaxis.set_minor_locator(yMinorLocator)
def y_minor_formatter(num, pos=None):
return str(round(num/1000.0, 3)) + '%'
yMinorFormatter= FuncFormatter(y_minor_formatter)
yaxis.set_minor_formatter(yMinorFormatter)
# 设定 Y 轴主要坐标点的样式
for mil in axes.get_yticklabels(minor=True):
mil.set_font_properties(__font_properties__)
mil.set_fontsize(4) # 这个必须放在前一句后面,否则作用会被覆盖
else:
# minorticks= list( itertools.chain.from_iterable( mi for mi in [[ma + (tostep/4.0)*i for i in range(1, 4)] for ma in majorticks] ) )
minorticks= list( [ma + (tostep/2.0) for ma in majorticks] )
yMinorLocator= FixedLocator(numpy.array(minorticks))
yaxis.set_minor_locator(yMinorLocator)
# 设定 Y 轴主要坐标点的样式
for mil in axes.get_yticklabels(minor=True):
mil.set_visible(False)
# 换手率数值在图中间的显示
#==================================================================================================================================================
for iy in range(int(tostep/2.0), tostep*yrange, int(tostep/2.0)):
for ix in stopset[1:-1:3]:
newlab= axes.text(ix+8, iy, y_major_formatter(iy))
newlab.set_font_properties(__font_properties__)
newlab.set_color('0.3')
newlab.set_fontsize(3)
newlab.set_zorder(0) # XXX: 放在底层
# newlab.set_verticalalignment('center')
def set_yticks_2(self):
'''
设置 Y 轴坐标
'''
axes= self._Axes_2
yaxis= self._AxisY_2
tostep= self._tostep_2
yrange= self._yrange # 与 1 是一样的
# 设定换手率 Y 轴坐标的范围
#==================================================================================================================================================
axes.set_ylim(0, tostep*yrange)
# 主要坐标点
#==================================================================================================================================================
majorticks= [tostep*i for i in range(yrange)]
yMajorLocator= FixedLocator(numpy.array(majorticks))
# 确定 Y 轴的 MajorFormatter
def y_major_formatter(num, pos=None):
return str(round(num/1000.0, 2)) + '%'
yMajorFormatter= FuncFormatter(y_major_formatter)
# 确定 Y 轴的 MinorFormatter
yMinorFormatter= NullFormatter()
# 第一只:设定 X 轴的 Locator 和 Formatter
yaxis.set_major_locator(yMajorLocator)
yaxis.set_major_formatter(yMajorFormatter)
# 设定 Y 轴主要坐标点的样式
for mal in axes.get_yticklabels(minor=False):
mal.set_font_properties(__font_properties__)
mal.set_fontsize(5) # 这个必须放在前一句后面,否则作用会被覆盖
# 辅助坐标点
#==================================================================================================================================================
if self._name == 'torate':
minorticks= list( itertools.chain.from_iterable( mi for mi in [[ma + (tostep/4.0)*i for i in range(1, 4)] for ma in majorticks] ) )
yMinorLocator= FixedLocator(numpy.array(minorticks))
def y_minor_formatter(num, pos=None):
return str(round(num/1000.0, 3)) + '%'
yMinorFormatter= FuncFormatter(y_minor_formatter)
yaxis.set_minor_locator(yMinorLocator)
yaxis.set_minor_formatter(yMinorFormatter)
# 设定 Y 轴主要坐标点的样式
for mil in axes.get_yticklabels(minor=True):
mil.set_font_properties(__font_properties__)
mil.set_fontsize(4) # 这个必须放在前一句后面,否则作用会被覆盖
else:
minorticks= list( [ma + (tostep/2.0) for ma in majorticks] )
yMinorLocator= FixedLocator(numpy.array(minorticks))
yaxis.set_minor_locator(yMinorLocator)
# 设定 Y 轴主要坐标点的样式
for mil in axes.get_yticklabels(minor=True):
mil.set_visible(False)
class SubPlot_TORate(SubPlot_TORateBase):
pass
class SubPlot_TORateFullSpan(SubPlot_TORateBase):
pass
class MyFigure:
'''
'''
def __init__(self, pdata):
self._pdata= pdata # 绘图数据
self._figfacecolor= __color_pink__
self._figedgecolor= __color_navy__
self._figdpi= 300
self._figlinewidth= 1.0
self._xfactor= 10.0 / 230.0 # x size * x factor = x length
self._yfactor= 0.3 # y size * y factor = y length
jobstat= pdata[u'任务描述']
self._xsize_left= 12.0 # left blank
self._xsize_right= 12.0 # right blank
self._ysize_top= 0.3 # top blank
self._ysize_bottom= 1.2 # bottom blank
self._ysize_gap1= 0.2
self._ysize_gap2= 0.3 if (jobstat[u'历史价格子图'] or jobstat[u'历史换手率子图'] or jobstat[u'财务指标子图']) else 0.0
# 建立 X 轴参数
#===============================================================================================================
if jobstat[u'价格子图'] or jobstat[u'换手率子图']:
xparams= {'xmargin': 1}
xparams.update(self._compute_xparams()) # 与 X 轴坐标点相关的数据结构
if jobstat[u'历史价格子图'] or jobstat[u'历史换手率子图'] or jobstat[u'财务指标子图']:
xparams_fs= {'xmargin': 3}
xparams_fs.update(self._compute_xparams_fullspan())
# 建立子图对象
#===============================================================================================================
self._subplots= {}
if jobstat[u'公司信息子图']:
name= 'basic'
self._subplots[name]= SubPlot_BasicInfo(pdata=pdata, parent=self, name=name)
if jobstat[u'历史价格子图']: # XXX: 这个要放在 价格子图 前面,因为后者可能会用到它的 Y 轴坐标点位置
name= 'pricefs'
self._subplots[name]= SubPlot_PriceFullSpan(pdata=pdata, parent=self, xparams=xparams_fs, name=name)
if jobstat[u'价格子图']:
name= 'price'
self._subplots[name]= SubPlot_Price(pdata=pdata, parent=self, xparams=xparams, name=name)
if jobstat[u'财务指标子图']:
name= 'financial'
self._subplots[name]= SubPlot_Financial(pdata=pdata, parent=self, xparams=xparams_fs, name=name)
if jobstat[u'换手率子图']:
name= 'torate'
self._subplots[name]= SubPlot_TORate(pdata=pdata, parent=self, xparams=xparams, name=name)
if jobstat[u'历史换手率子图']:
name= 'toratefs'
self._subplots[name]= SubPlot_TORateFullSpan(pdata=pdata, parent=self, xparams=xparams_fs, name=name)
# 根据子图对象的尺寸计算自身的尺寸
#===============================================================================================================
self._xsize, \
self._ysize= self._compute_size()
self._xlength= self._xsize * self._xfactor
self._ylength= self._ysize * self._yfactor
# 根据计算出的尺寸建立 Figure 对象
#===============================================================================================================
self._Fig= pyplot.figure(figsize=(self._xlength, self._ylength), dpi=self._figdpi, facecolor=self._figfacecolor, \
edgecolor=self._figedgecolor, linewidth=self._figlinewidth) # Figure 对象
# 用新建立的 Figure 对象交给子图对象,完成子图对象的初始化
#===============================================================================================================
rects= self._compute_rect()
if 'basic' in self._subplots:
self._subplots['basic'].build_axes(figobj=self._Fig, rect=rects['basic'])
# XXX: 这个要放在 price 前面,因为后者要用到它的 Axes 对象
if 'torate' in self._subplots:
self._subplots['torate'].build_axes(figobj=self._Fig, rect=rects['torate'])
if 'price' in self._subplots:
self._subplots['price'].build_axes(figobj=self._Fig, rect=rects['price'])
# XXX: 这个要放在 pricefs 前面
if 'toratefs' in self._subplots:
self._subplots['toratefs'].build_axes(figobj=self._Fig, rect=rects['toratefs'])
if 'pricefs' in self._subplots:
self._subplots['pricefs'].build_axes(figobj=self._Fig, rect=rects['pricefs'])
def _compute_size(self):
'''
根据子图的尺寸计算自身尺寸
'''
pdata= self._pdata
jobstat= pdata[u'任务描述']
x_left, x_right= self._xsize_left, self._xsize_right
y_top, y_bottom= self._ysize_top, self._ysize_bottom
y_gap1= self._ysize_gap1
y_gap2= self._ysize_gap2
x_basic, y_basic= self._subplots['basic'].get_size() if 'basic' in self._subplots else (0.0, 0.0)
x_price, y_price= self._subplots['price'].get_size() if 'price' in self._subplots else (0.0, 0.0)
x_pricefs, y_pricefs= self._subplots['pricefs'].get_size() if 'pricefs' in self._subplots else (0.0, 0.0)
x_torate, y_torate= self._subplots['torate'].get_size() if 'torate' in self._subplots else (0.0, 0.0)
x_toratefs, y_toratefs= self._subplots['toratefs'].get_size() if 'toratefs' in self._subplots else (0.0, 0.0)
x_financial, y_financial= self._subplots['financial'].get_size() if 'financial' in self._subplots else (0.0, 0.0)
x_all= x_left + max(x_price, x_basic, x_pricefs) + x_right
y_all= y_top + y_basic + y_gap1 + y_pricefs + y_toratefs + y_financial + y_gap2 + y_price + y_torate + y_bottom
return (x_all, y_all)
def get_sizeset(self):
sizeset= {
'x': self._xsize,
'y': self._ysize,
'top': self._ysize_top,
'bottom': self._ysize_bottom,
'left': self._xsize_left,
'right': self._xsize_right
}
return sizeset
def _compute_rect(self):
'''
'''
pdata= self._pdata
jobstat= pdata[u'任务描述']
x_left= self._xsize_left
x_right= self._xsize_right
y_top= self._ysize_top
y_bottom= self._ysize_bottom
x_all= self._xsize
y_all= self._ysize
y_gap1= self._ysize_gap1 # basic 与 financial 之间的空隙
y_gap2= self._ysize_gap2 # toratefs 与 price 之间的空隙
x_basic, y_basic= self._subplots['basic'].get_size() if 'basic' in self._subplots else (0.0, 0.0)
x_price, y_price= self._subplots['price'].get_size() if 'price' in self._subplots else (0.0, 0.0)
x_pricefs, y_pricefs= self._subplots['pricefs'].get_size() if 'pricefs' in self._subplots else (0.0, 0.0)
x_torate, y_torate= self._subplots['torate'].get_size() if 'torate' in self._subplots else (0.0, 0.0)
x_toratefs, y_toratefs= self._subplots['toratefs'].get_size() if 'toratefs' in self._subplots else (0.0, 0.0)
x_financial, y_financial= self._subplots['financial'].get_size() if 'financial' in self._subplots else (0.0, 0.0)
rects= {}
if 'basic' in self._subplots:
rect= ((x_left + (x_all-x_left-x_right-x_basic)/2) / x_all, (y_all - y_top - y_basic)/y_all, x_basic/x_all, y_basic/y_all) # K线图部分
rects['basic']= rect
if 'price' in self._subplots:
rect= ((x_left + (x_all-x_left-x_right-x_price)/2) / x_all, (y_bottom + y_torate)/y_all, x_price/x_all, y_price/y_all) # K线图部分
rects['price']= rect
if 'torate' in self._subplots:
rect= ((x_left + (x_all-x_left-x_right-x_torate)/2)/x_all, y_bottom/y_all, x_torate/x_all, y_torate/y_all) # 成交量部分
rects['torate']= rect
if 'pricefs' in self._subplots:
rect= ((x_left + (x_all-x_left-x_right-x_pricefs)/2)/x_all, (y_all - y_top - y_basic - y_gap1 - y_pricefs)/y_all, x_pricefs/x_all, y_pricefs/y_all)
rects['pricefs']= rect
if 'toratefs' in self._subplots:
rect= ((x_left + (x_all-x_left-x_right-x_toratefs)/2)/x_all, (y_bottom + y_torate + y_price + y_gap2)/y_all, x_toratefs/x_all, y_toratefs/y_all)
rects['toratefs']= rect
return rects
def _compute_xparams(self):
'''
主要坐标点是每月第一个交易日,辅助坐标点是每周第一个交易日
'''
quotes= self._pdata[u'行情']
sidx= self._pdata[u'任务描述'][u'起始偏移']
eidx= self._pdata[u'任务描述'][u'结束偏移']
# 设定 X 轴上的坐标
#==================================================================================================================================================
datelist= [ datetime.date(int(ys), int(ms), int(ds)) for ys, ms, ds in [ dstr.split('-') for dstr in quotes[u'日期'][sidx:eidx] ] ]
# 确定 X 轴的 MajorLocator
mdindex= [] # 每个月第一个交易日在所有日期列表中的 index
allyears= set([d.year for d in datelist]) # 所有的交易年份
for yr in sorted(allyears):
allmonths= set([d.month for d in datelist if d.year == yr]) # 当年所有的交易月份
for mon in sorted(allmonths):
monthday= min([dt for dt in datelist if dt.year==yr and dt.month==mon]) # 当月的第一个交易日
mdindex.append(datelist.index(monthday))
xMajorLocator= FixedLocator(numpy.array(mdindex))
# 确定 X 轴的 MinorLocator
wdindex= {} # value: 每周第一个交易日在所有日期列表中的 index; key: 当周的序号 week number(当周是第几周)
for d in datelist:
isoyear, weekno= d.isocalendar()[0:2]
dmark= isoyear*100 + weekno
if dmark not in wdindex:
wdindex[dmark]= datelist.index(d)
wdindex= sorted(wdindex.values())
xMinorLocator= FixedLocator(numpy.array(wdindex))
# 确定 X 轴的 MajorFormatter 和 MinorFormatter
def x_major_formatter(idx, pos=None):
return datelist[idx].strftime('%Y-%m-%d')
def x_minor_formatter(idx, pos=None):
return datelist[idx].strftime('%m-%d')
xMajorFormatter= FuncFormatter(x_major_formatter)
xMinorFormatter= FuncFormatter(x_minor_formatter)
return {'xMajorLocator': xMajorLocator,
'xMinorLocator': xMinorLocator,
'xMajorFormatter': xMajorFormatter,
'xMinorFormatter': xMinorFormatter,
'mdindex': mdindex,
'wdindex': wdindex
}
def _compute_xparams_fullspan(self):
'''
主要坐标点是每季第一个交易日,辅助坐标点是每月第一个交易日。是给宏观子图用的。
'''
quotes= self._pdata[u'行情']
datelist= [ datetime.date(int(ys), int(ms), int(ds)) for ys, ms, ds in [ dstr.split('-') for dstr in quotes[u'日期'] ] ]
# 确定 X 轴的 MinorLocator
mdindex= [] # 每个月第一个交易日在所有日期列表中的 index
sdindex= [] # 每季度第一个交易日在所有日期列表中的 index
ydindex= [] # 每年第一个交易日在所有日期列表中的 index
allyears= set([d.year for d in datelist]) # 所有的交易年份
for yr in sorted(allyears):
allmonths= set([d.month for d in datelist if d.year == yr]) # 当年所有的交易月份
for mon in sorted(allmonths):
monthday= min([dt for dt in datelist if dt.year==yr and dt.month==mon]) # 当月的第一个交易日
idx= datelist.index(monthday)
if mon in (1, 4, 7, 10):
sdindex.append(idx)
if mon == 1:
ydindex.append(idx)
else:
mdindex.append(idx)
xMajorLocator= FixedLocator(numpy.array(sdindex))
xMinorLocator= FixedLocator(numpy.array(mdindex))
# 确定 X 轴的 MajorFormatter 和 MinorFormatter
def x_major_formatter(idx, pos=None):
return datelist[idx].strftime('%Y-%m-%d')
def x_minor_formatter(idx, pos=None):
return datelist[idx].strftime('%m-%d')
xMajorFormatter= FuncFormatter(x_major_formatter)
xMinorFormatter= FuncFormatter(x_minor_formatter)
return {'xMajorLocator': xMajorLocator,
'xMinorLocator': xMinorLocator,
'xMajorFormatter': xMajorFormatter,
'xMinorFormatter': xMinorFormatter,
'sdindex': sdindex,
'mdindex': mdindex,
'ydindex': ydindex
}
def plot(self):
'''
'''
# self.plot_title()
# 调用子图对象的绘图函数
if 'basic' in self._subplots:
self._subplots['basic'].plot()
if 'price' in self._subplots:
self._subplots['price'].plot()
if 'torate' in self._subplots:
self._subplots['torate'].plot()
if 'pricefs' in self._subplots:
self._subplots['pricefs'].plot()
if 'toratefs' in self._subplots:
self._subplots['toratefs'].plot()
def plot_title(self):
'''
绘制整个 Figure 的标题
'''
info= self._pdata[u'公司信息']
figobj= self._Fig
# 整个 figure 的标题
subtitle= (info[u'代码'] + ' ' if u'代码' in info else '') + info[u'简称']
subtitle_2= (info[u'代码二'] + ' ' if u'代码二' in info else '') + info[u'简称二']
figobj.suptitle(subtitle + ' / ' + subtitle_2, fontsize=12, fontproperties=__font_properties__)
def savefig(self, figpath):
'''
保存图片
'''
self._Fig.savefig(figpath, dpi=self._figdpi, facecolor=self._figfacecolor, edgecolor=self._figedgecolor, linewidth=self._figlinewidth)
if __name__ == '__main__':
# pfile 指明存放绘图数据的 pickle file,figpath 指定图片需存放的路径
pfile= sys.argv[1]
figpath= sys.argv[2]
# 绘图数据 pdata
fileobj= open(name=pfile, mode='rb')
pdata= pickle.load(fileobj)
fileobj.close()
os.remove(pfile)
myfig= MyFigure(pdata=pdata)
myfig.plot()
myfig.savefig(figpath=figpath)
用 Python / Matplotlib 画出来的股票 K线图 (二)
---- 最新的在这里: 用 Python / Matplotlib 画出来的股票 K线图 (四)
---- 下一篇在这里: 用 Python / Matplotlib 画出来的股票 K线图 (三)
---- 上一版的改进,双股同列 + 无数细小改进,如下图。dpi= 300。明的一条是个股走势,暗的是同期的指数走势。这大概是近期最强的一只。
---- 要想培养对走势的感觉,采用固定比例尺的图形是必须的。一般股票软件里的图形都为显示方便而做了变形处理,用处不大。
---- 图形感觉差不多了,告一段落。接下来的目标是 股本结构、历史分配、行业板块、股东研究 这些信息,还包括个股资讯。实时的数据仍然暂时不碰。
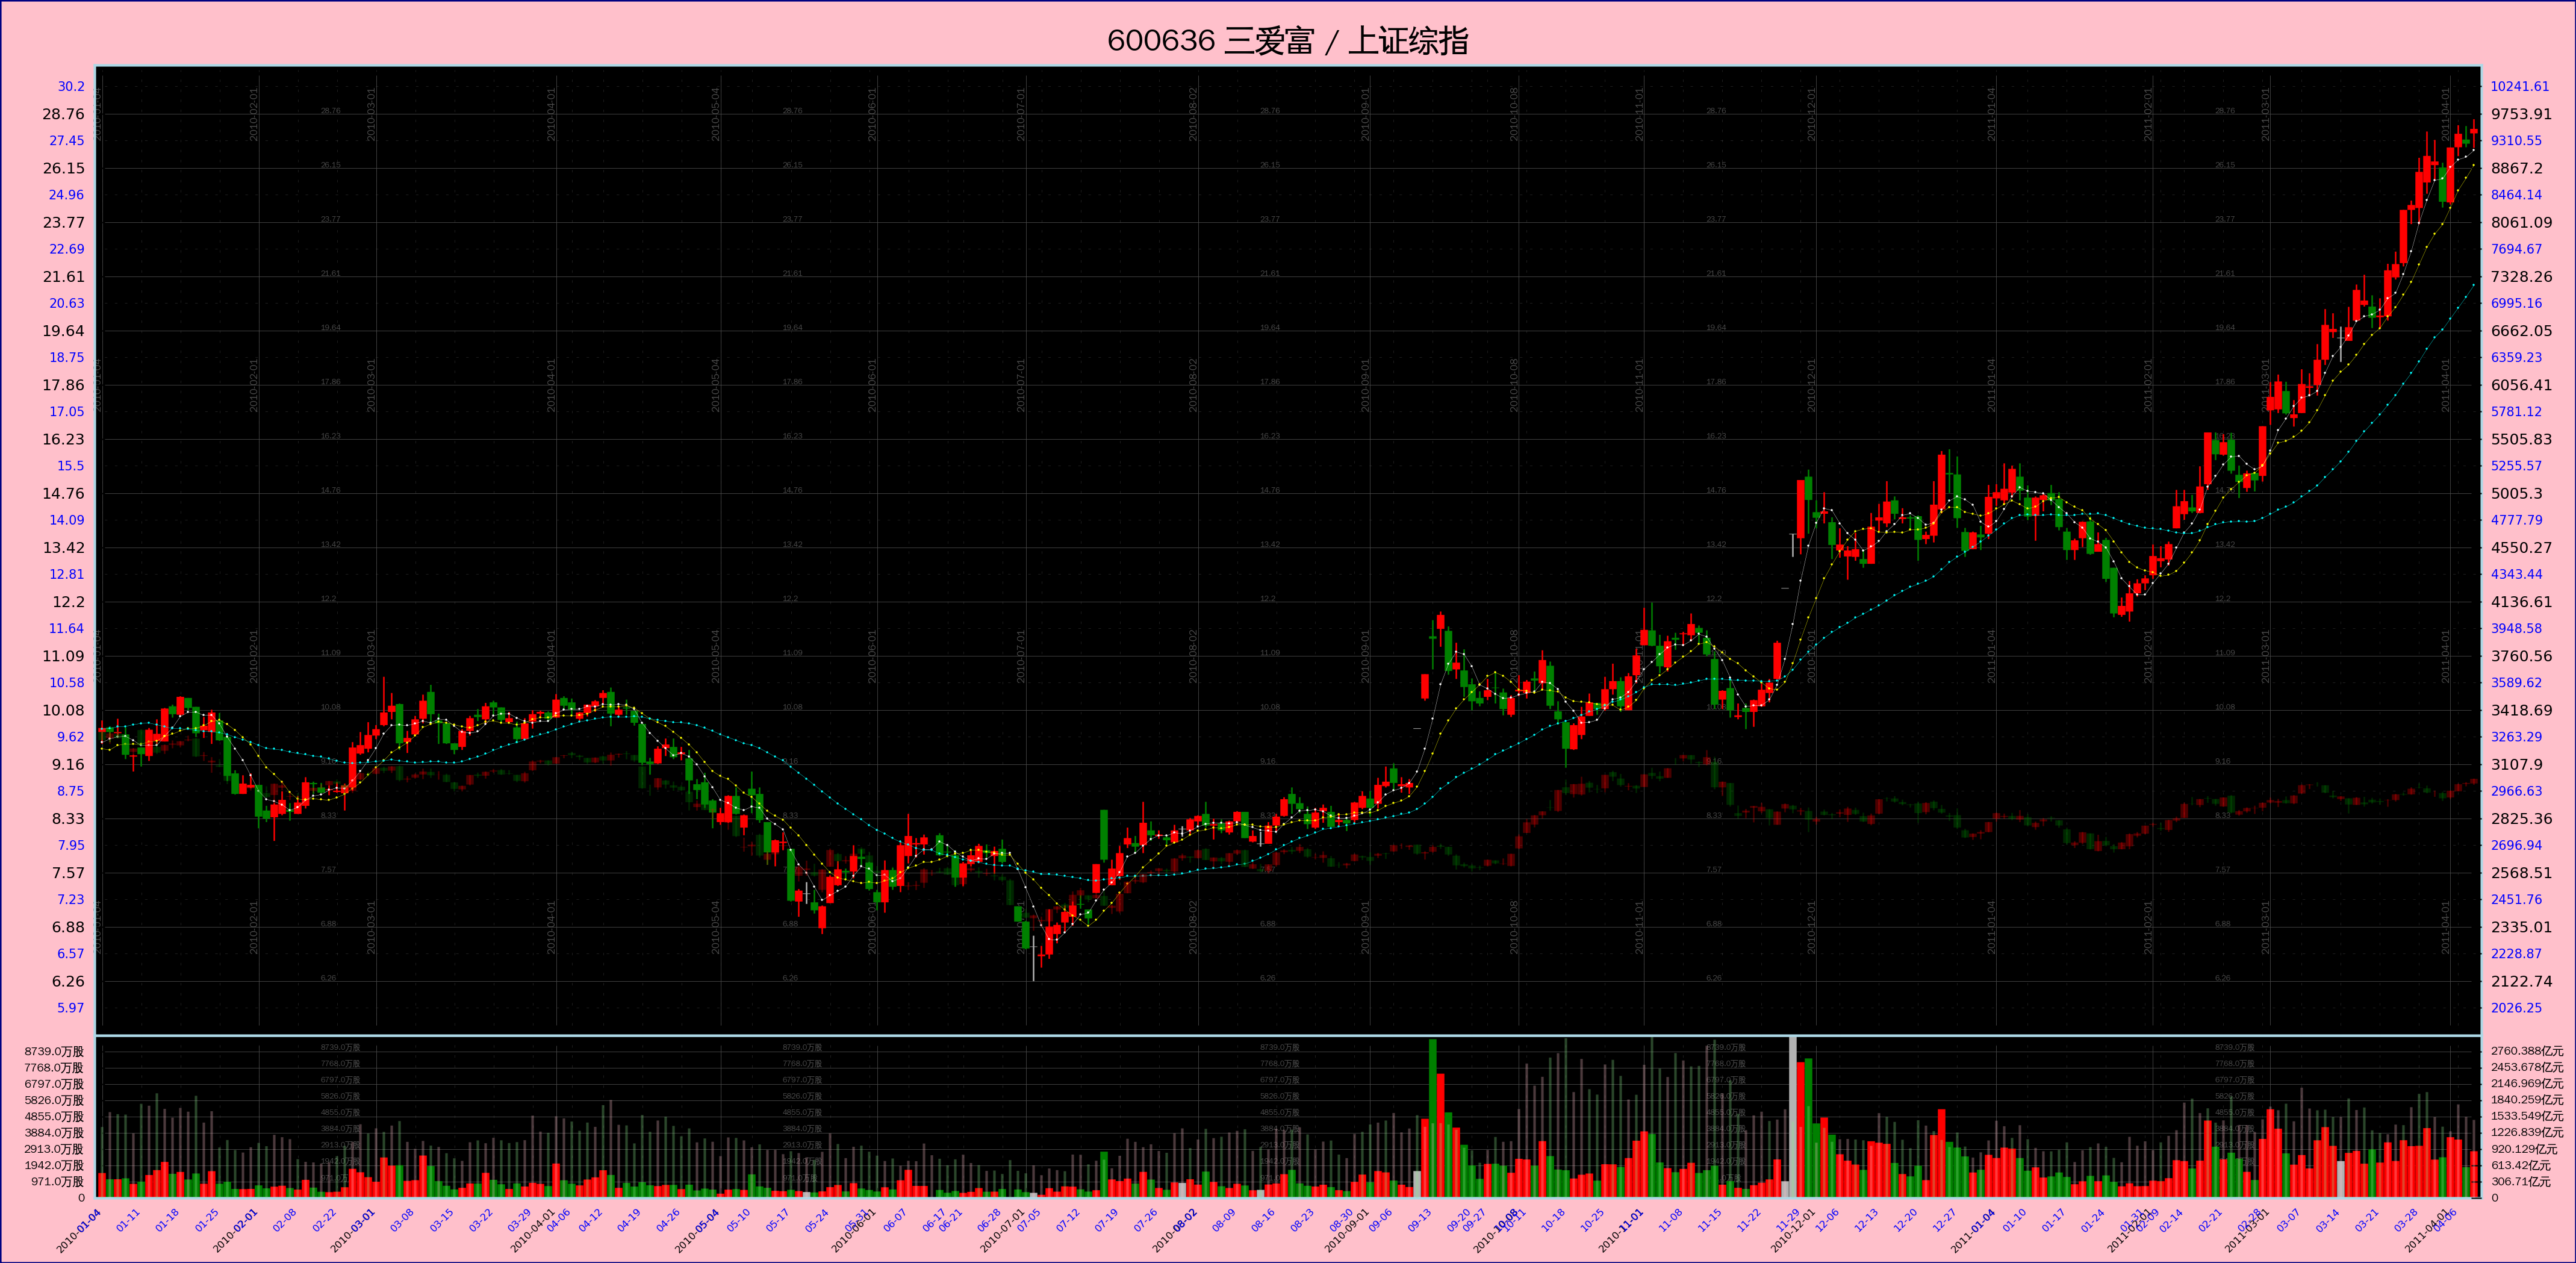
---- 源码贴出来。因为 Matplotlib 还不支持 Python3, 所以单写了一个 Python2 脚本。注意绘图数据是用 pickle file 传递的。
[补记:我决定放弃线性坐标了。这个脚本只支持对数坐标。]
# -*- coding: utf-8 -*-

import os
import sys
import pickle
import math
import datetime
import matplotlib

matplotlib.use("WXAgg", warn=True)	# 这个要紧跟在 import matplotlib 之后,而且必须安装了 wxpython 2.8 才行。

import matplotlib.pyplot as pyplot
import matplotlib.font_manager as font_manager

import numpy
from matplotlib.ticker import FixedLocator, MultipleLocator, FuncFormatter, NullFormatter


__font_properties__=font_manager.FontProperties(fname='/usr/share/fonts/truetype/wqy/wqy-zenhei.ttc')
__color_lightsalmon__= '#ffa07a'
__color_pink__= '#ffc0cb'
__color_navy__= '#000080'


def Plot(pfile, figpath):
	'''
	pfile 指明存放绘图数据的 pickle file,figpath 指定图片需存放的路径
	'''

	fileobj= open(name=pfile, mode='rb')
	pdata= pickle.load(fileobj)
	fileobj.close()
	os.remove(pfile)

	#	计算图片的尺寸(单位英寸)
	#	注意:Python2 里面, "1 / 10" 结果是 0, 必须写成 "1.0 / 10" 才会得到 0.1
	#==================================================================================================================================================
	length= len(pdata[u'日期'])		# 所有数据的长度,就是天数

	open_price_pri= pdata[u'开盘'][0]	# int 类型
	open_price_sec= pdata[u'开盘二'][0]	# 同上

	highest_price_pri= max( [phigh for phigh in pdata[u'最高'] if phigh != None] )		# 第一个行情的最高价
	highest_price_sec= max( [phigh for phigh in pdata[u'最高二'] if phigh != None] )	# 第二个行情的最高价
	highest_price= max(highest_price_pri, highest_price_sec*open_price_pri/open_price_sec)	# 以第一个行情为基准修正出的总最高价

	lowest_price_pri= min( [plow for plow in pdata[u'最低'] if plow != None] )	# 最低价
	lowest_price_sec= min( [plow for plow in pdata[u'最低二'] if plow != None] )	# 最低价
	lowest_price= min(lowest_price_pri, lowest_price_sec*open_price_pri/open_price_sec)	# 以第一个行情为基准修正出的总最低价


	yhighlim_price= int(highest_price * 1.1)	# K线子图 Y 轴最大坐标
	ylowlim_price=  int(lowest_price / 1.1)		# K线子图 Y 轴最小坐标


	xfactor= 10.0/230.0	# 一条 K 线的宽度在 X 轴上所占距离(英寸)
	yfactor= 0.3	# Y 轴上每一个距离单位的长度(英寸),这个单位距离是线性坐标和对数坐标通用的

	expbase= 1.1	# 底数,取得小一点,比较接近 1。股价 3 元到 4 元之间有大约 3 个单位距离

	# XXX: 价格在 Y 轴上的 “份数”。注意,虽然最高与最低价是以第一个行情为基准修正出来的,但其中包含的倍数因子对结果无影响,即:
	#	log(base, num1) - log(base, num2) ==
	#	log(base, num1/num2) ==
	#	log(base, k*num1/k*num2) ==
	#	log(base, k*num1) - log(base, k*num2)
	# ,这是对数运算的性质。
	ymulti_price= math.log(yhighlim_price, expbase)	- math.log(ylowlim_price, expbase)

	ymulti_vol= 3.0		# 成交量部分在 Y 轴所占的 “份数”
	ymulti_top= 1.2		# 顶部空白区域在 Y 轴所占的 “份数”
	ymulti_bot= 1.2		# 底部空白区域在 Y 轴所占的 “份数”

	xmulti_left= 12.0	# 左侧空白区域所占的 “份数”
	xmulti_right= 12.0	# 右侧空白区域所占的 “份数”

	xmulti_all= length + xmulti_left + xmulti_right
	xlen_fig= xmulti_all * xfactor		# 整个 Figure 的宽度
	ymulti_all= ymulti_price + ymulti_vol + ymulti_top + ymulti_bot
	ylen_fig= ymulti_all * yfactor		# 整个 Figure 的高度

	rect_1= (xmulti_left/xmulti_all, (ymulti_bot+ymulti_vol)/ymulti_all, length/xmulti_all, ymulti_price/ymulti_all)	# K线图部分
	rect_2= (xmulti_left/xmulti_all, ymulti_bot/ymulti_all, length/xmulti_all, ymulti_vol/ymulti_all)	# 成交量部分


	#	建立 Figure 对象
	#==================================================================================================================================================
	figfacecolor= __color_pink__
	figedgecolor= __color_navy__
	figdpi= 300
	figlinewidth= 1.0

	figobj= pyplot.figure(figsize=(xlen_fig, ylen_fig), dpi=figdpi, facecolor=figfacecolor, edgecolor=figedgecolor, linewidth=figlinewidth)	# Figure 对象

	# 整个 figure 的标题
	title_pri= (pdata[u'代码'] + ' ' if u'代码' in pdata else '') + pdata[u'简称']
	title_sec= (pdata[u'代码二'] + '   ' if u'代码二' in pdata else '') + pdata[u'简称二']

	figobj.suptitle(title_pri + ' / ' + title_sec, fontsize=12, fontproperties=__font_properties__)


	#==================================================================================================================================================
	#==================================================================================================================================================
	#=======
	#=======	XXX: 第一只:成交量部分
	#=======
	#==================================================================================================================================================
	#==================================================================================================================================================

	#	第一只:添加 Axes 对象
	#==================================================================================================================================================
	axes_2= figobj.add_axes(rect_2, axis_bgcolor='black')
	axes_2.set_axisbelow(True)	# 网格线放在底层

	#	第一只:改变坐标线的颜色
	#==================================================================================================================================================
	for child in axes_2.get_children():
		if isinstance(child, matplotlib.spines.Spine):
			child.set_color('lightblue')

	#	第一只:得到 X 轴 和 Y 轴 的两个 Axis 对象
	#==================================================================================================================================================
	xaxis_2= axes_2.get_xaxis()
	yaxis_2= axes_2.get_yaxis()

	#	第一只:设置两个坐标轴上的 grid
	#==================================================================================================================================================
	xaxis_2.grid(True, 'major', color='0.3', linestyle='solid', linewidth=0.2)
	xaxis_2.grid(True, 'minor', color='0.3', linestyle='dotted', linewidth=0.1)

	yaxis_2.grid(True, 'major', color='0.3', linestyle='solid', linewidth=0.2)
	yaxis_2.grid(True, 'minor', color='0.3', linestyle='dotted', linewidth=0.1)


	#==================================================================================================================================================
	#=======	第一只:成交量绘图
	#==================================================================================================================================================
	xindex= numpy.arange(length)	# X 轴上的 index,一个辅助数据

	zipoc= zip(pdata[u'开盘'], pdata[u'收盘'])
	up=   numpy.array( [ True if po < pc and po != None else False for po, pc in zipoc] )		# 标示出该天股价日内上涨的一个序列
	down= numpy.array( [ True if po > pc and po != None else False for po, pc in zipoc] )		# 标示出该天股价日内下跌的一个序列
	side= numpy.array( [ True if po == pc and po != None else False for po, pc in zipoc] )		# 标示出该天股价日内走平的一个序列


	if u'成交额' in pdata:
		volume= pdata[u'成交额']
	else:
		volume= pdata[u'成交量']

	rarray_vol= numpy.array(volume)
	volzeros= numpy.zeros(length)	# 辅助数据

	# XXX: 如果 up/down/side 各项全部为 False,那么 vlines() 会报错。
	if True in up:
		axes_2.vlines(xindex[up], volzeros[up], rarray_vol[up], edgecolor='red', linewidth=3.0, label='_nolegend_')
	if True in down:
		axes_2.vlines(xindex[down], volzeros[down], rarray_vol[down], edgecolor='green', linewidth=3.0, label='_nolegend_')
	if True in side:
		axes_2.vlines(xindex[side], volzeros[side], rarray_vol[side], edgecolor='0.7', linewidth=3.0, label='_nolegend_')


	#	第一只:设定 X 轴坐标的范围
	#==================================================================================================================================================
	axes_2.set_xlim(-1, length)


	#	第一只:设定 X 轴上的坐标
	#==================================================================================================================================================
	datelist= [ datetime.date(int(ys), int(ms), int(ds)) for ys, ms, ds in [ dstr.split('-') for dstr in pdata[u'日期'] ] ]

	# 确定 X 轴的 MajorLocator
	mdindex= []	# 每个月第一个交易日在所有日期列表中的 index
	years= set([d.year for d in datelist])	# 所有的交易年份

	for y in sorted(years):
		months= set([d.month for d in datelist if d.year == y])		# 当年所有的交易月份
		for m in sorted(months):
			monthday= min([dt for dt in datelist if dt.year==y and dt.month==m])	# 当月的第一个交易日
			mdindex.append(datelist.index(monthday))

	xMajorLocator= FixedLocator(numpy.array(mdindex))

	# 第一只:确定 X 轴的 MinorLocator
	wdindex= {}	# value: 每周第一个交易日在所有日期列表中的 index; key: 当周的序号 week number(当周是第几周)

	for d in datelist:
		isoyear, weekno= d.isocalendar()[0:2]
		dmark= isoyear*100 + weekno
		if dmark not in wdindex:
			wdindex[dmark]= datelist.index(d)

	xMinorLocator= FixedLocator(numpy.array( sorted(wdindex.values()) ))

	# 第一只:确定 X 轴的 MajorFormatter 和 MinorFormatter
	def x_major_formatter_2(idx, pos=None):
		return datelist[idx].strftime('%Y-%m-%d')

	def x_minor_formatter_2(idx, pos=None):
		return datelist[idx].strftime('%m-%d')

	xMajorFormatter= FuncFormatter(x_major_formatter_2)
	xMinorFormatter= FuncFormatter(x_minor_formatter_2)

	# 第一只:设定 X 轴的 Locator 和 Formatter
	xaxis_2.set_major_locator(xMajorLocator)
	xaxis_2.set_major_formatter(xMajorFormatter)

	xaxis_2.set_minor_locator(xMinorLocator)
	xaxis_2.set_minor_formatter(xMinorFormatter)

	# 第一只:设定 X 轴主要坐标点与辅助坐标点的样式
	for malabel in axes_2.get_xticklabels(minor=False):
		malabel.set_fontsize(4)
		malabel.set_horizontalalignment('right')
		malabel.set_rotation('45')

	for milabel in axes_2.get_xticklabels(minor=True):
		milabel.set_fontsize(4)
		milabel.set_color('blue')
		milabel.set_horizontalalignment('right')
		milabel.set_rotation('45')


	#	第一只:设定成交量 Y 轴坐标的范围
	#==================================================================================================================================================
	maxvol= max(volume)	# 注意是 int 类型
	axes_2.set_ylim(0, maxvol)


	#	第一只:设定成交量 Y 轴上的坐标
	#==================================================================================================================================================
	vollen= len(str(maxvol))

	volstep_pri= int(round(maxvol/10.0+5000, -4))

	yMajorLocator_2= MultipleLocator(volstep_pri)


	# 第一只:确定 Y 轴的 MajorFormatter
	dimsuffix= u'元' if u'成交额' in pdata else u'股'
	def y_major_formatter_2(num, pos=None):
		if num >= 10**8:	# 大于 1 亿
			return (str(round(num/10.0**8, 2)) + u'亿' + dimsuffix) if num != 0 else '0'
		else:
			return (str(num/10.0**4) + u'万' + dimsuffix) if num != 0 else '0'

	#	def y_major_formatter_2(num, pos=None):
	#		return int(num)
	yMajorFormatter_2= FuncFormatter(y_major_formatter_2)

	# 确定 Y 轴的 MinorFormatter
	#	def y_minor_formatter_2(num, pos=None):
	#		return int(num)
	#	yMinorFormatter_2= FuncFormatter(y_minor_formatter_2)
	yMinorFormatter_2= NullFormatter()

	# 第一只:设定 X 轴的 Locator 和 Formatter
	yaxis_2.set_major_locator(yMajorLocator_2)
	yaxis_2.set_major_formatter(yMajorFormatter_2)

	#	yaxis_2.set_minor_locator(yMinorLocator_2)
	yaxis_2.set_minor_formatter(yMinorFormatter_2)

	# 第一只:设定 Y 轴主要坐标点与辅助坐标点的样式
	for malab in axes_2.get_yticklabels(minor=False):
		malab.set_font_properties(__font_properties__)
		malab.set_fontsize(4.5)	# 这个必须放在前一句后面,否则作用会被覆盖


	#	第一只:成交量数值在图中间的显示
	#==================================================================================================================================================
	for iy in range(volstep_pri, maxvol, volstep_pri):
		for ix in mdindex[1:-1:3]:
			newlab= axes_2.text(ix+8, iy, y_major_formatter_2(iy))
			newlab.set_font_properties(__font_properties__)
			newlab.set_color('0.3')
			newlab.set_fontsize(3)
			newlab.set_zorder(0)		# XXX: 放在底层
			#	newlab.set_verticalalignment('center')


	#==================================================================================================================================================
	#==================================================================================================================================================
	#=======
	#=======	XXX: 第二条成交量图线
	#=======
	#==================================================================================================================================================
	#==================================================================================================================================================

	#	添加 Axes 对象
	#==================================================================================================================================================
	axes_2_sec= axes_2.twinx()
	#	axes_2_sec.set_axisbelow(True)	# 网格线放在底层

	axes_2_sec.set_axisbelow(True)	# 网格线放在底层

	#	改变坐标线的颜色
	#==================================================================================================================================================
	#	for child in axes_2_sec.get_children():
	#		if isinstance(child, matplotlib.spines.Spine):
	#			child.set_color('lightblue')

	#	得到 X 轴 和 Y 轴 的两个 Axis 对象
	#==================================================================================================================================================
	xaxis_2_sec= axes_2_sec.get_xaxis()
	yaxis_2_sec= axes_2_sec.get_yaxis()

	#	设置两个坐标轴上的 grid
	#==================================================================================================================================================
	#	xaxis_2_sec.grid(True, 'major', color='0.3', linestyle='solid', linewidth=0.2)
	#	xaxis_2_sec.grid(True, 'minor', color='0.3', linestyle='dotted', linewidth=0.1)

	#	yaxis_2_sec.grid(True, 'major', color='0.3', linestyle='solid', linewidth=0.2)
	#	yaxis_2_sec.grid(True, 'minor', color='0.3', linestyle='dotted', linewidth=0.1)


	#==================================================================================================================================================
	#=======	绘图
	#==================================================================================================================================================

	if u'成交额二' in pdata:
		volume_sec= pdata[u'成交额二']
	else:
		volume_sec= pdata[u'成交量二']

	zipoc_sec= zip(pdata[u'开盘二'], pdata[u'收盘二'])
	up_sec=   numpy.array( [ True if po < pc and po != None else False for po, pc in zipoc_sec] )		# 标示出该天股价日内上涨的一个序列
	down_sec= numpy.array( [ True if po > pc and po != None else False for po, pc in zipoc_sec] )		# 标示出该天股价日内下跌的一个序列
	side_sec= numpy.array( [ True if po == pc and po != None else False for po, pc in zipoc_sec] )		# 标示出该天股价日内走平的一个序列

	rarray_vol_sec= numpy.array(volume_sec)
	volzeros_sec= numpy.zeros(length)	# 辅助数据

	# XXX: 如果 up_sec/down_sec/side_sec 各项全部为 False,那么 vlines() 会报错。
	if True in up_sec:
		axes_2_sec.vlines(xindex[up_sec], volzeros_sec[up_sec], rarray_vol_sec[up_sec], edgecolor='pink', linewidth=1.0, label='_nolegend_', alpha=0.3)
	if True in down_sec:
		axes_2_sec.vlines(xindex[down_sec], volzeros_sec[down_sec], rarray_vol_sec[down_sec], edgecolor='lightgreen', linewidth=1.0, label='_nolegend_', alpha=0.3)
	if True in side_sec:
		axes_2_sec.vlines(xindex[side_sec], volzeros_sec[side_sec], rarray_vol_sec[side_sec], edgecolor='0.7', linewidth=1.0, label='_nolegend_', alpha=0.3)


	#	设定 X 轴坐标的范围
	#==================================================================================================================================================
	#	XXX: 不用了,与 axes_2 共用。


	#	设定 Y 轴坐标的范围
	#==================================================================================================================================================
	maxvol_sec= max(volume_sec)	# 注意是 int 类型
	axes_2_sec.set_ylim(0, maxvol_sec)


	#	设定 Y 轴上的坐标
	#==================================================================================================================================================

	volstep_sec= volstep_pri*maxvol_sec/float(maxvol)
	yMajorLocator_2_sec= MultipleLocator(volstep_sec)

	# 确定 Y 轴的 MajorFormatter
	dimsuffix_sec= u'元' if u'成交额二' in pdata else u'股'
	def y_major_formatter_2_sec(num, pos=None):
		if num >= 10**8:	# 大于 1 亿
			print(('num= ' + str(num) + ', result= ' + str(round(num/10.0**8, 3)) + u'亿' + dimsuffix_sec).encode('utf8'))

			return (str(round(num/10.0**8, 3)) + u'亿' + dimsuffix_sec) if num != 0 else '0'
		else:
			return (str(round(num/10.0**4, 2)) + u'万' + dimsuffix_sec) if num != 0 else '0'

	#	def y_major_formatter_2_sec(num, pos=None):
	#		return int(num)
	yMajorFormatter_2_sec= FuncFormatter(y_major_formatter_2_sec)

	# 确定 Y 轴的 MinorFormatter
	#	def y_minor_formatter_2(num, pos=None):
	#		return int(num)
	#	yMinorFormatter_2_sec= FuncFormatter(y_minor_formatter_2)
	yMinorFormatter_2_sec= NullFormatter()

	# 设定 X 轴的 Locator 和 Formatter
	yaxis_2_sec.set_major_locator(yMajorLocator_2_sec)
	yaxis_2_sec.set_major_formatter(yMajorFormatter_2_sec)

	#	yaxis_2_sec.set_minor_locator(yMinorLocator_2_sec)
	yaxis_2_sec.set_minor_formatter(yMinorFormatter_2_sec)

	# 设定 Y 轴主要坐标点与辅助坐标点的样式
	for malab in axes_2_sec.get_yticklabels(minor=False):
		malab.set_font_properties(__font_properties__)
		malab.set_fontsize(4.5)	# 这个必须放在前一句后面,否则作用会被覆盖


	#==================================================================================================================================================
	#==================================================================================================================================================
	#=======
	#=======	XXX: K 线图部分
	#=======
	#==================================================================================================================================================
	#==================================================================================================================================================

	#	添加 Axes 对象
	#==================================================================================================================================================
	axes_1= figobj.add_axes(rect_1, axis_bgcolor='black', sharex=axes_2)
	axes_1.set_axisbelow(True)	# 网格线放在底层

	axes_1.set_yscale('log', basey=expbase)		# 使用对数坐标

	#	改变坐标线的颜色
	#==================================================================================================================================================
	for child in axes_1.get_children():
		if isinstance(child, matplotlib.spines.Spine):
			child.set_color('lightblue')

	#	得到 X 轴 和 Y 轴 的两个 Axis 对象
	#==================================================================================================================================================
	xaxis_1= axes_1.get_xaxis()
	yaxis_1= axes_1.get_yaxis()

	#	设置两个坐标轴上的 grid
	#==================================================================================================================================================
	xaxis_1.grid(True, 'major', color='0.3', linestyle='solid', linewidth=0.2)
	xaxis_1.grid(True, 'minor', color='0.3', linestyle='dotted', linewidth=0.1)

	yaxis_1.grid(True, 'major', color='0.3', linestyle='solid', linewidth=0.2)
	yaxis_1.grid(True, 'minor', color='0.3', linestyle='dotted', linewidth=0.1)


	#==================================================================================================================================================
	#=======	绘图
	#==================================================================================================================================================

	#	绘制 K 线部分
	#==================================================================================================================================================

	#	对开收盘价进行视觉修正
	for idx, poc in enumerate( zip(pdata[u'开盘'], pdata[u'收盘']) ):
		if poc[0] == poc[1] and None not in poc:
			variant= round((poc[1]+1000)/2000, 0)
			pdata[u'开盘'][idx]= poc[0] - variant		# 稍微偏离一点,使得在图线上不致于完全看不到
			pdata[u'收盘'][idx]= poc[1] + variant

	rarray_open= numpy.array(pdata[u'开盘'])
	rarray_close= numpy.array(pdata[u'收盘'])
	rarray_high= numpy.array(pdata[u'最高'])
	rarray_low= numpy.array(pdata[u'最低'])

	# XXX: 如果 up, down, side 里有一个全部为 False 组成,那么 vlines() 会报错。
	# XXX: 可以使用 alpha 参数调节透明度
	if True in up:
		axes_1.vlines(xindex[up], rarray_low[up], rarray_high[up], edgecolor='red', linewidth=0.6, label='_nolegend_')
		axes_1.vlines(xindex[up], rarray_open[up], rarray_close[up], edgecolor='red', linewidth=3.0, label='_nolegend_')

	if True in down:
		axes_1.vlines(xindex[down], rarray_low[down], rarray_high[down], edgecolor='green', linewidth=0.6, label='_nolegend_')
		axes_1.vlines(xindex[down], rarray_open[down], rarray_close[down], edgecolor='green', linewidth=3.0, label='_nolegend_')

	if True in side:
		axes_1.vlines(xindex[side], rarray_low[side], rarray_high[side], edgecolor='0.7', linewidth=0.6, label='_nolegend_')
		axes_1.vlines(xindex[side], rarray_open[side], rarray_close[side], edgecolor='0.7', linewidth=3.0, label='_nolegend_')

	#	绘制均线部分
	#==================================================================================================================================================
	if u'5日均' in pdata:
		rarray_5dayave= numpy.array(pdata[u'5日均'])
		axes_1.plot(xindex, rarray_5dayave, 'o-', color='white', linewidth=0.1, label='ave_5', \
			markersize=0.7, markeredgecolor='white', markeredgewidth=0.1)	# 5日均线

	if u'10日均' in pdata:
		rarray_10dayave= numpy.array(pdata[u'10日均'])
		axes_1.plot(xindex, rarray_10dayave, 'o-', color='yellow', linewidth=0.1, label='ave_10', \
			markersize=0.7, markeredgecolor='yellow', markeredgewidth=0.1)	# 10日均线

	if u'30日均' in pdata:
		rarray_30dayave= numpy.array(pdata[u'30日均'])
		axes_1.plot(xindex, rarray_30dayave, 'o-', color='cyan', linewidth=0.1, label='ave_30', \
			markersize=0.7, markeredgecolor='cyan', markeredgewidth=0.1)	# 30日均线


	#	绘制 复权提示
	#==================================================================================================================================================
	if u'复权' in pdata:
		adjdict= dict(pdata[u'复权'])

		for idx, dstr in enumerate(pdata[u'日期']):
			if dstr in adjdict:
				axes_1.plot([idx, idx], [ylowlim_price, yhighlim_price], '-', color='purple', linewidth=0.3)


	#	设定 X 轴坐标的范围
	#==================================================================================================================================================
	axes_1.set_xlim(-1, length)


	#	先设置 label 位置,再将 X 轴上的坐标设为不可见。因为与 成交量子图 共用 X 轴
	#==================================================================================================================================================

	# 设定 X 轴的 Locator 和 Formatter
	xaxis_1.set_major_locator(xMajorLocator)
	xaxis_1.set_major_formatter(xMajorFormatter)

	xaxis_1.set_minor_locator(xMinorLocator)
	xaxis_1.set_minor_formatter(xMinorFormatter)

	# 将 X 轴上的坐标设为不可见。
	for malab in axes_1.get_xticklabels(minor=False):
		malab.set_visible(False)

	for milab in axes_1.get_xticklabels(minor=True):
		milab.set_visible(False)

	# 用这一段效果也一样
	#	pyplot.setp(axes_1.get_xticklabels(minor=False), visible=False)
	#	pyplot.setp(axes_1.get_xticklabels(minor=True), visible=False)


	#	设定 Y 轴坐标的范围
	#==================================================================================================================================================
	axes_1.set_ylim(ylowlim_price, yhighlim_price)


	#	设定 Y 轴上的坐标
	#==================================================================================================================================================

	# XXX: 不用 LogLocator 了,因为不能控制坐标点的位置。

	#	主要坐标点
	#----------------------------------------------------------------------------
	yticks_major_pri= []
	for i in range(1, 999):
		newloc= ylowlim_price * (expbase**i)
		if newloc <= yhighlim_price:
			yticks_major_pri.append(newloc)
		else:
			break

	yMajorLocator_1= FixedLocator(numpy.array(yticks_major_pri))

	# 确定 Y 轴的 MajorFormatter
	def y_major_formatter_1(num, pos=None):
		return str(round(num/1000.0, 2))

	yMajorFormatter_1= FuncFormatter(y_major_formatter_1)

	# 设定 X 轴的 Locator 和 Formatter
	yaxis_1.set_major_locator(yMajorLocator_1)
	yaxis_1.set_major_formatter(yMajorFormatter_1)

	# 设定 Y 轴主要坐标点与辅助坐标点的样式
	for mal in axes_1.get_yticklabels(minor=False):
		mal.set_fontsize(6)


	#	辅助坐标点
	#----------------------------------------------------------------------------
	yticks_minor_pri= []
	mtstart= ylowlim_price * (1.0+(expbase-1.0)/2)
	for i in range(999):
		newloc= mtstart * (expbase**i)
		if newloc <= yhighlim_price:
			yticks_minor_pri.append(newloc)
		else:
			break

	yMinorLocator_1= FixedLocator(numpy.array(yticks_minor_pri))		# XXX minor ticks 已经在上面一并设置,这里不需要了。

	# 确定 Y 轴的 MinorFormatter
	def y_minor_formatter_1(num, pos=None):
		return str(round(num/1000.0, 2))

	yMinorFormatter_1= FuncFormatter(y_minor_formatter_1)

	# 设定 X 轴的 Locator 和 Formatter
	yaxis_1.set_minor_locator(yMinorLocator_1)
	yaxis_1.set_minor_formatter(yMinorFormatter_1)
	# 设定 Y 轴主要坐标点与辅助坐标点的样式
	for mal in axes_1.get_yticklabels(minor=True):
		mal.set_fontsize(5)
		mal.set_color('blue')


	#	第一只:价格数值在图中间的显示
	#==================================================================================================================================================
	for iy in yticks_major_pri:
		for ix in mdindex[1:-1:3]:
			newlab= axes_1.text(ix+8, iy*1.001, y_major_formatter_1(iy))
			newlab.set_font_properties(__font_properties__)
			newlab.set_color('0.3')
			newlab.set_fontsize(3)
			newlab.set_zorder(0)		# XXX: 放在底层
			#	newlab.set_verticalalignment('center')


	#	第一只:日期在图中间的显示
	#==================================================================================================================================================
	for iy in yticks_minor_pri[1:-1:5]:
		for ix in mdindex:
			newlab= axes_1.text(ix-1, iy, pdata[u'日期'][ix])
			newlab.set_font_properties(__font_properties__)
			newlab.set_color('0.3')
			newlab.set_fontsize(4)
			newlab.set_rotation('vertical')
			#	newlab.set_horizontalalignment('left')
			#	newlab.set_verticalalignment('bottom')
			newlab.set_zorder(0)		# XXX: 放在底层
			#	newlab.set_verticalalignment('center')


	#==================================================================================================================================================
	#==================================================================================================================================================
	#=======
	#=======	XXX: 第二条 K 线图
	#=======
	#==================================================================================================================================================
	#==================================================================================================================================================

	#	添加 Axes 对象
	#==================================================================================================================================================
	axes_1_sec= axes_1.twinx()
	#	axes_1_sec.set_axisbelow(True)	# 网格线放在底层

	axes_1_sec.set_yscale('log', basey=expbase)	# 使用对数坐标


	#	得到 X 轴 和 Y 轴 的两个 Axis 对象
	#==================================================================================================================================================
	xaxis_1_sec= axes_1_sec.get_xaxis()
	yaxis_1_sec= axes_1_sec.get_yaxis()


	#==================================================================================================================================================
	#=======	绘图
	#==================================================================================================================================================

	#	绘制 K 线部分
	#==================================================================================================================================================

	#	对开收盘价进行视觉修正
	for idx, poc in enumerate( zipoc_sec ):
		if poc[0] == poc[1] and None not in poc:
			pdata[u'开盘二'][idx]= poc[0] - 5		# 稍微偏离一点,使得在图线上不致于完全看不到
			pdata[u'收盘二'][idx]= poc[1] + 5

	rarray_open= numpy.array(pdata[u'开盘二'])
	rarray_close= numpy.array(pdata[u'收盘二'])
	rarray_high= numpy.array(pdata[u'最高二'])
	rarray_low= numpy.array(pdata[u'最低二'])

	# XXX: 如果 up_sec, down_sec, side_sec 里有一个全部为 False 组成,那么 vlines() 会报错。
	# XXX: 可以使用 alpha 参数调节透明度
	if True in up_sec:
		axes_1_sec.vlines(xindex[up_sec], rarray_low[up_sec], rarray_high[up_sec], edgecolor='red', linewidth=0.6, label='_nolegend_', alpha=0.3)
		axes_1_sec.vlines(xindex[up_sec], rarray_open[up_sec], rarray_close[up_sec], edgecolor='red', linewidth=3.0, label='_nolegend_', alpha=0.3)

	if True in down_sec:
		axes_1_sec.vlines(xindex[down_sec], rarray_low[down_sec], rarray_high[down_sec], edgecolor='green', linewidth=0.6, label='_nolegend_', alpha=0.3)
		axes_1_sec.vlines(xindex[down_sec], rarray_open[down_sec], rarray_close[down_sec], edgecolor='green', linewidth=3.0, label='_nolegend_', alpha=0.3)

	if True in side_sec:
		axes_1_sec.vlines(xindex[side_sec], rarray_low[side_sec], rarray_high[side_sec], edgecolor='0.7', linewidth=0.6, label='_nolegend_', alpha=0.3)
		axes_1_sec.vlines(xindex[side_sec], rarray_open[side_sec], rarray_close[side_sec], edgecolor='0.7', linewidth=3.0, label='_nolegend_', alpha=0.3)


	#	设定 X 轴坐标的范围
	#==================================================================================================================================================
	axes_1_sec.set_xlim(-1, length)


	#	先设置 label 位置,再将 X 轴上的坐标设为不可见。因为与 成交量子图 共用 X 轴
	#==================================================================================================================================================

	# 设定 X 轴的 Locator 和 Formatter
	xaxis_1_sec.set_major_locator(xMajorLocator)
	xaxis_1_sec.set_major_formatter(xMajorFormatter)

	xaxis_1_sec.set_minor_locator(xMinorLocator)
	xaxis_1_sec.set_minor_formatter(xMinorFormatter)

	# 将 X 轴上的坐标设为不可见。
	for malab in axes_1_sec.get_xticklabels(minor=False):
		malab.set_visible(False)

	for milab in axes_1_sec.get_xticklabels(minor=True):
		milab.set_visible(False)


	#	设定 Y 轴坐标的范围
	#==================================================================================================================================================
	axes_1_sec.set_ylim(ylowlim_price*open_price_sec/open_price_pri, yhighlim_price*open_price_sec/open_price_pri)


	#	设定 Y 轴上的坐标
	#==================================================================================================================================================

	#	主要坐标点
	#----------------------------------------------------------------------------
	yticks_major_sec= []
	ylowlim_price_sec=  ylowlim_price*open_price_sec/open_price_pri
	yhighlim_price_sec= yhighlim_price*open_price_sec/open_price_pri

	for i in range(1, 999):
		newloc= ylowlim_price_sec * (expbase**i)
		if newloc <= yhighlim_price_sec:
			yticks_major_sec.append(newloc)
		else:
			break

	yMajorLocator_1_sec= FixedLocator(numpy.array(yticks_major_sec))

	# 确定 Y 轴的 MajorFormatter
	def y_major_formatter_1_sec(num, pos=None):
		return str(round(num/1000.0, 2))

	yMajorFormatter_1_sec= FuncFormatter(y_major_formatter_1_sec)

	# 设定 X 轴的 Locator 和 Formatter
	yaxis_1_sec.set_major_locator(yMajorLocator_1_sec)
	yaxis_1_sec.set_major_formatter(yMajorFormatter_1_sec)

	# 设定 Y 轴主要坐标点与辅助坐标点的样式
	for mal in axes_1_sec.get_yticklabels(minor=False):
		mal.set_fontsize(6)


	#	辅助坐标点
	#----------------------------------------------------------------------------
	yticks_minor_sec= []
	mtstart_sec= ylowlim_price_sec * (1.0+(expbase-1.0)/2)
	for i in range(999):
		newloc= mtstart_sec * (expbase**i)
		if newloc <= yhighlim_price_sec:
			yticks_minor_sec.append(newloc)
		else:
			break

	yMinorLocator_1_sec= FixedLocator(numpy.array(yticks_minor_sec))		# XXX minor ticks 已经在上面一并设置,这里不需要了。

	# 确定 Y 轴的 MinorFormatter
	def y_minor_formatter_1_sec(num, pos=None):
		return str(round(num/1000.0, 2))

	yMinorFormatter_1_sec= FuncFormatter(y_minor_formatter_1_sec)

	# 设定 X 轴的 Locator 和 Formatter
	yaxis_1_sec.set_minor_locator(yMinorLocator_1_sec)
	yaxis_1_sec.set_minor_formatter(yMinorFormatter_1_sec)
	# 设定 Y 轴主要坐标点与辅助坐标点的样式
	for mal in axes_1_sec.get_yticklabels(minor=True):
		mal.set_fontsize(5)
		mal.set_color('blue')


	#	显示图片
	#==================================================================================================================================================
	#	pyplot.show()

	#	保存图片
	#==================================================================================================================================================
	figobj.savefig(figpath, dpi=figdpi, facecolor=figfacecolor, edgecolor=figedgecolor, linewidth=figlinewidth)


if __name__ == '__main__':
	Plot(pfile=sys.argv[1], figpath=sys.argv[2])
用来画股票 K线图 的 Python 脚本
---- <补记>:
最新的在这里: 用 Python / Matplotlib 画出来的股票 K线图 (四)
下一篇在这里: 用 Python / Matplotlib 画出来的股票 K线图 (三)
---- 花了 20 个小时左右的时间才从新浪下载完复权日线数据,把复权日线表建起来。这速度也太慢了,还有首次下载网页失败的比例居然这么高,一定有问题,印象中以前不是这么慢的,下载几千只股票的数据也只有几十个页面会首次下载失败吧。但昨天晚上更新最新数据的时候把下载任务之间的延迟扩大了一些,好像好一些,速度还可以,而且失败率不高。我开的是 5 个线程,下载页面之间的间隔是 0.2 ~ 0.3 秒。
---- 另外,把那个画 K 线图的脚本贴出来。这个脚本是通过研究 Matplotlib 官网里的示例并且借助 Google,用大概 1 周的时间改出来的。简单介绍一下:
1. 由两个子图(subplot)构成,上面一个显示价格(K 线),下面一个显示成交量。
2. K 线子图可以使用线性坐标或者对数坐标(由 Plot() 函数第三个参数控制)。使用线性坐标的时候,每个单位价格区间所占高度是固定的;使用对数坐标的时候,每个单位涨幅区间(比如 10%)所占高度是固定的。成交量子图的高度总是固定,不论成交量数值大小。
3. 对 X 轴来说,每根 K 线的宽度固定,整个图形的宽度决定于行情的天数。只要把行情数据文件作为参数传递过去就可以,图片尺寸由程序自主计算。
4. 另外,figdpi 这个变量控制图片的分辨率(解析度),可以随意调大调小。上一篇文章里贴的图使用的 dpi 值是 300。另外,X 轴和 Y 轴上的坐标点也是程序自主决定的。
---- 整个脚本还是一个 work-in-progress,目前的局限主要在于使用对数坐标时,Y 轴坐标点的确定。前一篇里所贴的那个图,可以看见价格上限在 20 块左右,如果换一只价格 90 块上下的股票,或者用来画几千点的指数行情,那 Y 轴的坐标点就会太密集。解决办法是根据取值区间来自主选择合适的 Y 轴坐标间距,但是这个目前还没有做。
---- 任何意见或建议都许多欢迎 !
---- <补记>:已经有了大幅改进的版本,在下一篇里。
# -*- coding: utf-8 -*-

import sys
import pickle
import math
import datetime
import matplotlib

matplotlib.use("WXAgg", warn=True)	# 这个要紧跟在 import matplotlib 之后,而且必须安装了 wxpython 2.8 才行。

import matplotlib.pyplot as pyplot
import numpy
from matplotlib.ticker import FixedLocator, MultipleLocator, LogLocator, FuncFormatter, NullFormatter, LogFormatter


def Plot(pfile, figpath, useexpo=True):
	'''
	pfile 指明存放绘图数据的 pickle file,figpath 指定图片需存放的路径
	'''

	fileobj= open(name=pfile, mode='rb')
	pdata= pickle.load(fileobj)
	fileobj.close()

	#	计算图片的尺寸(单位英寸)
	#	注意:Python2 里面, "1 / 10" 结果是 0, 必须写成 "1.0 / 10" 才会得到 0.1
	#==================================================================================================================================================

	length= len(pdata[u'日期'])		# 所有数据的长度,就是天数

	highest_price= max(pdata[u'最高'])	# 最高价
	lowest_price= min( [plow for plow in pdata[u'最低'] if plow != None] )	# 最低价

	yhighlim_price= round(highest_price+50, -2)	# K线子图 Y 轴最大坐标
	ylowlim_price=  round(lowest_price-50, -2)	# K线子图 Y 轴最小坐标

	xfactor= 10.0/230.0	# 一条 K 线的宽度在 X 轴上所占距离(英寸)
	yfactor= 0.3	# Y 轴上每一个距离单位的长度(英寸),这个单位距离是线性坐标和对数坐标通用的

	if useexpo:	# 要使用对数坐标
		expbase= 1.1	# 底数,取得小一点,比较接近 1。股价 3 元到 4 元之间有大约 3 个单位距离
		ymulti_price= math.log(yhighlim_price, expbase)	- math.log(ylowlim_price, expbase)	# 价格在 Y 轴上的 “份数”

	else:
		ymulti_price= (yhighlim_price - ylowlim_price) / 100	# 价格在 Y 轴上的 “份数”

	ymulti_vol= 3.0		# 成交量部分在 Y 轴所占的 “份数”
	ymulti_top= 0.2		# 顶部空白区域在 Y 轴所占的 “份数”
	ymulti_bot= 0.8		# 底部空白区域在 Y 轴所占的 “份数”

	xmulti_left= 10.0	# 左侧空白区域所占的 “份数”
	xmulti_right= 3.0	# 右侧空白区域所占的 “份数”

	xmulti_all= length + xmulti_left + xmulti_right
	xlen_fig= xmulti_all * xfactor		# 整个 Figure 的宽度
	ymulti_all= ymulti_price + ymulti_vol + ymulti_top + ymulti_bot
	ylen_fig= ymulti_all * yfactor		# 整个 Figure 的高度

	rect_1= (xmulti_left/xmulti_all, (ymulti_bot+ymulti_vol)/ymulti_all, length/xmulti_all, ymulti_price/ymulti_all)	# K线图部分
	rect_2= (xmulti_left/xmulti_all, ymulti_bot/ymulti_all, length/xmulti_all, ymulti_vol/ymulti_all)	# 成交量部分

	#	建立 Figure 对象
	#==================================================================================================================================================
	figfacecolor= 'white'
	figedgecolor= 'black'
	figdpi= 600
	figlinewidth= 1.0

	figobj= pyplot.figure(figsize=(xlen_fig, ylen_fig), dpi=figdpi, facecolor=figfacecolor, edgecolor=figedgecolor, linewidth=figlinewidth)	# Figure 对象

	#==================================================================================================================================================
	#==================================================================================================================================================
	#=======	成交量部分
	#==================================================================================================================================================
	#==================================================================================================================================================

	#	添加 Axes 对象
	#==================================================================================================================================================
	axes_2= figobj.add_axes(rect_2, axis_bgcolor='black')
	axes_2.set_axisbelow(True)	# 网格线放在底层

	#	改变坐标线的颜色
	#==================================================================================================================================================
	for child in axes_2.get_children():
		if isinstance(child, matplotlib.spines.Spine):
			child.set_color('lightblue')

	#	得到 X 轴 和 Y 轴 的两个 Axis 对象
	#==================================================================================================================================================
	xaxis_2= axes_2.get_xaxis()
	yaxis_2= axes_2.get_yaxis()

	#	设置两个坐标轴上的 grid
	#==================================================================================================================================================
	xaxis_2.grid(True, 'major', color='0.3', linestyle='solid', linewidth=0.2)
	xaxis_2.grid(True, 'minor', color='0.3', linestyle='dotted', linewidth=0.1)

	yaxis_2.grid(True, 'major', color='0.3', linestyle='solid', linewidth=0.2)
	yaxis_2.grid(True, 'minor', color='0.3', linestyle='dotted', linewidth=0.1)


	#==================================================================================================================================================
	#=======	绘图
	#==================================================================================================================================================
	xindex= numpy.arange(length)	# X 轴上的 index,一个辅助数据

	zipoc= zip(pdata[u'开盘'], pdata[u'收盘'])
	up=   numpy.array( [ True if po < pc and po != None else False for po, pc in zipoc] )		# 标示出该天股价日内上涨的一个序列
	down= numpy.array( [ True if po > pc and po != None else False for po, pc in zipoc] )		# 标示出该天股价日内下跌的一个序列
	side= numpy.array( [ True if po == pc and po != None else False for po, pc in zipoc] )		# 标示出该天股价日内走平的一个序列


	volume= pdata[u'成交量']
	rarray_vol= numpy.array(volume)
	volzeros= numpy.zeros(length)	# 辅助数据

	# XXX: 如果 up/down/side 各项全部为 False,那么 vlines() 会报错。
	if True in up:
		axes_2.vlines(xindex[up], volzeros[up], rarray_vol[up], color='red', linewidth=3.0, label='_nolegend_')
	if True in down:
		axes_2.vlines(xindex[down], volzeros[down], rarray_vol[down], color='green', linewidth=3.0, label='_nolegend_')
	if True in side:
		axes_2.vlines(xindex[side], volzeros[side], rarray_vol[side], color='0.7', linewidth=3.0, label='_nolegend_')


	#	设定 X 轴坐标的范围
	#==================================================================================================================================================
	axes_2.set_xlim(-1, length)


	#	设定 X 轴上的坐标
	#==================================================================================================================================================
	datelist= [ datetime.date(int(ys), int(ms), int(ds)) for ys, ms, ds in [ dstr.split('-') for dstr in pdata[u'日期'] ] ]

	# 确定 X 轴的 MajorLocator
	mdindex= []	# 每个月第一个交易日在所有日期列表中的 index
	years= set([d.year for d in datelist])	# 所有的交易年份

	for y in sorted(years):
		months= set([d.month for d in datelist if d.year == y])		# 当年所有的交易月份
		for m in sorted(months):
			monthday= min([dt for dt in datelist if dt.year==y and dt.month==m])	# 当月的第一个交易日
			mdindex.append(datelist.index(monthday))

	xMajorLocator= FixedLocator(numpy.array(mdindex))

	# 确定 X 轴的 MinorLocator
	wdindex= []	# 每周第一个交易日在所有日期列表中的 index
	for d in datelist:
		if d.weekday() == 0: wdindex.append(datelist.index(d))

	xMinorLocator= FixedLocator(numpy.array(wdindex))

	# 确定 X 轴的 MajorFormatter 和 MinorFormatter
	def x_major_formatter_2(idx, pos=None):
		return datelist[idx].strftime('%Y-%m-%d')

	def x_minor_formatter_2(idx, pos=None):
		return datelist[idx].strftime('%m-%d')

	xMajorFormatter= FuncFormatter(x_major_formatter_2)
	xMinorFormatter= FuncFormatter(x_minor_formatter_2)

	# 设定 X 轴的 Locator 和 Formatter
	xaxis_2.set_major_locator(xMajorLocator)
	xaxis_2.set_major_formatter(xMajorFormatter)

	xaxis_2.set_minor_locator(xMinorLocator)
	xaxis_2.set_minor_formatter(xMinorFormatter)

	# 设定 X 轴主要坐标点与辅助坐标点的样式
	for malabel in axes_2.get_xticklabels(minor=False):
		malabel.set_fontsize(3)
		malabel.set_horizontalalignment('right')
		malabel.set_rotation('30')

	for milabel in axes_2.get_xticklabels(minor=True):
		milabel.set_fontsize(2)
		milabel.set_horizontalalignment('right')
		milabel.set_rotation('30')


	#	设定 Y 轴坐标的范围
	#==================================================================================================================================================
	maxvol= max(volume)	# 注意是 int 类型
	axes_2.set_ylim(0, maxvol)


	#	设定 Y 轴上的坐标
	#==================================================================================================================================================
	vollen= len(str(maxvol))

	yMajorLocator_2= MultipleLocator(10**(vollen-1))
	yMinorLocator_2= MultipleLocator((10**(vollen-2))*5)

	# 确定 Y 轴的 MajorFormatter
	#	def y_major_formatter_2(num, pos=None):
	#		numtable= {'1':u'一', '2':u'二', '3':u'三', '4':u'四', '5':u'五', '6':u'六', '7':u'七', '8':u'八', '9':u'九', }
	#		dimtable= {3:u'百', 4:u'千', 5:u'万', 6:u'十万', 7:u'百万', 8:u'千万', 9:u'亿', 10:u'十亿', 11:u'百亿'}
	#		return numtable[str(num)[0]] + dimtable[vollen] if num != 0 else '0'

	def y_major_formatter_2(num, pos=None):
		return int(num)
	yMajorFormatter_2= FuncFormatter(y_major_formatter_2)

	# 确定 Y 轴的 MinorFormatter
	#	def y_minor_formatter_2(num, pos=None):
	#		return int(num)
	#	yMinorFormatter_2= FuncFormatter(y_minor_formatter_2)
	yMinorFormatter_2= NullFormatter()

	# 设定 X 轴的 Locator 和 Formatter
	yaxis_2.set_major_locator(yMajorLocator_2)
	yaxis_2.set_major_formatter(yMajorFormatter_2)

	yaxis_2.set_minor_locator(yMinorLocator_2)
	yaxis_2.set_minor_formatter(yMinorFormatter_2)

	# 设定 Y 轴主要坐标点与辅助坐标点的样式
	for malab in axes_2.get_yticklabels(minor=False):
		malab.set_fontsize(3)

	for milab in axes_2.get_yticklabels(minor=True):
		milab.set_fontsize(2)


	#==================================================================================================================================================
	#==================================================================================================================================================
	#=======	K 线图部分
	#==================================================================================================================================================
	#==================================================================================================================================================

	#	添加 Axes 对象
	#==================================================================================================================================================
	axes_1= figobj.add_axes(rect_1, axis_bgcolor='black', sharex=axes_2)
	axes_1.set_axisbelow(True)	# 网格线放在底层

	if useexpo:
		axes_1.set_yscale('log', basey=expbase)	# 使用对数坐标

	#	改变坐标线的颜色
	#==================================================================================================================================================
	for child in axes_1.get_children():
		if isinstance(child, matplotlib.spines.Spine):
			child.set_color('lightblue')

	#	得到 X 轴 和 Y 轴 的两个 Axis 对象
	#==================================================================================================================================================
	xaxis_1= axes_1.get_xaxis()
	yaxis_1= axes_1.get_yaxis()

	#	设置两个坐标轴上的 grid
	#==================================================================================================================================================
	xaxis_1.grid(True, 'major', color='0.3', linestyle='solid', linewidth=0.2)
	xaxis_1.grid(True, 'minor', color='0.3', linestyle='dotted', linewidth=0.1)

	yaxis_1.grid(True, 'major', color='0.3', linestyle='solid', linewidth=0.2)
	yaxis_1.grid(True, 'minor', color='0.3', linestyle='dotted', linewidth=0.1)


	#==================================================================================================================================================
	#=======	绘图
	#==================================================================================================================================================

	#	绘制 K 线部分
	#==================================================================================================================================================
	rarray_open= numpy.array(pdata[u'开盘'])
	rarray_close= numpy.array(pdata[u'收盘'])
	rarray_high= numpy.array(pdata[u'最高'])
	rarray_low= numpy.array(pdata[u'最低'])

	# XXX: 如果 up, down, side 里有一个全部为 False 组成,那么 vlines() 会报错。
	if True in up:
		axes_1.vlines(xindex[up], rarray_low[up], rarray_high[up], color='red', linewidth=0.6, label='_nolegend_')
		axes_1.vlines(xindex[up], rarray_open[up], rarray_close[up], color='red', linewidth=3.0, label='_nolegend_')
	if True in down:
		axes_1.vlines(xindex[down], rarray_low[down], rarray_high[down], color='green', linewidth=0.6, label='_nolegend_')
		axes_1.vlines(xindex[down], rarray_open[down], rarray_close[down], color='green', linewidth=3.0, label='_nolegend_')
	if True in side:
		axes_1.vlines(xindex[side], rarray_low[side], rarray_high[side], color='0.7', linewidth=0.6, label='_nolegend_')
		axes_1.vlines(xindex[side], rarray_open[side], rarray_close[side], color='0.7', linewidth=3.0, label='_nolegend_')

	#	绘制均线部分
	#==================================================================================================================================================
	rarray_1dayave= numpy.array(pdata[u'1日权均'])
	rarray_5dayave= numpy.array(pdata[u'5日均'])
	rarray_30dayave= numpy.array(pdata[u'30日均'])

	axes_1.plot(xindex, rarray_1dayave, 'o-', color='white', linewidth=0.1, markersize=0.7, markeredgecolor='white', markeredgewidth=0.1)	# 1日加权均线
	axes_1.plot(xindex, rarray_5dayave, 'o-', color='yellow', linewidth=0.1, markersize=0.7, markeredgecolor='yellow', markeredgewidth=0.1)	# 5日均线
	axes_1.plot(xindex, rarray_30dayave, 'o-', color='green', linewidth=0.1, markersize=0.7, markeredgecolor='green', markeredgewidth=0.1)	# 30日均线

	#	设定 X 轴坐标的范围
	#==================================================================================================================================================
	axes_1.set_xlim(-1, length)


	#	先设置 label 位置,再将 X 轴上的坐标设为不可见。因为与 成交量子图 共用 X 轴
	#==================================================================================================================================================

	# 设定 X 轴的 Locator 和 Formatter
	xaxis_1.set_major_locator(xMajorLocator)
	xaxis_1.set_major_formatter(xMajorFormatter)

	xaxis_1.set_minor_locator(xMinorLocator)
	xaxis_1.set_minor_formatter(xMinorFormatter)

	# 将 X 轴上的坐标设为不可见。
	for malab in axes_1.get_xticklabels(minor=False):
		malab.set_visible(False)

	for milab in axes_1.get_xticklabels(minor=True):
		milab.set_visible(False)

	# 用这一段效果也一样
	#	pyplot.setp(axes_1.get_xticklabels(minor=False), visible=False)
	#	pyplot.setp(axes_1.get_xticklabels(minor=True), visible=False)


	#	设定 Y 轴坐标的范围
	#==================================================================================================================================================
	axes_1.set_ylim(ylowlim_price, yhighlim_price)


	#	设定 Y 轴上的坐标
	#==================================================================================================================================================

	if useexpo:
		#	主要坐标点
		#-----------------------------------------------------
		yMajorLocator_1= LogLocator(base=expbase)

		yMajorFormatter_1= NullFormatter()

		# 设定 X 轴的 Locator 和 Formatter
		yaxis_1.set_major_locator(yMajorLocator_1)
		yaxis_1.set_major_formatter(yMajorFormatter_1)

		# 设定 Y 轴主要坐标点与辅助坐标点的样式
		#	for mal in axes_1.get_yticklabels(minor=False):
		#		mal.set_fontsize(3)

		#	辅助坐标点
		#-----------------------------------------------------
		minorticks= range(int(ylowlim_price), int(yhighlim_price)+1, 100)

		yMinorLocator_1= FixedLocator(numpy.array(minorticks))

		# 确定 Y 轴的 MinorFormatter
		def y_minor_formatter_1(num, pos=None):
			return str(num/100.0) + '0'

		yMinorFormatter_1= FuncFormatter(y_minor_formatter_1)

		# 设定 X 轴的 Locator 和 Formatter
		yaxis_1.set_minor_locator(yMinorLocator_1)
		yaxis_1.set_minor_formatter(yMinorFormatter_1)

		# 设定 Y 轴主要坐标点与辅助坐标点的样式
		for mil in axes_1.get_yticklabels(minor=True):
			mil.set_fontsize(3)

	else:	# 如果使用线性坐标,那么只标主要坐标点
		yMajorLocator_1= MultipleLocator(100)

		def y_major_formatter_1(num, pos=None):
			return str(num/100.0) + '0'

		yMajorFormatter_1= FuncFormatter(y_major_formatter_1)

		# 设定 Y 轴的 Locator 和 Formatter
		yaxis_1.set_major_locator(yMajorLocator_1)
		yaxis_1.set_major_formatter(yMajorFormatter_1)

		# 设定 Y 轴主要坐标点与辅助坐标点的样式
		for mal in axes_1.get_yticklabels(minor=False):
			mal.set_fontsize(3)


	#	保存图片
	#==================================================================================================================================================
	figobj.savefig(figpath, dpi=figdpi, facecolor=figfacecolor, edgecolor=figedgecolor, linewidth=figlinewidth)


if __name__ == '__main__':
	Plot(pfile=sys.argv[1], figpath=sys.argv[2], useexpo=True)
用 Python / Matplotlib 画出来的股票 K线图
---- 过年后开始真正学用 Matplotlib 画一些实际的图形,以下是最新的改进结果:
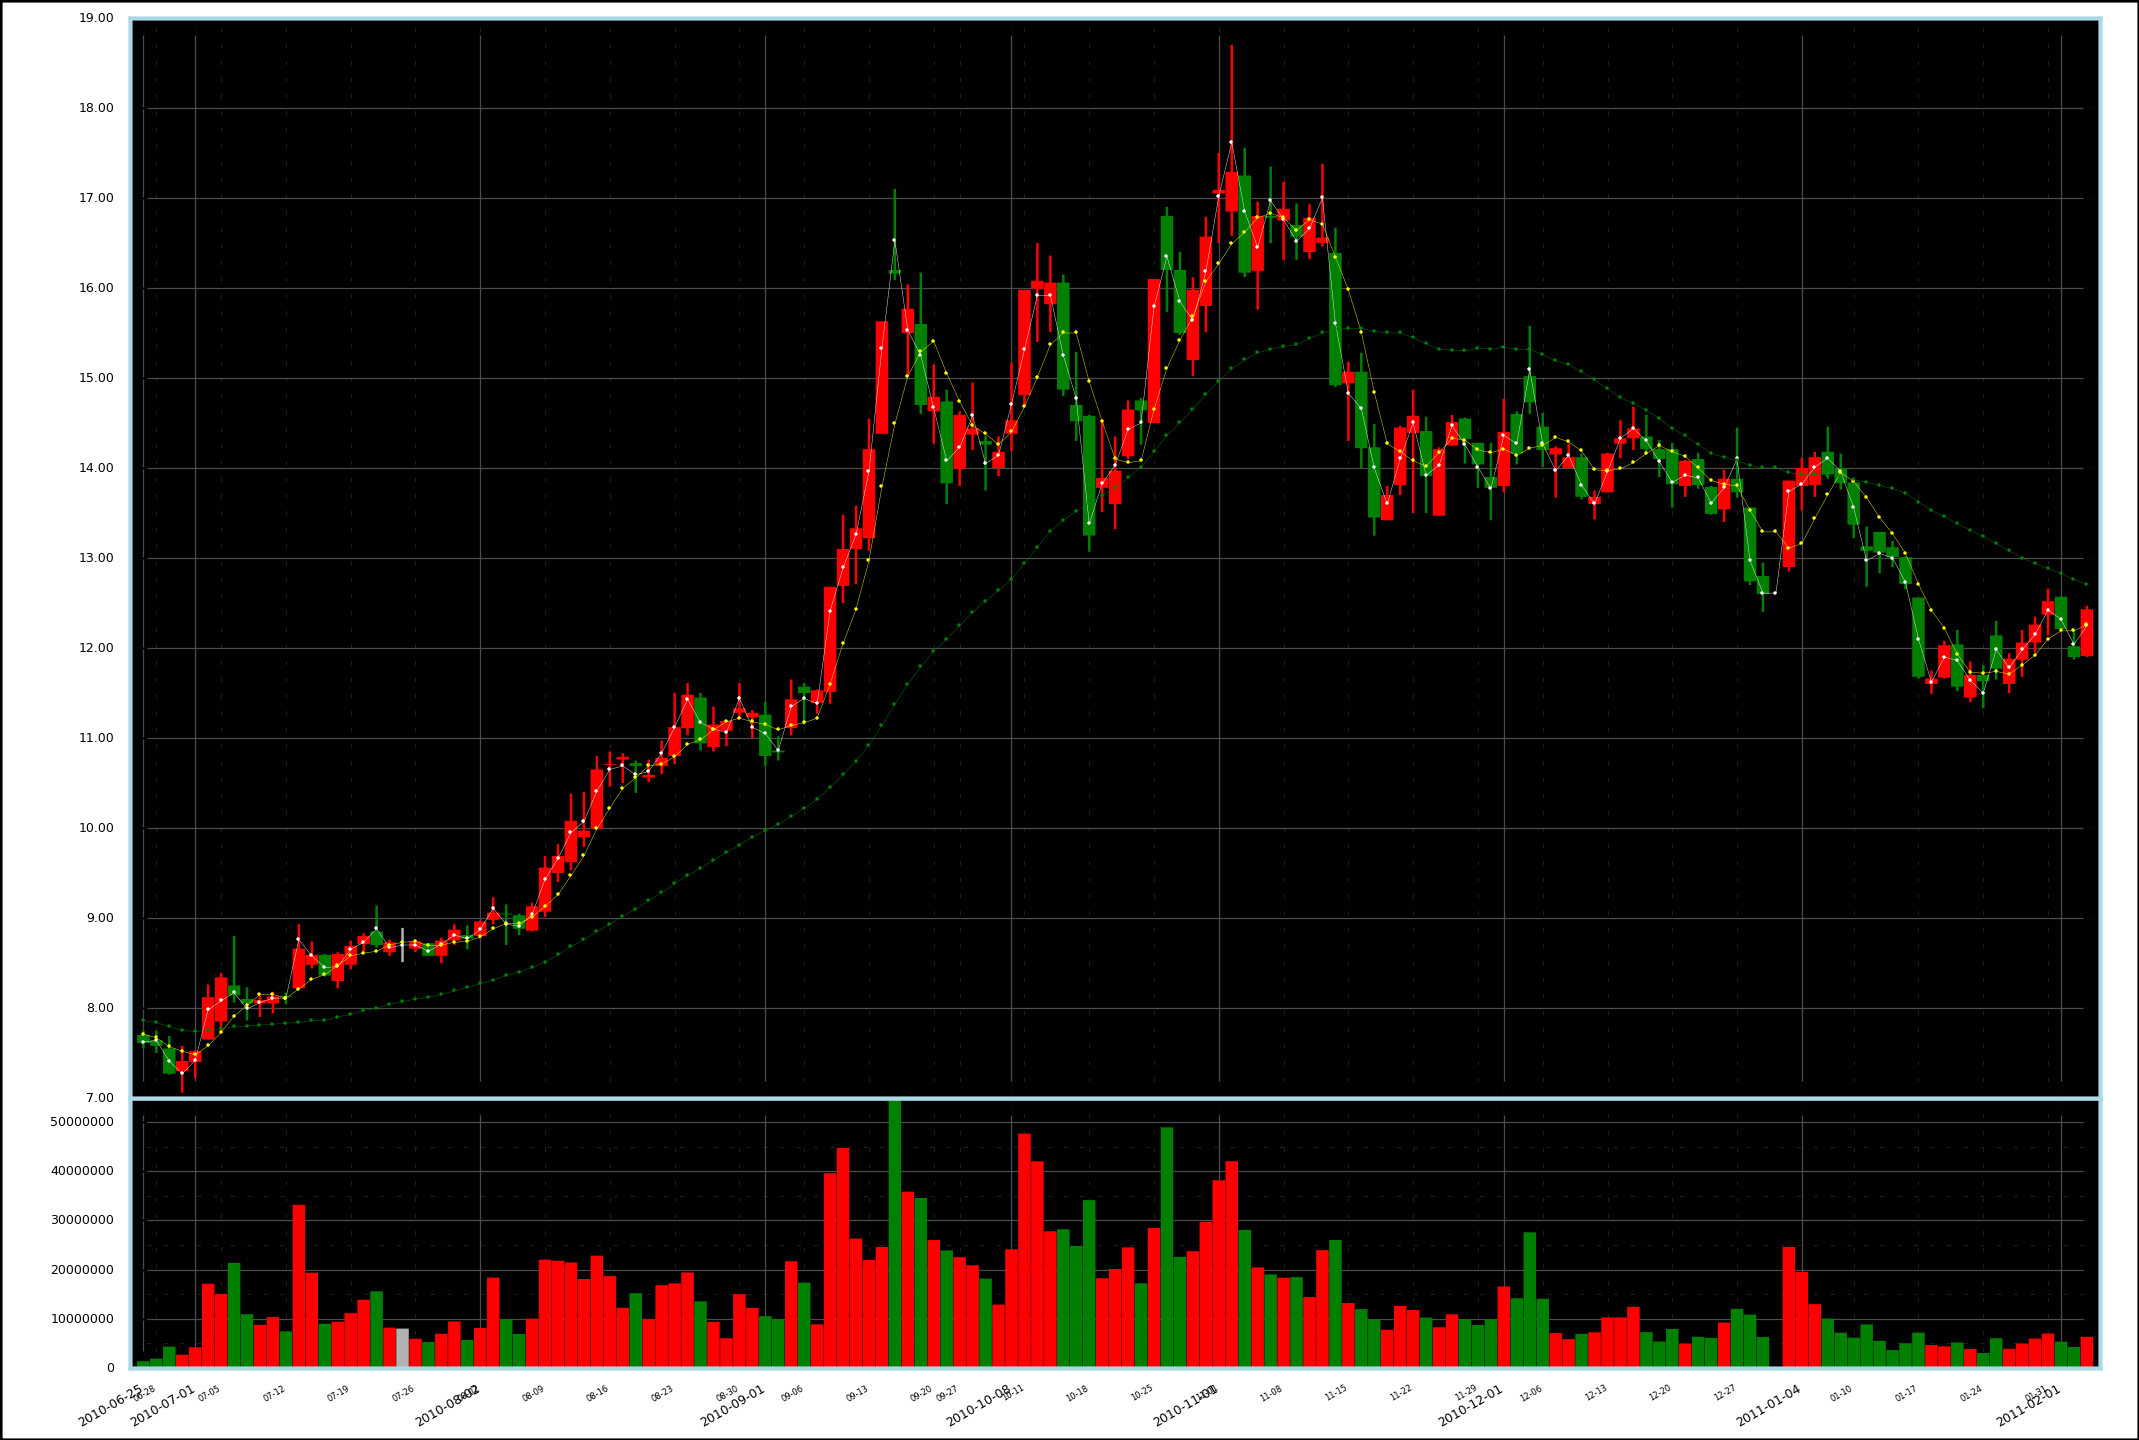
---- 股票是 600644,原始数据来自网络。就不总结要点了,Matplotlib 十分给力!
---- 下一步打算在标示价格的 Y 轴上使用对数坐标。得精确计算图片的尺寸,使代表相同涨幅的图线看起来具有相同的长度,而且要精确定位坐标点。另外还可以加上一定的注释和图例。
补记:已实现,如下图,注意 Y 轴对数坐标: