用 Python / Matplotlib 画出来的股票 K线图 (三) - Jacky Liu's Blog
用 Python / Matplotlib 画出来的股票 K线图 (三)
Jacky Liu
posted @ 2011年11月28日 08:38
in Python
with tags
candlestick chart Matplotlib python stock 股票 financial
, 34012 阅读
---- 前一篇在这: 用 Python / Matplotlib 画出来的股票 K线图 (二)
---- 后一篇在这: 用 Python / Matplotlib 画出来的股票 K线图 (四)
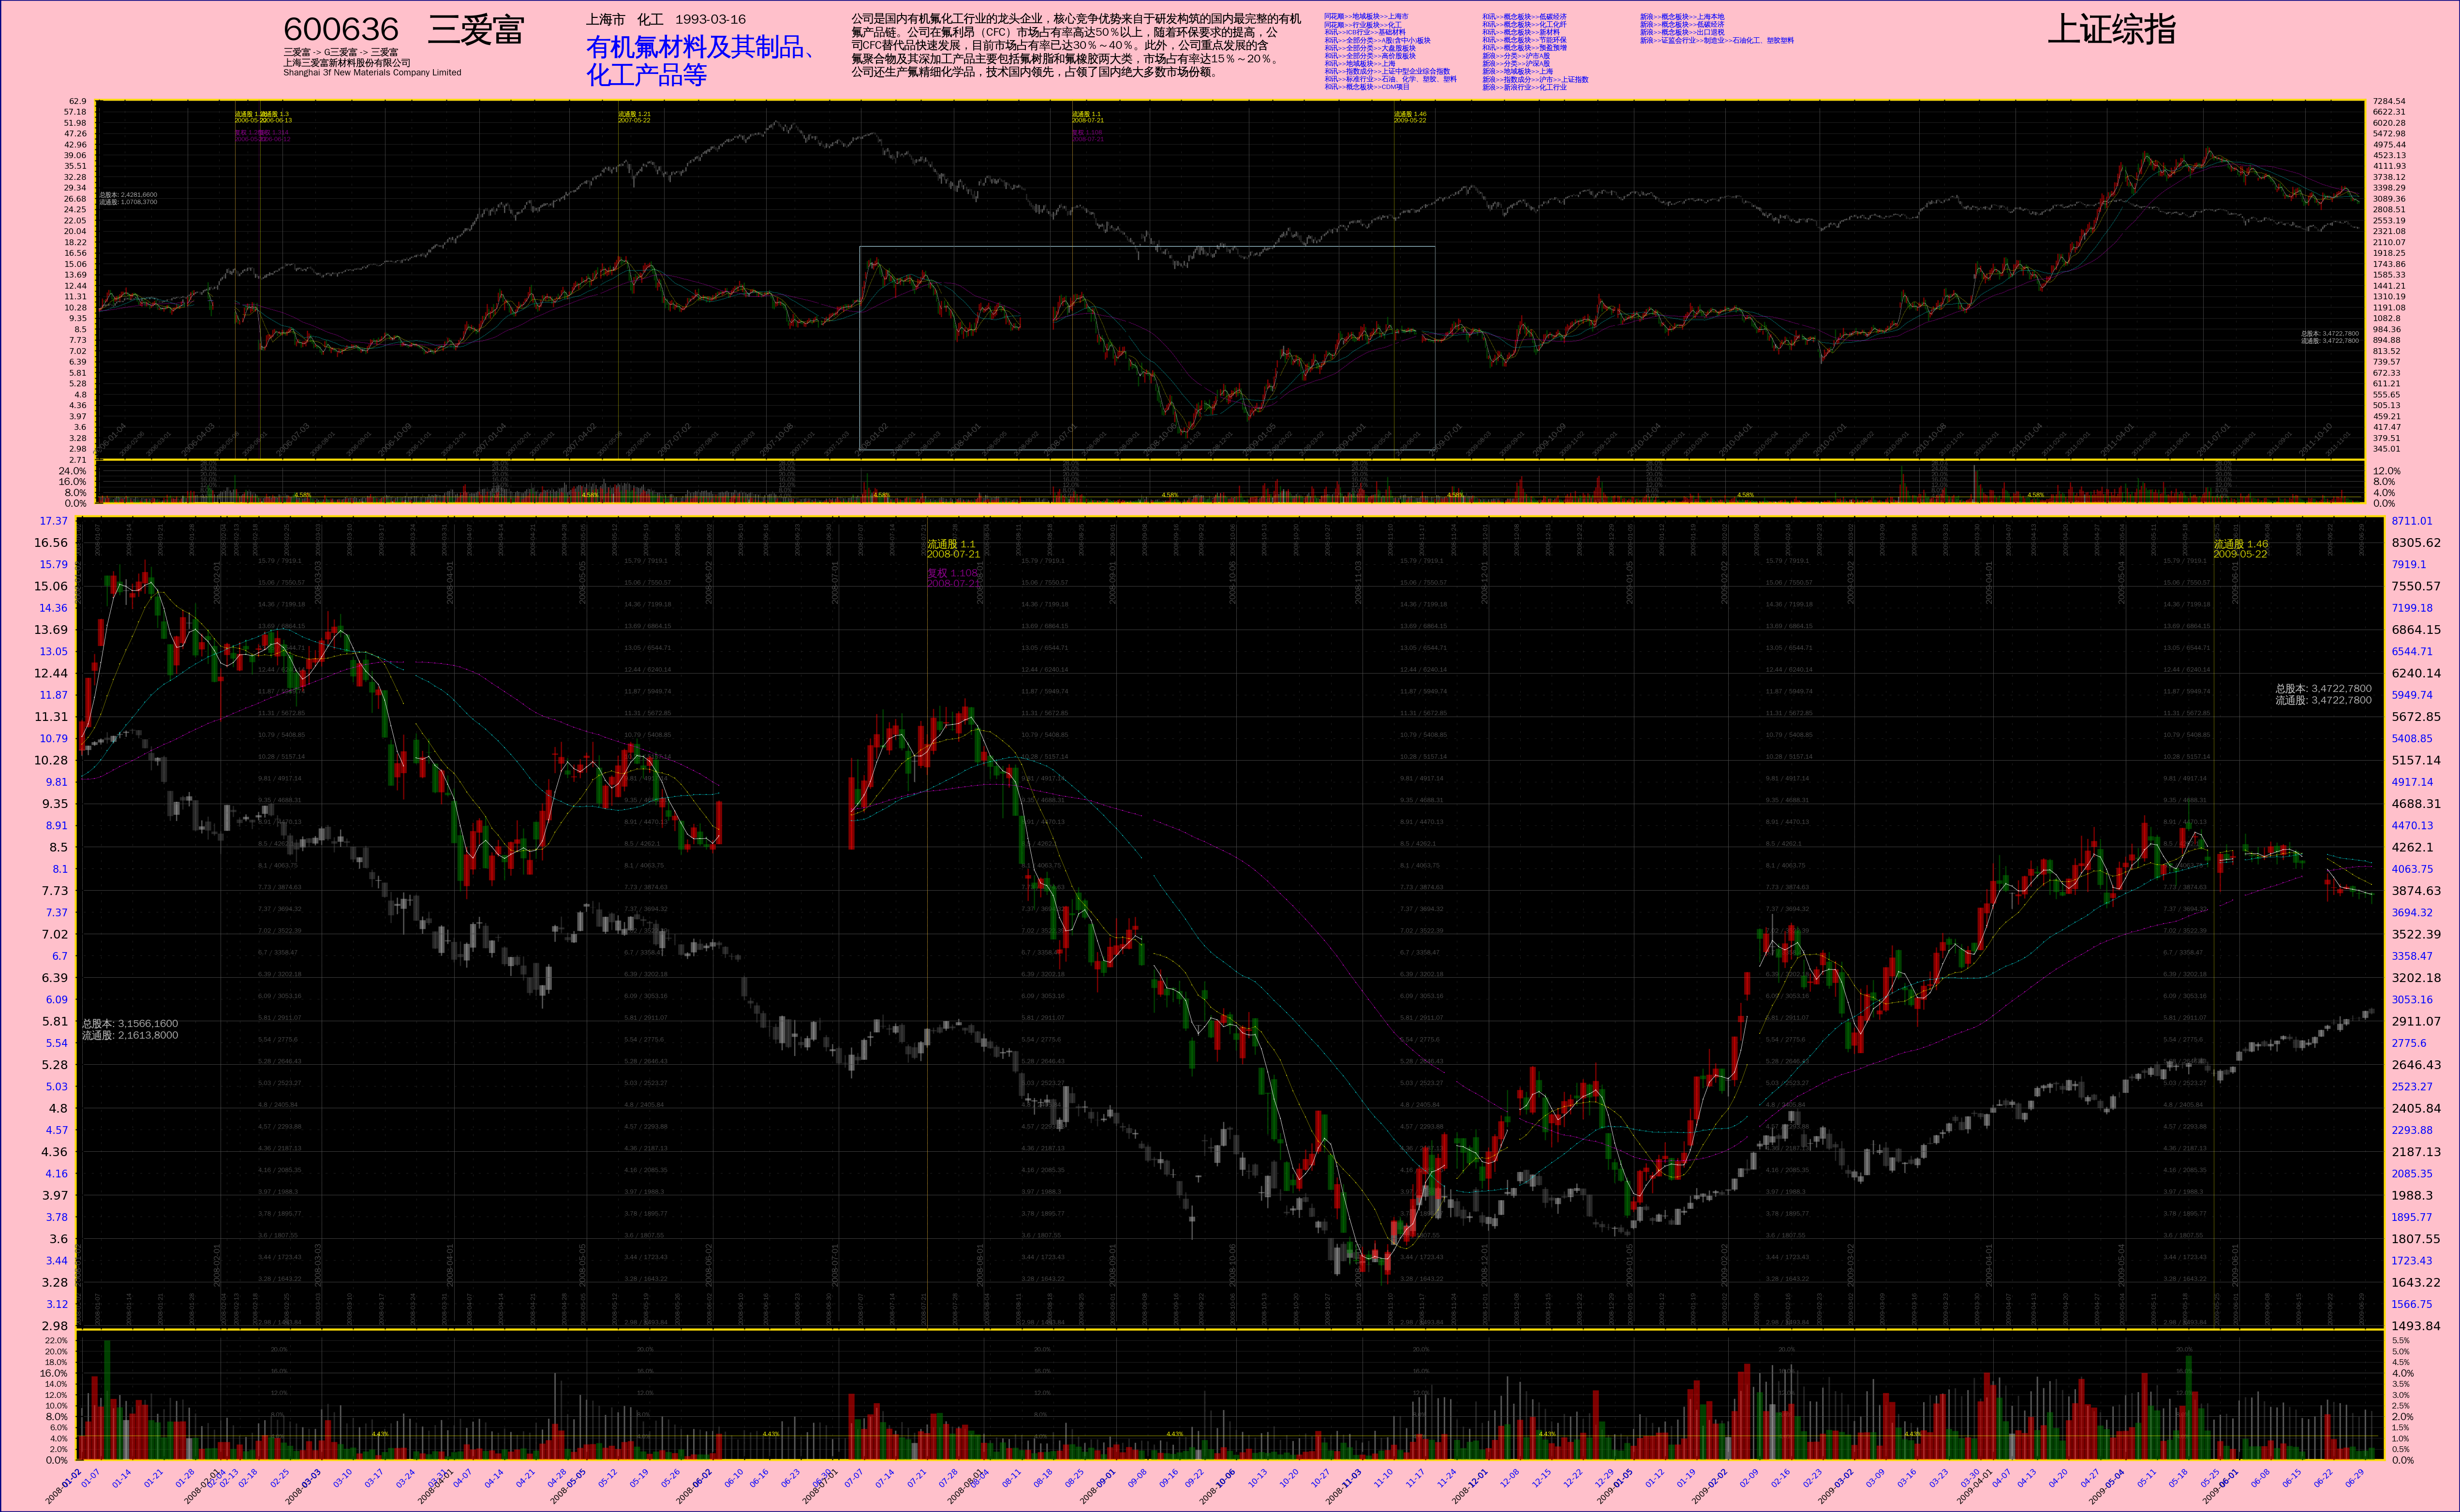
---- 就像上回说的,新内容加进来。除此之外,与上一版代码相比最大的改动就是内部重构过,子图全部定义成 class。图中一共包含 5 个子图,从上到下依次是: 基本信息(就是那些文字)、历史价格、历史换手率、价格、换手率。通过输入的绘图数据进行控制,任何一个子图都可以关闭,关闭子图可以节省绘图时间和存储空间。本来还有一个财务信息子图要加进去,但是现在想暂时告一段落,先弄点其它的。
---- 作为输入的 Python pickle file 在 这里。
---- 最后是脚本,仍然是 Python 2 的:
# -*- coding: utf-8 -*-
import os
import sys
import pickle
import math
import datetime
import itertools
import matplotlib
matplotlib.use("WXAgg", warn=True) # 这个要紧跟在 import matplotlib 之后,而且必须安装了 wxpython 2.8 才行。
import matplotlib.pyplot as pyplot
import matplotlib.font_manager as font_manager
import numpy
from matplotlib.ticker import NullLocator, FixedLocator, MultipleLocator, FuncFormatter, NullFormatter
from matplotlib.patches import Ellipse
__font_properties__= font_manager.FontProperties(fname='/usr/share/fonts/truetype/wqy/wqy-zenhei.ttc')
__color_lightsalmon__= '#ffa07a'
__color_pink__= '#ffc0cb'
__color_navy__= '#000080'
__color_gold__= '#FDDB05'
__color_gray30__= '0.3'
__color_gray70__= '0.7'
__color_lightblue__= 'lightblue'
__shrink__= 1.0 / 4
__expbase__= 1.1
class SubPlot_BasicInfo:
'''
公司的基本信息
Note: this is not "real" subplot, no Axes object contained.
'''
def __init__(self, pdata, parent, name):
self._name= name
self._pdata= pdata
self._cominfo= self._pdata[u'公司信息']
self._parent= parent
self._Axes= None
self._xsize, \
self._ysize= self._compute_size()
def _compute_size(self):
return (300.0, 1.8)
def get_size(self):
return (self._xsize, self._ysize)
def build_axes(self, figobj, rect):
axes= figobj.add_axes(rect)
axes.set_frame_on(False)
self._Axes= axes
self.set_xticks()
self.set_yticks()
def set_xticks(self):
axes= self._Axes
xaxis= axes.get_xaxis()
# 设定 X 轴坐标的范围
#==================================================================================================================================================
axes.set_xlim(0, self._xsize)
xaxis.set_major_locator(NullLocator())
for mal in axes.get_xticklabels(minor=False):
mal.set_visible(False)
for mil in axes.get_xticklabels(minor=True):
mil.set_visible(False)
def set_yticks(self):
axes= self._Axes
yaxis= axes.get_yaxis()
# 设定 X 轴坐标的范围
#==================================================================================================================================================
axes.set_ylim(0, self._ysize)
yaxis.set_major_locator(NullLocator())
for mal in axes.get_yticklabels(minor=False):
mal.set_visible(False)
for mil in axes.get_yticklabels(minor=True):
mil.set_visible(False)
def plot(self):
self.plot_codesymbol(xbase=0.0, ybase=self._ysize)
self.plot_codesymbol_2(xbase=self._xsize, ybase=self._ysize)
self.plot_companyname(xbase=0.0, ybase=self._ysize-0.8)
self.plot_companylocation(xbase=48.0, ybase=self._ysize)
self.plot_mainbusiness(xbase=48.0, ybase=self._ysize)
self.plot_description(xbase=90.0, ybase=self._ysize)
self.plot_sortinginfo(xbase=165.0, ybase=self._ysize)
def plot_codesymbol(self, xbase, ybase):
'''
交易代码、公司简称
'''
txtstr= self._cominfo[u'代码'] + u' ' + self._cominfo[u'简称']
label= self._Axes.text(xbase, ybase, txtstr, fontproperties=__font_properties__, verticalalignment='top', horizontalalignment='left')
label.set_fontsize(16.0)
def plot_codesymbol_2(self, xbase, ybase):
txtstr= self._cominfo[u'简称二']
label= self._Axes.text(xbase, ybase, txtstr, fontproperties=__font_properties__, verticalalignment='top', horizontalalignment='right')
label.set_fontsize(16.0)
def plot_companyname(self, xbase, ybase):
'''
曾用名、全名、英文名
'''
txtstr= self._cominfo[u'基本情况'][u'曾用名']
txtlist= txtstr.split('->')
if len(txtlist) > 15:
txtstr= ' -> '.join(txtlist[:5]) + ' ->\n' + ' -> '.join(txtlist[5:10]) + ' ->\n' + ' -> '.join(txtlist[10:15]) + ' ->\n' + ' -> '.join(txtlist[15:]) + '\n'
elif len(txtlist) > 10:
txtstr= ' -> '.join(txtlist[:5]) + ' ->\n' + ' -> '.join(txtlist[5:10]) + ' ->\n' + ' -> '.join(txtlist[10:]) + '\n'
elif len(txtlist) > 5:
txtstr= ' -> '.join(txtlist[:5]) + ' ->\n' + ' -> '.join(txtlist[5:]) + '\n'
else:
txtstr= ' -> '.join(txtlist) + '\n'
txtstr += self._cominfo[u'基本情况'][u'公司名称'] + '\n'
txtstr += self._cominfo[u'基本情况'][u'英文名称']
label= self._Axes.text(xbase, ybase, txtstr, fontproperties=__font_properties__, verticalalignment='top', horizontalalignment='left')
label.set_fontsize(4.5)
def plot_companylocation(self, xbase, ybase):
'''
地域、所属行业、上市日期
'''
txtstr= self._cominfo[u'公司概况'][u'区域'] + ' ' + self._cominfo[u'公司概况'][u'所属行业'] + ' ' + self._cominfo[u'发行相关'][u'上市日期']
label= self._Axes.text(xbase, ybase, txtstr, fontproperties=__font_properties__, verticalalignment='top', horizontalalignment='left')
label.set_fontsize(6.5)
def plot_mainbusiness(self, xbase, ybase):
'''
主营业务
'''
# 查找表: (<文字长度>, <每行字数>, <字体大小>, <Y轴偏移量>)
lookups= (
(20, 10, 12.0, 0.5),
(45, 15, 8.2, 0.5),
(80, 20, 6.2, 0.5),
(125, 25, 5.0, 0.5),
(180, 30, 4.1, 0.5),
(245, 35, 3.5, 0.4),
(999999, 37, 3.4, 0.4)
)
txtstr= self._cominfo[u'基本情况'][u'主营业务']
length= len(txtstr)
for sizelimit, linelimit, fontsize, yshift in lookups:
if length <= sizelimit:
txtstr= '\n'.join([txtstr[linelimit*idx : linelimit*(idx+1)] for idx in range(length//linelimit + 1)])
fsize= fontsize
ycoord= ybase - yshift
break
label= self._Axes.text(xbase, ycoord, txtstr, fontproperties=__font_properties__, verticalalignment='top', horizontalalignment='left', color='blue')
label.set_fontsize(fsize)
def plot_description(self, xbase, ybase):
'''
公司简介
'''
# 查找表: (<文字长度>, <每行字数>, <字体大小>)
lookups= (
(150, 30, 7.0),
(240, 40, 5.6),
(329, 47, 4.8),
(432, 54, 4.2),
(576, 64, 3.5),
(670, 67, 3.4),
(792, 72, 3.1),
(960, 80, 2.8),
(1222, 94, 2.4),
(1428, 102, 2.26),
(1620, 108, 2.12),
(1938, 114, 2.00),
(999999, 130, 1.75)
)
txtstr= self._cominfo[u'公司概况'][u'公司简介'] # 26 ~ 2600 字符
length= len(txtstr)
for sizelimit, linelimit, fontsize in lookups:
if length <= sizelimit:
txtstr= '\n'.join([txtstr[linelimit*idx : linelimit*(idx+1)] for idx in range(length//linelimit + 1)])
fsize= fontsize
break
label= self._Axes.text(xbase, ybase, txtstr, fontproperties=__font_properties__, verticalalignment='top', horizontalalignment='left')
label.set_fontsize(fsize)
def plot_sortinginfo(self, xbase, ybase):
'''
行业板块信息
'''
infolist= self._cominfo[u'行业板块']
for idx in range(len(infolist)//10 + 1):
txtstr= '\n'.join(infolist[10*idx : 10*(idx+1)])
if not txtstr:
break
xcoord= xbase + 25.0*idx
label= self._Axes.text(xcoord, ybase, txtstr, fontproperties=__font_properties__, verticalalignment='top', horizontalalignment='left', color='blue')
label.set_fontsize(3.4)
class SubPlot_Financial:
'''
换手率子图
'''
pass
class SubPlot_PriceBase:
'''
'''
def __init__(self, pdata, parent, xparams, name):
'''
'''
self._name= name # 派生类自己设置
self._pdata= pdata
self._parent= parent
self._expbase= __expbase__
self._xparams= xparams
self._shrink= __shrink__ if name == 'pricefs' else 1.0
# 绘图数据
quotes= pdata[u'行情']
if name == 'pricefs':
self._dates= quotes[u'日期']
self._open= quotes[u'开盘']
self._close= quotes[u'收盘']
self._high= quotes[u'最高']
self._low= quotes[u'最低']
if u'简化' in quotes: self._simple= quotes[u'简化']
# if u'换手率' in quotes: self._torate= quotes[u'换手率']
# if u'成交量' in quotes: self._volume= quotes[u'成交量']
# if u'成交额' in quotes: self._turnover= quotes[u'成交额']
if u'3日均' in quotes: self._average3= quotes[u'3日均']
if u'5日均' in quotes: self._average5= quotes[u'5日均']
if u'10日均' in quotes: self._average10= quotes[u'10日均']
if u'30日均' in quotes: self._average30= quotes[u'30日均']
if u'60日均' in quotes: self._average60= quotes[u'60日均']
if u'开盘二' in quotes:
self._open_2= quotes[u'开盘二']
self._close_2= quotes[u'收盘二']
self._high_2= quotes[u'最高二']
self._low_2= quotes[u'最低二']
if u'简化二' in quotes: self._simple_2= quotes[u'简化二']
# if u'换手率二' in quotes: self._torate_2= quotes[u'换手率二']
# if u'成交量二' in quotes: self._volume_2= quotes[u'成交量二']
# if u'成交额二' in quotes: self._turnover_2= quotes[u'成交额二']
if u'3日均二' in quotes: self._average3_2= quotes[u'3日均二']
if u'5日均二' in quotes: self._average5_2= quotes[u'5日均二']
if u'10日均二' in quotes: self._average10_2= quotes[u'10日均二']
if u'30日均二' in quotes: self._average30_2= quotes[u'30日均二']
if u'60日均二' in quotes: self._average60_2= quotes[u'60日均二']
else:
sidx, eidx= pdata[u'任务描述'][u'起始偏移'], pdata[u'任务描述'][u'结束偏移']
self._dates= quotes[u'日期'][sidx:eidx]
self._open= quotes[u'开盘'][sidx:eidx]
self._close= quotes[u'收盘'][sidx:eidx]
self._high= quotes[u'最高'][sidx:eidx]
self._low= quotes[u'最低'][sidx:eidx]
if u'简化' in quotes: self._simple= quotes[u'简化'][sidx:eidx]
# if u'换手率' in quotes: self._torate= quotes[u'换手率'][sidx:eidx]
# if u'成交量' in quotes: self._volume= quotes[u'成交量'][sidx:eidx]
# if u'成交额' in quotes: self._turnover= quotes[u'成交额'][sidx:eidx]
if u'3日均' in quotes: self._average3= quotes[u'3日均'][sidx:eidx]
if u'5日均' in quotes: self._average5= quotes[u'5日均'][sidx:eidx]
if u'10日均' in quotes: self._average10= quotes[u'10日均'][sidx:eidx]
if u'30日均' in quotes: self._average30= quotes[u'30日均'][sidx:eidx]
if u'60日均' in quotes: self._average60= quotes[u'60日均'][sidx:eidx]
if u'开盘二' in quotes:
self._open_2= quotes[u'开盘二'][sidx:eidx]
self._close_2= quotes[u'收盘二'][sidx:eidx]
self._high_2= quotes[u'最高二'][sidx:eidx]
self._low_2= quotes[u'最低二'][sidx:eidx]
if u'简化二' in quotes: self._simple_2= quotes[u'简化二'][sidx:eidx]
# if u'换手率二' in quotes: self._torate_2= quotes[u'换手率二'][sidx:eidx]
# if u'成交量二' in quotes: self._volume_2= quotes[u'成交量二'][sidx:eidx]
# if u'成交额二' in quotes: self._turnover_2= quotes[u'成交额二'][sidx:eidx]
if u'3日均二' in quotes: self._average3_2= quotes[u'3日均二'][sidx:eidx]
if u'5日均二' in quotes: self._average5_2= quotes[u'5日均二'][sidx:eidx]
if u'10日均二' in quotes: self._average10_2= quotes[u'10日均二'][sidx:eidx]
if u'30日均二' in quotes: self._average30_2= quotes[u'30日均二'][sidx:eidx]
if u'60日均二' in quotes: self._average60_2= quotes[u'60日均二'][sidx:eidx]
self._length= len(self._dates) # XXX: 由派生类设定
# 衍生数据
#==============================================================================================================
self._xindex= numpy.arange(self._length) # X 轴上的 index,一个辅助数据
self._zipoc= zip(self._open, self._close)
self._up= numpy.array( [ True if po < pc and po is not None else False for po, pc in self._zipoc] ) # 标示出该天股价日内上涨的一个序列
self._down= numpy.array( [ True if po > pc and po is not None else False for po, pc in self._zipoc] ) # 标示出该天股价日内下跌的一个序列
self._side= numpy.array( [ True if po == pc and po is not None else False for po, pc in self._zipoc] ) # 标示出该天股价日内走平的一个序列
if u'开盘二' in quotes:
self._zipoc_2= zip(self._open_2, self._close_2)
self._up_2= numpy.array( [ True if po < pc and po is not None else False for po, pc in self._zipoc_2] ) # 标示出该天股价日内上涨的一个序列
self._down_2= numpy.array( [ True if po > pc and po is not None else False for po, pc in self._zipoc_2] ) # 标示出该天股价日内下跌的一个序列
self._side_2= numpy.array( [ True if po == pc and po is not None else False for po, pc in self._zipoc_2] ) # 标示出该天股价日内走平的一个序列
self._Axes= None
self._AxisX= None
self._AxisY= None
self._xsize= 0.0
self._ysize= 0.0
self._yhighlim= 0 # Y 轴最大坐标
self._ylowlim= 0 # Y 轴最小坐标
if u'开盘二' in self._pdata[u'行情']:
self._Axes_2= None # 如果有第二个行情数据,就建立另一个 Axes 对象
self._AxisX_2= None
self._AxisY_2= None
self._yhighlim_2= 0 # Y 轴最大坐标
self._ylowlim_2= 0 # Y 轴最小坐标
self._compute_size()
self._ytickset= self._compute_ytickset() # 需放在前一句后面
def _compute_size(self):
'''
根据绘图数据 pdata 计算出本子图的尺寸,修改数据成员
'''
quotes= self._pdata[u'行情']
popen= self._open[0] # int 类型
phigh= max( [ph for ph in self._high if ph is not None] ) # 最高价
plow= min( [pl for pl in self._low if pl is not None] ) # 最低价
# Y 轴范围
if self._name == 'pricefs':
yhighlim= phigh * 1.2 # K线子图 Y 轴最大坐标
ylowlim= plow / 1.2 # K线子图 Y 轴最小坐标
else:
yhighlim= phigh * 1.1 # K线子图 Y 轴最大坐标
ylowlim= plow / 1.1 # K线子图 Y 轴最小坐标
self._yhighlim= yhighlim
self._ylowlim= ylowlim
if u'开盘二' in quotes:
popen_2= self._open_2[0] # 同上
phigh_2= max( [ph for ph in self._high_2 if ph is not None] ) # 第二个行情的最高价
phigh= max(phigh, int(phigh_2 * popen / float(popen_2))) # 以第一个行情为基准修正出的总最高价
plow_2= min( [pl for pl in self._low_2 if pl is not None] ) # 最低价
plow= min(plow, int(plow_2 * popen / float(popen_2))) # 以第一个行情为基准修正出的总最低价
if self._name == 'pricefs':
yhighlim= phigh * 1.2 # K线子图 Y 轴最大坐标
ylowlim= plow / 1.2 # K线子图 Y 轴最小坐标
else:
yhighlim= phigh * 1.1 # K线子图 Y 轴最大坐标
ylowlim= plow / 1.1 # K线子图 Y 轴最小坐标
ylowlim_2= ylowlim * popen_2 / float(popen)
yhighlim_2= yhighlim * popen_2 / float(popen)
self._yhighlim= yhighlim
self._ylowlim= ylowlim
self._yhighlim_2= yhighlim_2
self._ylowlim_2= ylowlim_2
# XXX: 价格在 Y 轴上的 “份数”。注意,虽然最高与最低价是以第一个行情为基准修正出来的,但其中包含的倍数因子对结果无影响,即:
# log(base, num1) - log(base, num2) ==
# log(base, num1/num2) ==
# log(base, k*num1/k*num2) ==
# log(base, k*num1) - log(base, k*num2)
# ,这是对数运算的性质。
xmargin= self._xparams['xmargin']
self._xsize= (self._length + xmargin*2) * self._shrink # int, 所有数据的长度,就是天数
self._ysize= (math.log(yhighlim, self._expbase) - math.log(ylowlim, self._expbase)) * self._shrink # float
def get_size(self):
return (self._xsize, self._ysize)
def get_ylimits(self):
return (self._yhighlim, self._ylowlim)
def build_axes(self, figobj, rect):
'''
初始化 self._Axes 对象
'''
# 添加 Axes 对象
#==================================================================================================================================================
if self._name == 'price' and 'torate' in self._parent._subplots:
sharex= self._parent._subplots['torate'].get_axes()
axes= figobj.add_axes(rect, axis_bgcolor='black', sharex=sharex)
elif self._name == 'pricefs' and 'toratefs' in self._parent._subplots:
sharex= self._parent._subplots['toratefs'].get_axes()
axes= figobj.add_axes(rect, axis_bgcolor='black', sharex=sharex)
else:
axes= figobj.add_axes(rect, axis_bgcolor='black')
axes.set_axisbelow(True) # 网格线放在底层
# axes.set_zorder(1) # XXX: 不顶用
# axes.patch.set_visible(False) # hide the 'canvas'
axes.set_yscale('log', basey=self._expbase) # 使用对数坐标
# 改变坐标线的颜色
#==================================================================================================================================================
for child in axes.get_children():
if isinstance(child, matplotlib.spines.Spine):
child.set_color(__color_gold__)
# 得到 X 轴 和 Y 轴 的两个 Axis 对象
#==================================================================================================================================================
xaxis= axes.get_xaxis()
yaxis= axes.get_yaxis()
# 设置两个坐标轴上的网格线
#==================================================================================================================================================
xaxis.grid(True, 'major', color='0.3', linestyle='solid', linewidth=0.2)
xaxis.grid(True, 'minor', color='0.3', linestyle='dotted', linewidth=0.1)
if self._name == 'pricefs': # 如果是小图,就不设辅助网格线
yaxis.grid(True, 'major', color='0.3', linestyle='solid', linewidth=0.1)
else:
yaxis.grid(True, 'major', color='0.3', linestyle='solid', linewidth=0.2)
yaxis.grid(True, 'minor', color='0.3', linestyle='dotted', linewidth=0.1)
yaxis.set_label_position('left')
self._Axes= axes
self._AxisX= xaxis
self._AxisY= yaxis
if u'开盘二' in self._pdata[u'行情']:
# 添加 Axes 对象。注意,设置 axes_2 而不是 axes 的网格线,从而不会跑到 axes 边框上边的做法不顶用。
#==================================================================================================================================================
axes_2= axes.twinx() # twinx is problematic, no use no more.
# XXX: 下面这三行把第一个 axes 放在上面,这样不会被第二个 axes 的图形遮盖。用 zorder 不顶用。
axes.figure.axes[-2:]= [axes_2, axes] # XXX:
axes.set_frame_on(False) # 如果不做此设定,axes_2 的内容会看不见
axes_2.set_frame_on(True)
axes_2.set_axis_bgcolor('black')
axes_2.set_axisbelow(True) # 网格线放在底层
axes_2.set_yscale('log', basey=self._expbase) # 使用对数坐标
# 改变坐标线的颜色
#==================================================================================================================================================
for child in axes_2.get_children():
if isinstance(child, matplotlib.spines.Spine):
child.set_color(__color_gold__)
# 得到 X 轴 和 Y 轴 的两个 Axis 对象
#==================================================================================================================================================
xaxis_2= axes_2.get_xaxis()
yaxis_2= axes_2.get_yaxis()
# 设置两个坐标轴上的网格线
#==================================================================================================================================================
# xaxis_2.grid(True, 'major', color='0.3', linestyle='solid', linewidth=0.2)
# xaxis_2.grid(True, 'minor', color='0.3', linestyle='dotted', linewidth=0.1)
# if self._name == 'pricefs': # 如果是小图,就不设辅助网格线
# yaxis_2.grid(True, 'major', color='0.3', linestyle='solid', linewidth=0.1)
# else:
# yaxis_2.grid(True, 'major', color='0.3', linestyle='solid', linewidth=0.2)
# yaxis_2.grid(True, 'minor', color='0.3', linestyle='dotted', linewidth=0.1)
yaxis_2.set_label_position('right')
self._Axes_2= axes_2
self._AxisX_2= xaxis_2
self._AxisY_2= yaxis_2
def set_xticks(self):
xMajorLocator= self._xparams['xMajorLocator']
xMinorLocator= self._xparams['xMinorLocator']
axes= self._Axes
xaxis= self._AxisX
# 设定 X 轴坐标的范围
#==================================================================================================================================================
xmargin= self._xparams['xmargin']
axes.set_xlim(-xmargin, self._length + xmargin)
# 先设置 label 位置,再将 X 轴上的坐标设为不可见。因为与 成交量子图 共用 X 轴
#==================================================================================================================================================
# 设定 X 轴的 Locator 和 Formatter
xaxis.set_major_locator(xMajorLocator)
# xaxis.set_major_formatter(xMajorFormatter)
xaxis.set_minor_locator(xMinorLocator)
# xaxis.set_minor_formatter(xMinorFormatter)
# 将 X 轴上的坐标设为不可见。
for mal in axes.get_xticklabels(minor=False):
mal.set_visible(False)
for mil in axes.get_xticklabels(minor=True):
mil.set_visible(False)
def set_xticks_2(self):
quotes= self._pdata[u'行情']
axes= self._Axes_2
xaxis= self._AxisX_2
xMajorLocator= self._xparams['xMajorLocator']
xMinorLocator= self._xparams['xMinorLocator']
# 设定 X 轴坐标的范围
#==================================================================================================================================================
xmargin= self._xparams['xmargin']
axes.set_xlim(-xmargin, self._length + xmargin)
# 先设置 label 位置,再将 X 轴上的坐标设为不可见。因为与 成交量子图 共用 X 轴
#==================================================================================================================================================
# 设定 X 轴的 Locator 和 Formatter
xaxis.set_major_locator(xMajorLocator)
# xaxis.set_major_formatter(xMajorFormatter)
xaxis.set_minor_locator(xMinorLocator)
# xaxis.set_minor_formatter(xMinorFormatter)
# 将 X 轴上的坐标设为不可见。
for mal in axes.get_xticklabels(minor=False):
mal.set_visible(False)
for mil in axes.get_xticklabels(minor=True):
mil.set_visible(False)
def _compute_ytickset(self):
'''
计算 Y 轴坐标点的位置,包括第二个行情
'''
quotes= self._pdata[u'行情']
expbase= self._expbase
ytickset= {}
yhighlim= self._yhighlim
ylowlim= self._ylowlim
if u'开盘二' in quotes:
yhighlim_2= self._yhighlim_2
ylowlim_2= self._ylowlim_2
if self._name == 'price' and 'pricefs' in self._parent._subplots:
tsetfs= self._parent._subplots['pricefs'].get_ytickset()
majors= tsetfs['major']
while majors[-1] < yhighlim: majors.append(majors[-1] * expbase)
while majors[0] > ylowlim: majors.insert(0, majors[0] / expbase)
minors= tsetfs['minor']
while minors[-1] < yhighlim: minors.append(minors[-1] * expbase)
while minors[0] > ylowlim: minors.insert(0, minors[0] / expbase)
ytickset['major']= [loc for loc in majors if loc > ylowlim and loc < yhighlim]
ytickset['minor']= [loc for loc in minors if loc > ylowlim and loc < yhighlim]
else:
# 主要坐标点
#----------------------------------------------------------------------------
majors= [ylowlim]
while majors[-1] < yhighlim: majors.append(majors[-1] * 1.1)
# 辅助坐标点
#----------------------------------------------------------------------------
minors= [ylowlim * 1.1**0.5]
while minors[-1] < yhighlim: minors.append(minors[-1] * 1.1)
ytickset['major']= [loc for loc in majors if loc > ylowlim and loc < yhighlim] # 注意,第一项(ylowlim)被排除掉了
ytickset['minor']= [loc for loc in minors if loc > ylowlim and loc < yhighlim]
if u'开盘二' in quotes:
popen= self._open[0] # int 类型
popen_2= self._open_2[0] # 同上
ytickset['major_2']= [loc * popen_2 / popen for loc in ytickset['major']]
ytickset['minor_2']= [loc * popen_2 / popen for loc in ytickset['minor']]
return ytickset
def get_ytickset(self):
return self._ytickset
def set_yticks(self):
'''
设置第一只行情的 Y 轴坐标,包括坐标值在图中间的显示
'''
axes= self._Axes
ylowlim= self._ylowlim
yhighlim= self._yhighlim
yaxis= self._AxisY
majorticks= self._ytickset['major']
minorticks= self._ytickset['minor']
# 设定 Y 轴坐标的范围
#==================================================================================================================================================
axes.set_ylim(ylowlim, yhighlim)
# 设定 Y 轴上的坐标
#==================================================================================================================================================
# 主要坐标点
#----------------------------------------------------------------------------
yMajorLocator= FixedLocator(numpy.array(majorticks))
# 确定 Y 轴的 MajorFormatter
def y_major_formatter(num, pos=None):
return str(round(num/1000.0, 2))
yMajorFormatter= FuncFormatter(y_major_formatter)
# 设定 X 轴的 Locator 和 Formatter
yaxis.set_major_locator(yMajorLocator)
yaxis.set_major_formatter(yMajorFormatter)
# 设定 Y 轴主要坐标点与辅助坐标点的样式
fsize= 4 if self._name == 'pricefs' else 6
for mal in axes.get_yticklabels(minor=False):
mal.set_fontsize(fsize)
# 辅助坐标点
#----------------------------------------------------------------------------
yMinorLocator= FixedLocator(numpy.array(minorticks))
# 确定 Y 轴的 MinorFormatter
def y_minor_formatter(num, pos=None):
return str(round(num/1000.0, 2))
yMinorFormatter= FuncFormatter(y_minor_formatter)
# 设定 X 轴的 Locator 和 Formatter
yaxis.set_minor_locator(yMinorLocator)
yaxis.set_minor_formatter(yMinorFormatter)
# 设定 Y 轴辅助坐标点的样式
if self._name == 'pricefs':
for mil in axes.get_yticklabels(minor=True):
mil.set_visible(False)
else:
for mil in axes.get_yticklabels(minor=True):
mil.set_fontsize(5)
mil.set_color('blue')
def set_yticks_2(self):
'''
子图右侧的 Y 轴坐标
'''
axes= self._Axes_2
yaxis= self._AxisY_2
yhighlim_2= self._yhighlim_2
ylowlim_2= self._ylowlim_2
majorticks_2= self._ytickset['major_2']
minorticks_2= self._ytickset['minor_2']
# 设定 Y 轴坐标的范围
#==================================================================================================================================================
axes.set_ylim(ylowlim_2, yhighlim_2)
# 设定 Y 轴上的坐标
#==================================================================================================================================================
# 主要坐标点
#----------------------------------------------------------------------------
yMajorLocator= FixedLocator(numpy.array(majorticks_2))
# 确定 Y 轴的 MajorFormatter
def y_major_formatter(num, pos=None):
return str(round(num/1000.0, 2))
yMajorFormatter= FuncFormatter(y_major_formatter)
# 设定 X 轴的 Locator 和 Formatter
yaxis.set_major_locator(yMajorLocator)
yaxis.set_major_formatter(yMajorFormatter)
# 设定 Y 轴主要坐标点与辅助坐标点的样式
fsize= 4 if self._name == 'pricefs' else 6
for mal in axes.get_yticklabels(minor=False):
mal.set_fontsize(fsize)
# 辅助坐标点
#----------------------------------------------------------------------------
yMinorLocator= FixedLocator(numpy.array(minorticks_2)) # XXX minor ticks 已经在上面一并设置,这里不需要了。
# 确定 Y 轴的 MinorFormatter
def y_minor_formatter(num, pos=None):
return str(round(num/1000.0, 2))
yMinorFormatter= FuncFormatter(y_minor_formatter)
# 设定 X 轴的 Locator 和 Formatter
yaxis.set_minor_locator(yMinorLocator)
yaxis.set_minor_formatter(yMinorFormatter)
# 设定 Y 轴主要坐标点与辅助坐标点的样式
if self._name == 'pricefs':
for mil in axes.get_yticklabels(minor=True):
mil.set_visible(False)
else:
for mil in axes.get_yticklabels(minor=True):
mil.set_fontsize(5)
mil.set_color('blue')
def plot(self):
'''
由派生类自己定义
'''
pass
def plot_candlestick(self):
'''
绘制 K 线
'''
axes= self._Axes
xindex= self._xindex
up= self._up
down= self._down
side= self._side
# 绘制 K 线部分
#==================================================================================================================================================
# 对开收盘价进行视觉修正
for idx, poc in enumerate(self._zipoc):
if poc[0] == poc[1] and None not in poc:
variant= int(round((poc[1]+1000)/2000.0, 0))
self._open[idx]= poc[0] - variant # 稍微偏离一点,使得在图线上不致于完全看不到
self._close[idx]= poc[1] + variant
rarray_open= numpy.array(self._open)
rarray_close= numpy.array(self._close)
rarray_high= numpy.array(self._high)
rarray_low= numpy.array(self._low)
# XXX: 如果 up, down, side 里有一个全部为 False 组成,那么 vlines() 会报错。
# XXX: 可以使用 alpha 参数调节透明度
if True in up:
axes.vlines(xindex[up], rarray_low[up], rarray_high[up], edgecolor='red', linewidth=0.6, label='_nolegend_', alpha=0.5)
axes.vlines(xindex[up], rarray_open[up], rarray_close[up], edgecolor='red', linewidth=3.0, label='_nolegend_', alpha=0.5)
if True in down:
axes.vlines(xindex[down], rarray_low[down], rarray_high[down], edgecolor='green', linewidth=0.6, label='_nolegend_', alpha=0.5)
axes.vlines(xindex[down], rarray_open[down], rarray_close[down], edgecolor='green', linewidth=3.0, label='_nolegend_', alpha=0.5)
if True in side:
axes.vlines(xindex[side], rarray_low[side], rarray_high[side], edgecolor='0.7', linewidth=0.6, label='_nolegend_', alpha=0.5)
axes.vlines(xindex[side], rarray_open[side], rarray_close[side], edgecolor='0.7', linewidth=3.0, label='_nolegend_', alpha=0.5)
def plot_simplified(self):
'''
绘制简化行情
'''
xindex= self._xindex
axes= self._Axes
rarray_simple= numpy.array(self._simple)
axes.plot(xindex, rarray_simple, 'o-', color='white', linewidth=0.3, label='simple', \
markersize=0.3, markeredgecolor='white', markeredgewidth=0.1, alpha=0.3) # 简化行情
def plot_average(self):
'''
绘制均线
'''
# 绘制均线部分
#==================================================================================================================================================
quotes= self._pdata[u'行情']
xindex= self._xindex
axes= self._Axes
if self._name == 'pricefs':
widthw= 0.1
widthn= 0.07
mksize= 0.07
mkwidth= 0.1
alpha= 1.0
else:
widthw= 0.2
widthn= 0.1
mksize= 0.3
mkwidth= 0.1
alpha= 1.0
if u'3日均' in quotes:
rarray_3dayave= numpy.array(self._average3)
axes.plot(xindex, rarray_3dayave, 'o-', color='white', linewidth=widthw, label='avg_3', \
markersize=mksize, markeredgecolor='white', markeredgewidth=mkwidth, alpha=alpha) # 3日均线
if u'5日均' in quotes:
rarray_5dayave= numpy.array(self._average5)
axes.plot(xindex, rarray_5dayave, 'o-', color='white', linewidth=widthn, label='avg_5', \
markersize=mksize, markeredgecolor='white', markeredgewidth=mkwidth, alpha=alpha) # 5日均线
if u'10日均' in quotes:
rarray_10dayave= numpy.array(self._average10)
axes.plot(xindex, rarray_10dayave, 'o-', color='yellow', linewidth=widthn, label='avg_10', \
markersize=mksize, markeredgecolor='yellow', markeredgewidth=mkwidth, alpha=alpha) # 10日均线
if u'30日均' in quotes:
rarray_30dayave= numpy.array(self._average30)
axes.plot(xindex, rarray_30dayave, 'o-', color='cyan', linewidth=widthn, label='avg_30', \
markersize=mksize, markeredgecolor='cyan', markeredgewidth=mkwidth, alpha=alpha) # 30日均线
if u'60日均' in quotes:
rarray_60dayave= numpy.array(self._average60)
axes.plot(xindex, rarray_60dayave, 'o-', color='magenta', linewidth=widthn, label='avg_60', \
markersize=mksize, markeredgecolor='magenta', markeredgewidth=mkwidth, alpha=alpha) # 60日均线
def plot_adjustnotes(self):
'''
绘制复权提示
'''
quotes= self._pdata[u'行情']
firstday= self._dates[0]
lastday= self._dates[-1]
ylowlim= self._ylowlim
yhighlim= self._yhighlim
axes= self._Axes
# 使用 annotate() 进行标注。不用了,留作纪念。
#===========================================================================================================================
# adjdict= dict(quotes[u'相对复权']) # key 是 date string,value 是相对复权因子(float 类型)
# el= Ellipse((2, -1), 0.5, 0.5)
# for idx, dstr in enumerate(self._dates):
# if dstr in adjdict:
# axes.plot([idx, idx], [ylowlim, yhighlim], '-', color='purple', linewidth=0.1)
# axes.annotate(u'复权\n' + str(adjdict[dstr]),
# fontproperties=__font_properties__,
# xy=(idx, yhighlim/1.1), xycoords='data',
# xytext=(10, 5), textcoords='offset points', size=5, verticalalignment="center",
# bbox=dict(boxstyle="round", facecolor='white', edgecolor='purple'),
# arrowprops=dict(arrowstyle="wedge,tail_width=1.",
# facecolor='white', edgecolor='purple',
# patchA=None,
# patchB=el,
# relpos=(0.2, 0.8),
# connectionstyle="arc3,rad=-0.1"),
# alpha=0.5
# )
adjrecs= [rec for rec in quotes[u'相对复权'] if rec[0] >= firstday and rec[0] <= lastday]
if self._name == 'pricefs':
fsize= 3.0
ycoord= yhighlim/1.3
alpha= 1.0
else:
fsize= 5.0
ycoord= yhighlim/1.12
alpha= 1.0
for dstr, afac in adjrecs:
idx= self._dates.index(dstr)
axes.plot([idx, idx], [ylowlim, yhighlim], '-', color='purple', linewidth=0.1)
label= axes.text( \
idx, ycoord, \
u'复权 ' + str(afac) + u'\n' + dstr, \
fontproperties=__font_properties__, \
horizontalalignment='left', \
verticalalignment='top', \
color='purple', \
alpha=alpha
)
label.set_fontsize(fsize)
def plot_capchangenotes(self):
'''
绘制流通股本变更提示
注意两个问题:
1. 流通股本变更提示中的日期可能不是交易日期
2. 流通股本变更提示涵盖个股的所有历史,有些内容可能在绘图目标区间以外
'''
pdata= self._pdata
axes= self._Axes
ylowlim= self._ylowlim
yhighlim= self._yhighlim
firstday= self._dates[0]
lastday= self._dates[-1]
# 把目标区间之外的记录滤掉
changerecs= [rec for rec in pdata[u'公司信息'][u'流通股变更'] if rec[u'变更日期'] >= firstday and rec[u'变更日期'] <= lastday]
# 使用 annotate() 进行标注。不用了,留作纪念。
#===========================================================================================================================
# el= Ellipse((2, -1), 0.5, 0.5)
# for datestr, chrate in changerecs:
# dstr= [ds for ds in self._dates if ds >= datestr][0]
# idx= self._dates.index(dstr)
# axes.plot([idx, idx], [ylowlim, yhighlim], '-', color='yellow', linewidth=0.1)
# axes.annotate(u'流通股\n' + str(chrate),
# fontproperties=__font_properties__,
# xy=(idx, yhighlim/1.1), xycoords='data',
# xytext=(10, 5), textcoords='offset points', size=5, verticalalignment="center",
# bbox=dict(boxstyle="round", facecolor='white', edgecolor='yellow'),
# arrowprops=dict(arrowstyle="wedge,tail_width=1.",
# facecolor='white', edgecolor='yellow',
# patchA=None,
# patchB=el,
# relpos=(0.2, 0.8),
# connectionstyle="arc3,rad=-0.1"),
# alpha=0.5
# )
if self._name == 'pricefs':
fsize= 3.0
ycoord= yhighlim/1.1
alpha= 1.0
else:
fsize= 5.0
ycoord= yhighlim/1.05
alpha= 0.8
for record in changerecs:
datestr= record[u'变更日期']
chrate= record[u'变更比']
dstr= [ds for ds in self._dates if ds >= datestr][0]
idx= self._dates.index(dstr)
axes.plot([idx, idx], [ylowlim, yhighlim], '-', color='yellow', linewidth=0.1)
label= axes.text( \
idx, ycoord, \
u'流通股 ' + str(chrate) + u'\n' + datestr, \
fontproperties=__font_properties__, \
horizontalalignment='left', \
verticalalignment='top', \
color='yellow', \
alpha=alpha
)
label.set_fontsize(fsize)
def plot_candlestick_2(self):
'''
绘制第二条 K 线
'''
xindex= self._xindex
axes= self._Axes_2
up= self._up_2
down= self._down_2
side= self._side_2
# 对开收盘价进行视觉修正
for idx, poc in enumerate( self._zipoc_2 ):
if poc[0] == poc[1] and None not in poc:
self._open_2[idx]= poc[0] - 5 # 稍微偏离一点,使得在图线上不致于完全看不到
self._close_2[idx]= poc[1] + 5
rarray_open= numpy.array(self._open_2)
rarray_close= numpy.array(self._close_2)
rarray_high= numpy.array(self._high_2)
rarray_low= numpy.array(self._low_2)
# XXX: 如果 up, down, side 里有一个全部为 False 组成,那么 vlines() 会报错。
# XXX: 可以使用 alpha 参数调节透明度
if True in up:
axes.vlines(xindex[up], rarray_low[up], rarray_high[up], edgecolor='0.7', linewidth=0.6, label='_nolegend_', alpha=0.5)
axes.vlines(xindex[up], rarray_open[up], rarray_close[up], edgecolor='0.7', linewidth=3.0, label='_nolegend_', alpha=0.5)
if True in down:
axes.vlines(xindex[down], rarray_low[down], rarray_high[down], edgecolor='0.3', linewidth=0.6, label='_nolegend_', alpha=0.5)
axes.vlines(xindex[down], rarray_open[down], rarray_close[down], edgecolor='0.3', linewidth=3.0, label='_nolegend_', alpha=0.5)
if True in side:
axes.vlines(xindex[side], rarray_low[side], rarray_high[side], edgecolor='1.0', linewidth=0.6, label='_nolegend_', alpha=1.0)
axes.vlines(xindex[side], rarray_open[side], rarray_close[side], edgecolor='1.0', linewidth=3.0, label='_nolegend_', alpha=1.0)
def plot_capitalinfo(self):
'''
绘制行情首日和尾日的股本信息
'''
def find_biggestblank(didx):
'''
找出 X 轴某个位置图中最大的空隙
'''
pstart= self._open[0]
ptarget= self._open[didx]
compseq= [yhighlim, ptarget, ylowlim]
if u'开盘二' in quotes:
pstart_2= self._open_2[0]
ptarget_2= self._open_2[didx]
padjust= int(ptarget_2 * pstart / float(pstart_2))
compseq.append(padjust)
compseq.sort(reverse=True) # 图中的三个或四个关键点,高到底排序
diff, hi, low= max([(math.log(compseq[idx]/float(compseq[idx+1]), expbase), compseq[idx], compseq[idx+1]) for idx in range(len(compseq)-1)])
# XXX: for debugging
# print(compseq)
# print([diff, hi, low])
return (hi*low)**0.5 # 相乘再开平方,在 log 坐标系里看起来就是在中间位置。
def repr_int(intnum):
'''
123456789 --> '1,2345,6789'
'''
if type(intnum) not in (int, long): return str(intnum)
if intnum == 0: return '0'
if intnum < 0:
intnum= -intnum
isminus= True
else:
isminus= False
intstr= str(intnum)
intstr= '0'*((4-len(intstr)%4)%4) + intstr
intlist= [intstr[i:i+4] for i in range(0, len(intstr), 4)]
intlist[0]= intlist[0].lstrip('0')
return ('-' + ','.join(intlist)) if isminus else ','.join(intlist)
pdata= self._pdata
quotes= pdata[u'行情']
ylowlim= self._ylowlim
yhighlim= self._yhighlim
length= self._length
expbase= self._expbase
capinfo= pdata[u'公司信息'][u'股本变更记录']
axes= self._Axes
firstday, lastday= self._dates[0], self._dates[-1]
fsize= 5.0 if self._name == 'price' else 3.0
# 首日总股本与流通股信息
#====================================================================================================================================
chunk= [rec for rec in capinfo if rec[u'变更日期'] <= firstday]
if chunk:
allshares= repr_int(chunk[-1][u'总股本'])
circulating= repr_int(chunk[-1][u'流通股'])
else:
allshares= 'None'
circulating= 'None'
infostr= u'总股本: ' + allshares + '\n' + u'流通股: ' + circulating
label= axes.text(0, find_biggestblank(didx=0), infostr, fontproperties=__font_properties__, color='0.7')
label.set_fontsize(fsize)
# label.set_zorder(0) # XXX: 放在底层
# 尾日总股本与流通股信息
#====================================================================================================================================
chunk= [rec for rec in capinfo if rec[u'变更日期'] <= lastday]
if chunk:
allshares= repr_int(chunk[-1][u'总股本'])
circulating= repr_int(chunk[-1][u'流通股'])
else:
allshares= 'None'
circulating= 'None'
infostr= u'总股本: ' + allshares + '\n' + u'流通股: ' + circulating
label= axes.text(length-1, find_biggestblank(didx=length-1), infostr, fontproperties=__font_properties__, horizontalalignment='right', color='0.7')
label.set_fontsize(fsize)
# label.set_zorder(0) # XXX: 放在底层
def plot_usernotes(self):
'''
'''
pdata= self._pdata
quotes= pdata[u'行情']
sidx= self._pdata[u'任务描述'][u'起始偏移']
eidx= self._pdata[u'任务描述'][u'结束偏移']
axes= self._Axes
usernotes= pdata[u'用户标记']
alldates= quotes[u'日期'][sidx:eidx]
lowprices= quotes[u'最低'][sidx:eidx]
expbase= self._expbase
# 绘制短线买点标记
for note in usernotes:
if note[u'类型'] == u'筛选结果':
dstr= note[u'日期']
# 日期不在绘图区间范围内,忽略
if dstr not in alldates:
continue
# 决定箭头的颜色
result= note[u'结果']
color= 'magenta' if result == u'上涨' else 'cyan' if result == u'下跌' else 'white'
# 箭头的起始位置
idx= alldates.index(dstr)
xpos= idx
ypos= lowprices[idx] / expbase
# 箭头的长度
dx= 0.0
dy= ypos * (expbase-1) * 0.9
# 头端的长度
head_length= dy * 0.2
# 绘制箭头
arrow_params={'length_includes_head':True, 'shape':'full', 'head_starts_at_zero':False}
axes.arrow(xpos, ypos, dx, dy, facecolor=color, edgecolor=color, linewidth=0.7, head_width=0.6, head_length=head_length, **arrow_params)
def plot_vlines(self):
xindex= self._xindex
up= self._up
down= self._down
side= self._side
axes= self._Axes
lwidth= 2.4 * self._shrink
# 绘制 K 线部分
#==================================================================================================================================================
rarray_high= numpy.array(self._high)
rarray_low= numpy.array(self._low)
# XXX: 如果 up, down, side 里有一个全部为 False 组成,那么 vlines() 会报错。
# XXX: 可以使用 alpha 参数调节透明度
if True in up:
axes.vlines(xindex[up], rarray_low[up], rarray_high[up], edgecolor='red', linewidth=lwidth, label='_nolegend_', alpha=0.5)
if True in down:
axes.vlines(xindex[down], rarray_low[down], rarray_high[down], edgecolor='green', linewidth=lwidth, label='_nolegend_', alpha=0.5)
if True in side:
axes.vlines(xindex[side], rarray_low[side], rarray_high[side], edgecolor='0.7', linewidth=lwidth, label='_nolegend_', alpha=0.5)
def plot_vlines_2(self):
xindex= self._xindex
axes= self._Axes_2
up= self._up_2
down= self._down_2
side= self._side_2
lwidth= 2.4 * self._shrink
rarray_high= numpy.array(self._high_2)
rarray_low= numpy.array(self._low_2)
# XXX: 如果 up, down, side 里有一个全部为 False 组成,那么 vlines() 会报错。
# XXX: 可以使用 alpha 参数调节透明度
if True in up:
axes.vlines(xindex[up], rarray_low[up], rarray_high[up], edgecolor='0.7', linewidth=lwidth, label='_nolegend_', alpha=0.5)
if True in down:
axes.vlines(xindex[down], rarray_low[down], rarray_high[down], edgecolor='0.3', linewidth=lwidth, label='_nolegend_', alpha=0.5)
if True in side:
axes.vlines(xindex[side], rarray_low[side], rarray_high[side], edgecolor='1.0', linewidth=lwidth, label='_nolegend_', alpha=1.0)
def plot_datenotes(self):
'''
内部的日期注释,由派生类定义
'''
pass
def plot_pricenotes(self):
'''
内部的价格注释,由派生类定义
'''
pass
class SubPlot_PriceFullSpan(SubPlot_PriceBase):
'''
'''
def plot(self):
'''
绘图
'''
pdata= self._pdata
# if u'简化' in pdata:
# self.plot_simplified()
# else:
# self.plot_candlestick()
self.plot_vlines()
self.plot_average()
if u'相对复权' in pdata[u'行情']:
self.plot_adjustnotes()
if u'流通股变更' in pdata[u'公司信息']:
self.plot_capchangenotes()
if u'股本变更记录' in pdata[u'公司信息']:
self.plot_capitalinfo()
self.set_xticks()
self.set_yticks()
if u'开盘二' in pdata[u'行情']:
self.plot_vlines_2()
self.set_xticks_2()
self.set_yticks_2()
self.plot_datenotes()
if 'price' in self._parent._subplots:
self.plot_windowspan()
def plot_datenotes(self):
'''
日期在图中间的显示
'''
ylowlim= self._ylowlim
axes= self._Axes
sdindex= self._xparams['sdindex']
mdindex= self._xparams['mdindex']
# 每季度第一个交易日
for ix in sdindex:
newlab= axes.text(ix - (1/self._shrink), ylowlim*1.03, self._dates[ix])
newlab.set_font_properties(__font_properties__)
newlab.set_color('0.3')
newlab.set_fontsize(4)
newlab.set_rotation('45')
# newlab.set_rotation('vertical')
# newlab.set_horizontalalignment('left')
# newlab.set_verticalalignment('bottom')
# newlab.set_verticalalignment('center')
newlab.set_zorder(0) # XXX: 放在底层
# 每月第一个交易日
for ix in mdindex:
newlab= axes.text(ix - (0.8/self._shrink), ylowlim * 1.03, self._dates[ix])
newlab.set_font_properties(__font_properties__)
newlab.set_color('0.3')
newlab.set_fontsize(3)
newlab.set_rotation('45')
# newlab.set_rotation('vertical')
# newlab.set_horizontalalignment('left')
# newlab.set_verticalalignment('top') # 不行
# newlab.set_verticalalignment('center')
# newlab.set_verticalalignment('bottom')
newlab.set_zorder(0) # XXX: 放在底层
def plot_windowspan(self):
axes= self._Axes
jobstat= self._pdata[u'任务描述']
sindex, eindex= jobstat[u'起始偏移'], jobstat[u'结束偏移']
hibdry, lobdry= self._parent._subplots['price'].get_ylimits()
xcoord= sindex - 1
width= eindex - sindex + 1
ycoord= lobdry
height= hibdry - lobdry
window= matplotlib.patches.Rectangle((xcoord, ycoord), width, height, fill=False, edgecolor=__color_lightblue__, linewidth=0.3, alpha=0.7)
window.set_zorder(-1) # 放在底层
axes.add_patch(window)
class SubPlot_Price(SubPlot_PriceBase):
'''
'''
def plot(self):
'''
绘图
'''
pdata= self._pdata
# if u'简化' in pdata:
# self.plot_simplified()
# else:
# self.plot_candlestick()
self.plot_candlestick()
self.plot_average()
if u'相对复权' in pdata[u'行情']:
self.plot_adjustnotes()
if u'流通股变更' in pdata[u'公司信息']:
self.plot_capchangenotes()
if u'股本变更记录' in pdata[u'公司信息']:
self.plot_capitalinfo()
if u'用户标记' in pdata:
self.plot_usernotes()
self.set_xticks()
self.set_yticks()
if u'开盘二' in pdata[u'行情']:
self.plot_candlestick_2()
self.set_xticks_2()
self.set_yticks_2()
self.plot_pricenotes()
self.plot_datenotes()
def plot_datenotes(self):
'''
日期在图中间的显示
'''
ylowlim= self._ylowlim
yhighlim= self._yhighlim
axes= self._Axes
mdindex= self._xparams['mdindex']
wdindex= self._xparams['wdindex']
# 每月第一个交易日
for iy in [ylowlim*1.1, yhighlim/1.21]:
for ix in mdindex:
newlab= axes.text(ix-1, iy, self._dates[ix])
newlab.set_font_properties(__font_properties__)
newlab.set_color('0.3')
newlab.set_fontsize(4)
newlab.set_rotation('vertical')
# newlab.set_horizontalalignment('left')
# newlab.set_verticalalignment('bottom')
# newlab.set_verticalalignment('center')
newlab.set_zorder(0) # XXX: 放在底层
# 每周第一个交易日,根据这个可以推算出全部确切的日期。
# for iy in minorticks[0:-1:6]:
for iy in [ylowlim*1.01, yhighlim/1.09]:
for ix in wdindex:
newlab= axes.text(ix-0.8, iy, self._dates[ix])
newlab.set_font_properties(__font_properties__)
newlab.set_color('0.3')
newlab.set_fontsize(3)
newlab.set_rotation('vertical')
# newlab.set_horizontalalignment('left')
# newlab.set_verticalalignment('top') # 不行
# newlab.set_verticalalignment('center')
# newlab.set_verticalalignment('bottom')
newlab.set_zorder(0) # XXX: 放在底层
def plot_pricenotes(self):
# 价格数值在图中间的显示
#==================================================================================================================================================
quotes= self._pdata[u'行情']
axes= self._Axes
majorticks= self._ytickset['major']
minorticks= self._ytickset['minor']
mdindex= self._xparams['mdindex']
def price_note(num):
return str(round(num/1000.0, 2))
if u'开盘二' in quotes:
majorticks_2= self._ytickset['major_2']
minorticks_2= self._ytickset['minor_2']
for iy, iy2 in zip(sorted(majorticks[:-1] + minorticks[1:-1]), sorted(majorticks_2[:-1] + minorticks_2[1:-1])):
for ix in mdindex[1:-1:3]:
newlab= axes.text(ix+6, iy*1.001, price_note(iy) + ' / ' + price_note(iy2))
newlab.set_font_properties(__font_properties__)
newlab.set_color('0.3')
newlab.set_fontsize(3)
newlab.set_zorder(0) # XXX: 放在底层
else:
for iy in sorted(majorticks[:-1] + minorticks[1:-1]):
for ix in mdindex[1:-1:3]:
newlab= axes.text(ix+9, iy*1.001, price_note(iy))
newlab.set_font_properties(__font_properties__)
newlab.set_color('0.3')
newlab.set_fontsize(3)
newlab.set_zorder(0) # XXX: 放在底层
class SubPlot_TORateBase:
'''
换手率子图
'''
def __init__(self, pdata, parent, xparams, name):
self._name= name
self._pdata= pdata
self._parent= parent
self._xparams= xparams
self._shrink= __shrink__ if name == 'toratefs' else 1.0
self._tostep= 0 # 每一格代表的换手率数值
self._yrange= 0
self._xsize= 0 # int
self._ysize= 0 # int
self._Axes= None
self._AxisX= None
self._AxisY= None
if u'换手率二' in pdata[u'行情']:
self._Axes_2= None
self._AxisX_2= None
self._AxisY_2= None
self._tostep_2= 0
# 绘图数据
quotes= pdata[u'行情']
if name == 'toratefs':
self._dates= quotes[u'日期']
self._open= quotes[u'开盘']
self._close= quotes[u'收盘']
self._high= quotes[u'最高']
self._low= quotes[u'最低']
if u'简化' in quotes: self._simple= quotes[u'简化']
if u'换手率' in quotes: self._torate= quotes[u'换手率']
if u'成交量' in quotes: self._volume= quotes[u'成交量']
if u'成交额' in quotes: self._turnover= quotes[u'成交额']
if u'开盘二' in quotes:
self._open_2= quotes[u'开盘二']
self._close_2= quotes[u'收盘二']
self._high_2= quotes[u'最高二']
self._low_2= quotes[u'最低二']
if u'简化二' in quotes: self._simple_2= quotes[u'简化二']
if u'换手率二' in quotes: self._torate_2= quotes[u'换手率二']
if u'成交量二' in quotes: self._volume_2= quotes[u'成交量二']
if u'成交额二' in quotes: self._turnover_2= quotes[u'成交额二']
else:
sidx, eidx= pdata[u'任务描述'][u'起始偏移'], pdata[u'任务描述'][u'结束偏移']
self._dates= quotes[u'日期'][sidx:eidx]
self._open= quotes[u'开盘'][sidx:eidx]
self._close= quotes[u'收盘'][sidx:eidx]
self._high= quotes[u'最高'][sidx:eidx]
self._low= quotes[u'最低'][sidx:eidx]
if u'简化' in quotes: self._simple= quotes[u'简化'][sidx:eidx]
if u'换手率' in quotes: self._torate= quotes[u'换手率'][sidx:eidx]
if u'成交量' in quotes: self._volume= quotes[u'成交量'][sidx:eidx]
if u'成交额' in quotes: self._turnover= quotes[u'成交额'][sidx:eidx]
if u'开盘二' in quotes:
self._open_2= quotes[u'开盘二'][sidx:eidx]
self._close_2= quotes[u'收盘二'][sidx:eidx]
self._high_2= quotes[u'最高二'][sidx:eidx]
self._low_2= quotes[u'最低二'][sidx:eidx]
if u'简化二' in quotes: self._simple_2= quotes[u'简化二'][sidx:eidx]
if u'换手率二' in quotes: self._torate_2= quotes[u'换手率二'][sidx:eidx]
if u'成交量二' in quotes: self._volume_2= quotes[u'成交量二'][sidx:eidx]
if u'成交额二' in quotes: self._turnover_2= quotes[u'成交额二'][sidx:eidx]
# 衍生数据
#==============================================================================================================
self._length= len(self._dates)
self._xindex= numpy.arange(self._length) # X 轴上的 index,一个辅助数据
self._zipoc= zip(self._open, self._close)
self._up= numpy.array( [ True if po < pc and po is not None else False for po, pc in self._zipoc] ) # 标示出该天股价日内上涨的一个序列
self._down= numpy.array( [ True if po > pc and po is not None else False for po, pc in self._zipoc] ) # 标示出该天股价日内下跌的一个序列
self._side= numpy.array( [ True if po == pc and po is not None else False for po, pc in self._zipoc] ) # 标示出该天股价日内走平的一个序列
if u'开盘二' in quotes:
self._zipoc_2= zip(self._open_2, self._close_2)
self._up_2= numpy.array( [ True if po < pc and po is not None else False for po, pc in self._zipoc_2] ) # 标示出该天股价日内上涨的一个序列
self._down_2= numpy.array( [ True if po > pc and po is not None else False for po, pc in self._zipoc_2] ) # 标示出该天股价日内下跌的一个序列
self._side_2= numpy.array( [ True if po == pc and po is not None else False for po, pc in self._zipoc_2] ) # 标示出该天股价日内走平的一个序列
self._compute_size()
def _compute_size(self):
'''
根据 pdata 计算自身尺寸
'''
def _compute_step(maxto):
'''
maxto 是 换手率 最大值。返回每格单位(最小 500, 代表 0.5%)以及格数
'''
for i in range(9):
if maxto > (4 * 500 * (2**i)): # 换手率最大是 100000, 代表 100%
continue
else:
tostep= 500 * (2**i)
tosize= int(round((maxto + tostep/2.0 - 1) / float(tostep), 0))
break
return (tostep, tosize)
quotes= self._pdata[u'行情']
xmargin= self._xparams['xmargin']
self._xsize= (self._length + xmargin*2) * self._shrink
maxto= max(self._torate)
self._tostep, self._yrange= _compute_step(maxto=maxto)
if u'换手率二' in quotes:
maxto_2= max(self._torate_2)
self._tostep_2, yrange_2= _compute_step(maxto=maxto_2)
self._yrange= max(self._yrange, yrange_2) # 成交量部分在 Y 轴所占的 “份数”
self._ysize= self._yrange * self._shrink
def get_size(self):
return (self._xsize, self._ysize)
def build_axes(self, figobj, rect):
# 第一只:添加 Axes 对象
#==================================================================================================================================================
axes= figobj.add_axes(rect, axis_bgcolor='black')
axes.set_axis_bgcolor('black')
axes.set_axisbelow(True) # 网格线放在底层
# 第一只:改变坐标线的颜色
#==================================================================================================================================================
for child in axes.get_children():
if isinstance(child, matplotlib.spines.Spine):
child.set_color(__color_gold__)
# child.set_zorder(3) # XXX: 放在上层,好像没什么用。
# 得到 X 轴 和 Y 轴 的两个 Axis 对象
#==================================================================================================================================================
xaxis= axes.get_xaxis()
yaxis= axes.get_yaxis()
# 设置两个坐标轴上的 grid
#==================================================================================================================================================
xaxis.grid(True, 'major', color='0.3', linestyle='solid', linewidth=0.2)
xaxis.grid(True, 'minor', color='0.3', linestyle='dotted', linewidth=0.1)
yaxis.grid(True, 'major', color='0.3', linestyle='solid', linewidth=0.2)
yaxis.grid(True, 'minor', color='0.3', linestyle='solid', linewidth=0.1)
self._Axes= axes
self._AxisX= xaxis
self._AxisY= yaxis
if u'换手率二' in self._pdata[u'行情']:
# 添加 Axes 对象
#==================================================================================================================================================
axes_2= axes.twinx()
# XXX: 下面这三行把第一个 axes 放在上面,这样不会被第二个 axes 的图形遮盖。用 zorder 不顶用。
axes.figure.axes[-2:]= [axes_2, axes] # XXX: 把第一个 axes 放在上面,用 zorder 不顶用。
axes.set_frame_on(False) # 如果不做此设定,axes_2 的内容会看不见
axes_2.set_frame_on(True)
axes_2.set_axis_bgcolor('black')
axes_2.set_axisbelow(True) # 网格线放在底层
# 改变坐标线的颜色
#==================================================================================================================================================
for child in axes_2.get_children():
if isinstance(child, matplotlib.spines.Spine):
child.set_color(__color_gold__)
# 得到 X 轴 和 Y 轴 的两个 Axis 对象
#==================================================================================================================================================
xaxis_2= axes_2.get_xaxis()
yaxis_2= axes_2.get_yaxis()
# 设置网格线
#==================================================================================================================================================
# xaxis_2.grid(True, 'major', color='0.3', linestyle='solid', linewidth=0.2)
# xaxis_2.grid(True, 'minor', color='0.3', linestyle='dotted', linewidth=0.1)
# yaxis_2.grid(True, 'major', color='0.3', linestyle='solid', linewidth=0.2)
# yaxis_2.grid(True, 'minor', color='0.3', linestyle='dotted', linewidth=0.1)
self._Axes_2= axes_2
self._AxisX_2= xaxis_2
self._AxisY_2= yaxis_2
def get_axes(self):
return self._Axes
def plot(self):
'''
绘制换手率图形
'''
self.plot_torate()
self.set_xticks()
self.set_yticks()
if u'换手率二' in self._pdata[u'行情']:
self.plot_torate_2()
self.set_xticks_2()
self.set_yticks_2()
def plot_torate(self):
'''
绘制换手率
'''
xindex= self._xindex
stopset= self._xparams['mdindex'] if self._name == 'torate' else self._xparams['sdindex']
axes= self._Axes
up= self._up
down= self._down
side= self._side
rarray_to= numpy.array(self._torate)
tozeros= numpy.zeros(self._length) # 辅助数据
lwidth= 3.0 if self._name == 'torate' else 2.4 * self._shrink
# XXX: 如果 up/down/side 各项全部为 False,那么 vlines() 会报错。
if True in up:
axes.vlines(xindex[up], tozeros[up], rarray_to[up], edgecolor='red', linewidth=lwidth, label='_nolegend_', alpha=0.5)
if True in down:
axes.vlines(xindex[down], tozeros[down], rarray_to[down], edgecolor='green', linewidth=lwidth, label='_nolegend_', alpha=0.5)
if True in side:
axes.vlines(xindex[side], tozeros[side], rarray_to[side], edgecolor='0.7', linewidth=lwidth, label='_nolegend_', alpha=0.5)
# 绘制平均换手率(直线)
toeffect= [num for num in self._torate if num is not None]
toaverage= sum(toeffect) / float(len(toeffect))
axes.plot([-1, self._length], [toaverage, toaverage], '-', color='yellow', linewidth=0.2, alpha=0.7)
# 换手率数值在图中间的显示
#==================================================================================================================================================
for ix in stopset[2:-1:3]:
newlab= axes.text(ix+8, toaverage, str(round(toaverage/1000.0, 2)) + '%')
newlab.set_font_properties(__font_properties__)
newlab.set_color('yellow')
newlab.set_fontsize(3)
# newlab.set_zorder(0) # XXX: 放在底层
# newlab.set_verticalalignment('center')
def plot_torate_2(self):
'''
绘制第二条换手率柱状图
'''
quotes= self._pdata[u'行情']
xindex= self._xindex
axes= self._Axes_2
up= self._up_2
down= self._down_2
side= self._side_2
rarray_to= numpy.array(self._torate_2)
tozeros= numpy.zeros(self._length) # 辅助数据
lwidth, alpha= (0.7, 0.5) if self._name == 'torate' else (0.3, 0.7)
# XXX: 如果 up/down/side 各项全部为 False,那么 vlines() 会报错。
if True in up:
axes.vlines(xindex[up], tozeros[up], rarray_to[up], edgecolor='0.7', linewidth=lwidth, label='_nolegend_', alpha=alpha)
if True in down:
axes.vlines(xindex[down], tozeros[down], rarray_to[down], edgecolor='0.3', linewidth=lwidth, label='_nolegend_', alpha=alpha)
if True in side:
axes.vlines(xindex[side], tozeros[side], rarray_to[side], edgecolor='0.7', linewidth=lwidth, label='_nolegend_', alpha=1.0)
def set_xticks(self):
'''
X 轴坐标
'''
length= self._length
xmargin= self._xparams['xmargin']
axes= self._Axes
xaxis= self._AxisX
# xaxis.set_tick_params(which='both', direction='out') # XXX: 坐标点设到外面去,也可以用 Axes.tick_params(),好像 matplotlib 1.0.1 才有
# 设定 X 轴坐标的范围
#==================================================================================================================================================
axes.set_xlim(-xmargin, length + xmargin)
xMajorLocator= self._xparams['xMajorLocator']
xMinorLocator= self._xparams['xMinorLocator']
xMajorFormatter= self._xparams['xMajorFormatter']
xMinorFormatter= self._xparams['xMinorFormatter']
# 设定 X 轴的 Locator 和 Formatter
xaxis.set_major_locator(xMajorLocator)
xaxis.set_minor_locator(xMinorLocator)
if self._name == 'torate':
xaxis.set_major_formatter(xMajorFormatter)
xaxis.set_minor_formatter(xMinorFormatter)
# 设定 X 轴主要坐标点与辅助坐标点的样式
for mal in axes.get_xticklabels(minor=False):
mal.set_fontsize(4)
mal.set_horizontalalignment('right')
mal.set_rotation('45')
for mil in axes.get_xticklabels(minor=True):
mil.set_fontsize(4)
mil.set_color('blue')
mil.set_horizontalalignment('right')
mil.set_rotation('45')
else:
# 设为不可见
for mal in axes.get_xticklabels(minor=False):
mal.set_visible(False)
for mil in axes.get_xticklabels(minor=True):
mil.set_visible(False)
def set_xticks_2(self):
length= self._length
xmargin= self._xparams['xmargin']
axes= self._Axes_2
xaxis= self._AxisX_2
# xaxis.set_tick_params(which='both', direction='out') # XXX: 坐标点设到外面去,也可以用 Axes.tick_params(),好像 matplotlib 1.0.1 才有
# 设定 X 轴坐标的范围
#==================================================================================================================================================
axes.set_xlim(-xmargin, length + xmargin)
xMajorLocator= self._xparams['xMajorLocator']
xMinorLocator= self._xparams['xMinorLocator']
# 设定 X 轴的 Locator 和 Formatter
xaxis.set_major_locator(xMajorLocator)
xaxis.set_minor_locator(xMinorLocator)
# 设为不可见
for mal in axes.get_xticklabels(minor=False):
mal.set_visible(False)
for mil in axes.get_xticklabels(minor=True):
mil.set_visible(False)
def set_yticks(self):
'''
设置 Y 轴坐标
'''
axes= self._Axes
yaxis= self._AxisY
tostep= self._tostep
yrange= self._yrange
stopset= self._xparams['mdindex'] if self._name == 'torate' else self._xparams['sdindex']
# 设定换手率 Y 轴坐标的范围
#==================================================================================================================================================
axes.set_ylim(0, tostep*yrange)
# 主要坐标点
#==================================================================================================================================================
majorticks= [tostep*i for i in range(yrange)]
yMajorLocator= FixedLocator(numpy.array(majorticks))
# 确定 Y 轴的 MajorFormatter
def y_major_formatter(num, pos=None):
return str(round(num/1000.0, 2)) + '%'
yMajorFormatter= FuncFormatter(y_major_formatter)
# 确定 Y 轴的 MinorFormatter
yMinorFormatter= NullFormatter()
# 第一只:设定 X 轴的 Locator 和 Formatter
yaxis.set_major_locator(yMajorLocator)
yaxis.set_major_formatter(yMajorFormatter)
# 设定 Y 轴主要坐标点的样式
for mal in axes.get_yticklabels(minor=False):
mal.set_font_properties(__font_properties__)
mal.set_fontsize(5) # 这个必须放在前一句后面,否则作用会被覆盖
# 辅助坐标点
#==================================================================================================================================================
if self._name == 'torate':
minorticks= list( itertools.chain.from_iterable( mi for mi in [[ma + (tostep/4.0)*i for i in range(1, 4)] for ma in majorticks] ) )
yMinorLocator= FixedLocator(numpy.array(minorticks))
yaxis.set_minor_locator(yMinorLocator)
def y_minor_formatter(num, pos=None):
return str(round(num/1000.0, 3)) + '%'
yMinorFormatter= FuncFormatter(y_minor_formatter)
yaxis.set_minor_formatter(yMinorFormatter)
# 设定 Y 轴主要坐标点的样式
for mil in axes.get_yticklabels(minor=True):
mil.set_font_properties(__font_properties__)
mil.set_fontsize(4) # 这个必须放在前一句后面,否则作用会被覆盖
else:
# minorticks= list( itertools.chain.from_iterable( mi for mi in [[ma + (tostep/4.0)*i for i in range(1, 4)] for ma in majorticks] ) )
minorticks= list( [ma + (tostep/2.0) for ma in majorticks] )
yMinorLocator= FixedLocator(numpy.array(minorticks))
yaxis.set_minor_locator(yMinorLocator)
# 设定 Y 轴主要坐标点的样式
for mil in axes.get_yticklabels(minor=True):
mil.set_visible(False)
# 换手率数值在图中间的显示
#==================================================================================================================================================
for iy in range(int(tostep/2.0), tostep*yrange, int(tostep/2.0)):
for ix in stopset[1:-1:3]:
newlab= axes.text(ix+8, iy, y_major_formatter(iy))
newlab.set_font_properties(__font_properties__)
newlab.set_color('0.3')
newlab.set_fontsize(3)
newlab.set_zorder(0) # XXX: 放在底层
# newlab.set_verticalalignment('center')
def set_yticks_2(self):
'''
设置 Y 轴坐标
'''
axes= self._Axes_2
yaxis= self._AxisY_2
tostep= self._tostep_2
yrange= self._yrange # 与 1 是一样的
# 设定换手率 Y 轴坐标的范围
#==================================================================================================================================================
axes.set_ylim(0, tostep*yrange)
# 主要坐标点
#==================================================================================================================================================
majorticks= [tostep*i for i in range(yrange)]
yMajorLocator= FixedLocator(numpy.array(majorticks))
# 确定 Y 轴的 MajorFormatter
def y_major_formatter(num, pos=None):
return str(round(num/1000.0, 2)) + '%'
yMajorFormatter= FuncFormatter(y_major_formatter)
# 确定 Y 轴的 MinorFormatter
yMinorFormatter= NullFormatter()
# 第一只:设定 X 轴的 Locator 和 Formatter
yaxis.set_major_locator(yMajorLocator)
yaxis.set_major_formatter(yMajorFormatter)
# 设定 Y 轴主要坐标点的样式
for mal in axes.get_yticklabels(minor=False):
mal.set_font_properties(__font_properties__)
mal.set_fontsize(5) # 这个必须放在前一句后面,否则作用会被覆盖
# 辅助坐标点
#==================================================================================================================================================
if self._name == 'torate':
minorticks= list( itertools.chain.from_iterable( mi for mi in [[ma + (tostep/4.0)*i for i in range(1, 4)] for ma in majorticks] ) )
yMinorLocator= FixedLocator(numpy.array(minorticks))
def y_minor_formatter(num, pos=None):
return str(round(num/1000.0, 3)) + '%'
yMinorFormatter= FuncFormatter(y_minor_formatter)
yaxis.set_minor_locator(yMinorLocator)
yaxis.set_minor_formatter(yMinorFormatter)
# 设定 Y 轴主要坐标点的样式
for mil in axes.get_yticklabels(minor=True):
mil.set_font_properties(__font_properties__)
mil.set_fontsize(4) # 这个必须放在前一句后面,否则作用会被覆盖
else:
minorticks= list( [ma + (tostep/2.0) for ma in majorticks] )
yMinorLocator= FixedLocator(numpy.array(minorticks))
yaxis.set_minor_locator(yMinorLocator)
# 设定 Y 轴主要坐标点的样式
for mil in axes.get_yticklabels(minor=True):
mil.set_visible(False)
class SubPlot_TORate(SubPlot_TORateBase):
pass
class SubPlot_TORateFullSpan(SubPlot_TORateBase):
pass
class MyFigure:
'''
'''
def __init__(self, pdata):
self._pdata= pdata # 绘图数据
self._figfacecolor= __color_pink__
self._figedgecolor= __color_navy__
self._figdpi= 300
self._figlinewidth= 1.0
self._xfactor= 10.0 / 230.0 # x size * x factor = x length
self._yfactor= 0.3 # y size * y factor = y length
jobstat= pdata[u'任务描述']
self._xsize_left= 12.0 # left blank
self._xsize_right= 12.0 # right blank
self._ysize_top= 0.3 # top blank
self._ysize_bottom= 1.2 # bottom blank
self._ysize_gap1= 0.2
self._ysize_gap2= 0.3 if (jobstat[u'历史价格子图'] or jobstat[u'历史换手率子图'] or jobstat[u'财务指标子图']) else 0.0
# 建立 X 轴参数
#===============================================================================================================
if jobstat[u'价格子图'] or jobstat[u'换手率子图']:
xparams= {'xmargin': 1}
xparams.update(self._compute_xparams()) # 与 X 轴坐标点相关的数据结构
if jobstat[u'历史价格子图'] or jobstat[u'历史换手率子图'] or jobstat[u'财务指标子图']:
xparams_fs= {'xmargin': 3}
xparams_fs.update(self._compute_xparams_fullspan())
# 建立子图对象
#===============================================================================================================
self._subplots= {}
if jobstat[u'公司信息子图']:
name= 'basic'
self._subplots[name]= SubPlot_BasicInfo(pdata=pdata, parent=self, name=name)
if jobstat[u'历史价格子图']: # XXX: 这个要放在 价格子图 前面,因为后者可能会用到它的 Y 轴坐标点位置
name= 'pricefs'
self._subplots[name]= SubPlot_PriceFullSpan(pdata=pdata, parent=self, xparams=xparams_fs, name=name)
if jobstat[u'价格子图']:
name= 'price'
self._subplots[name]= SubPlot_Price(pdata=pdata, parent=self, xparams=xparams, name=name)
if jobstat[u'财务指标子图']:
name= 'financial'
self._subplots[name]= SubPlot_Financial(pdata=pdata, parent=self, xparams=xparams_fs, name=name)
if jobstat[u'换手率子图']:
name= 'torate'
self._subplots[name]= SubPlot_TORate(pdata=pdata, parent=self, xparams=xparams, name=name)
if jobstat[u'历史换手率子图']:
name= 'toratefs'
self._subplots[name]= SubPlot_TORateFullSpan(pdata=pdata, parent=self, xparams=xparams_fs, name=name)
# 根据子图对象的尺寸计算自身的尺寸
#===============================================================================================================
self._xsize, \
self._ysize= self._compute_size()
self._xlength= self._xsize * self._xfactor
self._ylength= self._ysize * self._yfactor
# 根据计算出的尺寸建立 Figure 对象
#===============================================================================================================
self._Fig= pyplot.figure(figsize=(self._xlength, self._ylength), dpi=self._figdpi, facecolor=self._figfacecolor, \
edgecolor=self._figedgecolor, linewidth=self._figlinewidth) # Figure 对象
# 用新建立的 Figure 对象交给子图对象,完成子图对象的初始化
#===============================================================================================================
rects= self._compute_rect()
if 'basic' in self._subplots:
self._subplots['basic'].build_axes(figobj=self._Fig, rect=rects['basic'])
# XXX: 这个要放在 price 前面,因为后者要用到它的 Axes 对象
if 'torate' in self._subplots:
self._subplots['torate'].build_axes(figobj=self._Fig, rect=rects['torate'])
if 'price' in self._subplots:
self._subplots['price'].build_axes(figobj=self._Fig, rect=rects['price'])
# XXX: 这个要放在 pricefs 前面
if 'toratefs' in self._subplots:
self._subplots['toratefs'].build_axes(figobj=self._Fig, rect=rects['toratefs'])
if 'pricefs' in self._subplots:
self._subplots['pricefs'].build_axes(figobj=self._Fig, rect=rects['pricefs'])
def _compute_size(self):
'''
根据子图的尺寸计算自身尺寸
'''
pdata= self._pdata
jobstat= pdata[u'任务描述']
x_left, x_right= self._xsize_left, self._xsize_right
y_top, y_bottom= self._ysize_top, self._ysize_bottom
y_gap1= self._ysize_gap1
y_gap2= self._ysize_gap2
x_basic, y_basic= self._subplots['basic'].get_size() if 'basic' in self._subplots else (0.0, 0.0)
x_price, y_price= self._subplots['price'].get_size() if 'price' in self._subplots else (0.0, 0.0)
x_pricefs, y_pricefs= self._subplots['pricefs'].get_size() if 'pricefs' in self._subplots else (0.0, 0.0)
x_torate, y_torate= self._subplots['torate'].get_size() if 'torate' in self._subplots else (0.0, 0.0)
x_toratefs, y_toratefs= self._subplots['toratefs'].get_size() if 'toratefs' in self._subplots else (0.0, 0.0)
x_financial, y_financial= self._subplots['financial'].get_size() if 'financial' in self._subplots else (0.0, 0.0)
x_all= x_left + max(x_price, x_basic, x_pricefs) + x_right
y_all= y_top + y_basic + y_gap1 + y_pricefs + y_toratefs + y_financial + y_gap2 + y_price + y_torate + y_bottom
return (x_all, y_all)
def get_sizeset(self):
sizeset= {
'x': self._xsize,
'y': self._ysize,
'top': self._ysize_top,
'bottom': self._ysize_bottom,
'left': self._xsize_left,
'right': self._xsize_right
}
return sizeset
def _compute_rect(self):
'''
'''
pdata= self._pdata
jobstat= pdata[u'任务描述']
x_left= self._xsize_left
x_right= self._xsize_right
y_top= self._ysize_top
y_bottom= self._ysize_bottom
x_all= self._xsize
y_all= self._ysize
y_gap1= self._ysize_gap1 # basic 与 financial 之间的空隙
y_gap2= self._ysize_gap2 # toratefs 与 price 之间的空隙
x_basic, y_basic= self._subplots['basic'].get_size() if 'basic' in self._subplots else (0.0, 0.0)
x_price, y_price= self._subplots['price'].get_size() if 'price' in self._subplots else (0.0, 0.0)
x_pricefs, y_pricefs= self._subplots['pricefs'].get_size() if 'pricefs' in self._subplots else (0.0, 0.0)
x_torate, y_torate= self._subplots['torate'].get_size() if 'torate' in self._subplots else (0.0, 0.0)
x_toratefs, y_toratefs= self._subplots['toratefs'].get_size() if 'toratefs' in self._subplots else (0.0, 0.0)
x_financial, y_financial= self._subplots['financial'].get_size() if 'financial' in self._subplots else (0.0, 0.0)
rects= {}
if 'basic' in self._subplots:
rect= ((x_left + (x_all-x_left-x_right-x_basic)/2) / x_all, (y_all - y_top - y_basic)/y_all, x_basic/x_all, y_basic/y_all) # K线图部分
rects['basic']= rect
if 'price' in self._subplots:
rect= ((x_left + (x_all-x_left-x_right-x_price)/2) / x_all, (y_bottom + y_torate)/y_all, x_price/x_all, y_price/y_all) # K线图部分
rects['price']= rect
if 'torate' in self._subplots:
rect= ((x_left + (x_all-x_left-x_right-x_torate)/2)/x_all, y_bottom/y_all, x_torate/x_all, y_torate/y_all) # 成交量部分
rects['torate']= rect
if 'pricefs' in self._subplots:
rect= ((x_left + (x_all-x_left-x_right-x_pricefs)/2)/x_all, (y_all - y_top - y_basic - y_gap1 - y_pricefs)/y_all, x_pricefs/x_all, y_pricefs/y_all)
rects['pricefs']= rect
if 'toratefs' in self._subplots:
rect= ((x_left + (x_all-x_left-x_right-x_toratefs)/2)/x_all, (y_bottom + y_torate + y_price + y_gap2)/y_all, x_toratefs/x_all, y_toratefs/y_all)
rects['toratefs']= rect
return rects
def _compute_xparams(self):
'''
主要坐标点是每月第一个交易日,辅助坐标点是每周第一个交易日
'''
quotes= self._pdata[u'行情']
sidx= self._pdata[u'任务描述'][u'起始偏移']
eidx= self._pdata[u'任务描述'][u'结束偏移']
# 设定 X 轴上的坐标
#==================================================================================================================================================
datelist= [ datetime.date(int(ys), int(ms), int(ds)) for ys, ms, ds in [ dstr.split('-') for dstr in quotes[u'日期'][sidx:eidx] ] ]
# 确定 X 轴的 MajorLocator
mdindex= [] # 每个月第一个交易日在所有日期列表中的 index
allyears= set([d.year for d in datelist]) # 所有的交易年份
for yr in sorted(allyears):
allmonths= set([d.month for d in datelist if d.year == yr]) # 当年所有的交易月份
for mon in sorted(allmonths):
monthday= min([dt for dt in datelist if dt.year==yr and dt.month==mon]) # 当月的第一个交易日
mdindex.append(datelist.index(monthday))
xMajorLocator= FixedLocator(numpy.array(mdindex))
# 确定 X 轴的 MinorLocator
wdindex= {} # value: 每周第一个交易日在所有日期列表中的 index; key: 当周的序号 week number(当周是第几周)
for d in datelist:
isoyear, weekno= d.isocalendar()[0:2]
dmark= isoyear*100 + weekno
if dmark not in wdindex:
wdindex[dmark]= datelist.index(d)
wdindex= sorted(wdindex.values())
xMinorLocator= FixedLocator(numpy.array(wdindex))
# 确定 X 轴的 MajorFormatter 和 MinorFormatter
def x_major_formatter(idx, pos=None):
return datelist[idx].strftime('%Y-%m-%d')
def x_minor_formatter(idx, pos=None):
return datelist[idx].strftime('%m-%d')
xMajorFormatter= FuncFormatter(x_major_formatter)
xMinorFormatter= FuncFormatter(x_minor_formatter)
return {'xMajorLocator': xMajorLocator,
'xMinorLocator': xMinorLocator,
'xMajorFormatter': xMajorFormatter,
'xMinorFormatter': xMinorFormatter,
'mdindex': mdindex,
'wdindex': wdindex
}
def _compute_xparams_fullspan(self):
'''
主要坐标点是每季第一个交易日,辅助坐标点是每月第一个交易日。是给宏观子图用的。
'''
quotes= self._pdata[u'行情']
datelist= [ datetime.date(int(ys), int(ms), int(ds)) for ys, ms, ds in [ dstr.split('-') for dstr in quotes[u'日期'] ] ]
# 确定 X 轴的 MinorLocator
mdindex= [] # 每个月第一个交易日在所有日期列表中的 index
sdindex= [] # 每季度第一个交易日在所有日期列表中的 index
ydindex= [] # 每年第一个交易日在所有日期列表中的 index
allyears= set([d.year for d in datelist]) # 所有的交易年份
for yr in sorted(allyears):
allmonths= set([d.month for d in datelist if d.year == yr]) # 当年所有的交易月份
for mon in sorted(allmonths):
monthday= min([dt for dt in datelist if dt.year==yr and dt.month==mon]) # 当月的第一个交易日
idx= datelist.index(monthday)
if mon in (1, 4, 7, 10):
sdindex.append(idx)
if mon == 1:
ydindex.append(idx)
else:
mdindex.append(idx)
xMajorLocator= FixedLocator(numpy.array(sdindex))
xMinorLocator= FixedLocator(numpy.array(mdindex))
# 确定 X 轴的 MajorFormatter 和 MinorFormatter
def x_major_formatter(idx, pos=None):
return datelist[idx].strftime('%Y-%m-%d')
def x_minor_formatter(idx, pos=None):
return datelist[idx].strftime('%m-%d')
xMajorFormatter= FuncFormatter(x_major_formatter)
xMinorFormatter= FuncFormatter(x_minor_formatter)
return {'xMajorLocator': xMajorLocator,
'xMinorLocator': xMinorLocator,
'xMajorFormatter': xMajorFormatter,
'xMinorFormatter': xMinorFormatter,
'sdindex': sdindex,
'mdindex': mdindex,
'ydindex': ydindex
}
def plot(self):
'''
'''
# self.plot_title()
# 调用子图对象的绘图函数
if 'basic' in self._subplots:
self._subplots['basic'].plot()
if 'price' in self._subplots:
self._subplots['price'].plot()
if 'torate' in self._subplots:
self._subplots['torate'].plot()
if 'pricefs' in self._subplots:
self._subplots['pricefs'].plot()
if 'toratefs' in self._subplots:
self._subplots['toratefs'].plot()
def plot_title(self):
'''
绘制整个 Figure 的标题
'''
info= self._pdata[u'公司信息']
figobj= self._Fig
# 整个 figure 的标题
subtitle= (info[u'代码'] + ' ' if u'代码' in info else '') + info[u'简称']
subtitle_2= (info[u'代码二'] + ' ' if u'代码二' in info else '') + info[u'简称二']
figobj.suptitle(subtitle + ' / ' + subtitle_2, fontsize=12, fontproperties=__font_properties__)
def savefig(self, figpath):
'''
保存图片
'''
self._Fig.savefig(figpath, dpi=self._figdpi, facecolor=self._figfacecolor, edgecolor=self._figedgecolor, linewidth=self._figlinewidth)
if __name__ == '__main__':
# pfile 指明存放绘图数据的 pickle file,figpath 指定图片需存放的路径
pfile= sys.argv[1]
figpath= sys.argv[2]
# 绘图数据 pdata
fileobj= open(name=pfile, mode='rb')
pdata= pickle.load(fileobj)
fileobj.close()
os.remove(pfile)
myfig= MyFigure(pdata=pdata)
myfig.plot()
myfig.savefig(figpath=figpath)
2012年6月14日 14:00
您好!
试着运行了一下:
python draw_chart.py '数据文件名' .
什么也不显示。过几秒后程序退出。请问可能是什么原因,怎么解决?
谢谢!
2012年6月15日 01:48
@hyao: 是什么也不显示啊, 会生成一个图形文件放在你指定的目录下. 你第二个参数是拿 '.' 来表示当前目录? 我不知道行不行.
2012年6月15日 11:37
用tp作为目录,生成了tp.png;不过图上没有显示红色、绿色等K线数据,只有灰色的两条k线?
谢谢!
2012年6月15日 21:52
@hyao: 有人讲过这个问题,应该是 matplotlib 版本引起的。你找到这几行:
axes_2= axes.twinx()
axes.figure.axes[-2:]= [axes_2, axes]
axes.set_frame_on(False)
axes_2.set_frame_on(True)
然后删掉倒数第二行试试。不行就把后面三行一起删掉。
2012年7月02日 00:56
谢谢!
三行都删掉可以了。
2013年10月22日 22:49
请问博主 的pickle格式的数据是从什么地方下载的,数据的格式是什么样的?~
2013年10月23日 17:10
@eric: 见贴图上方那句话。要想清楚显示数据格式,可以下第四篇里的代码。
2014年1月01日 23:22
博主,这个 Python pickle file 用不了啊,44行提示没有“日期”这个key
2014年1月02日 00:17
@leodo: 44 行是一行注释。
2014年1月02日 16:32
双股价量.py 这里的44行,提示没有“日期”这个key
导出数据文件看确实没有这个key
2014年1月02日 16:55
@leodo: 那是上一版的代码,输入文件我没贴出来。这一版的输入文件没法用在上一版代码里。奇怪你们怎么都喜欢下旧版的代码,是因为短吗?我自己觉得新版的代码写的比旧版好得多。建议你下第四版的,只有第四版支持 py3 + matplotlib 1.3。
2014年1月02日 16:57
因为
1、可能以为是两套代码,而不是新版本代码
2、其实大家更喜欢用python2.7,因为3很多库都没有,所以手头大部分开发都用2.7
我试试新版本
2015年4月12日 16:04
博主画出来的图分辨率是跟显示器有关系吗?我在XP系统里,14"寸笔记本和17"台机出来的图size不一样,图都画出来了,但跟博主贴的分辨率比差太多,所以图都挤在一起去了,14"笔记本上出的图是1028*691的分辨率。执行时都有一个warning,是在matplotlib里的scale.py里。
2015年4月12日 22:54
@robbin: 如果是 RuntimeWarning 再加上 mask = a <= 0.0 什么的,那应该是新版 Matplotlib 引入的一个 bug,不影响画图。如果图太大超过限制就会是个 Error,根本画不出来。我画图一直用的 Linux 所以也不能确定具体原因,但是传给脚本的 绘图参数 里有一个叫 dpi 的项,是用来控制分辨率的,默认值 300 画出来就是贴图里那样,你可以试着把值改一下,看看有没有影响。
2015年4月13日 17:29
@Jacky Liu: 谢谢博主抽空回复。显示的是\Python27\lib\site-packages\matplotlib\scale.py:100: RuntimeWarning: invalid value encountered in less_equal
a[a <= 0.0] = 1e-300
我把self._figdpi= 300改为600,结果没有变化。
2015年4月13日 19:06
@robbin: Warning 的情况类似,初步估计不影响。我试着追过源头,结论是这个 Warning 是 Matplotlib 库里面一个编译好的 .so 文件产生的,没有源码追不下去了。我这画图是不影响的。不过不能肯定。
改 600 不行就改 100,改 50 试试。先确定这个值有没有用吧
2015年4月14日 09:29
@Jacky Liu: 谢谢博主,我光想着往大了改,改成100出来结果发现图画的比较全了,没有挤在一起去,分辨率没什么变化,那些K线图中 股价/指数 的数值就变很小了,看不清楚。
不管怎么样,图画出来了,谢谢博主分享这么好的范例。
2017年7月20日 16:21
膜拜 大神!!!
2018年7月27日 17:21
I have been seeking information on this topic for the past few hours and found your post to be well written and has solid information. Thank you!
2022年9月21日 16:24
Karnataka Model Paper 2023 Pdf Download for Karnataka State Education & Examination Board (KSEEB) Sample Question Bank for Class 1, 2, 3, 4, 5, 6, 7, 8, 9, 10 (SSLC), Pre-University (1st PUC & 2nd PUC) Question Paper for Kannada Medium, English Medium, Urdu Medium and other Students to Theory, Objective (MCQ) and Bit Question. Karnataka Board Model Paper New Exam Scheme or Question Pattern for Sammittive Assignment Exams (SA1 & SA2): Very Long Answer (VLA), Long Answer (LA), Small Answer (SA), Very Small Answer (VSA), Single Answer, Multiple Choice and etc.