Jacky Liu's Blog
用 Python / Matplotlib 画出来的股票 K线图 (三)
---- 前一篇在这: 用 Python / Matplotlib 画出来的股票 K线图 (二)
---- 后一篇在这: 用 Python / Matplotlib 画出来的股票 K线图 (四)
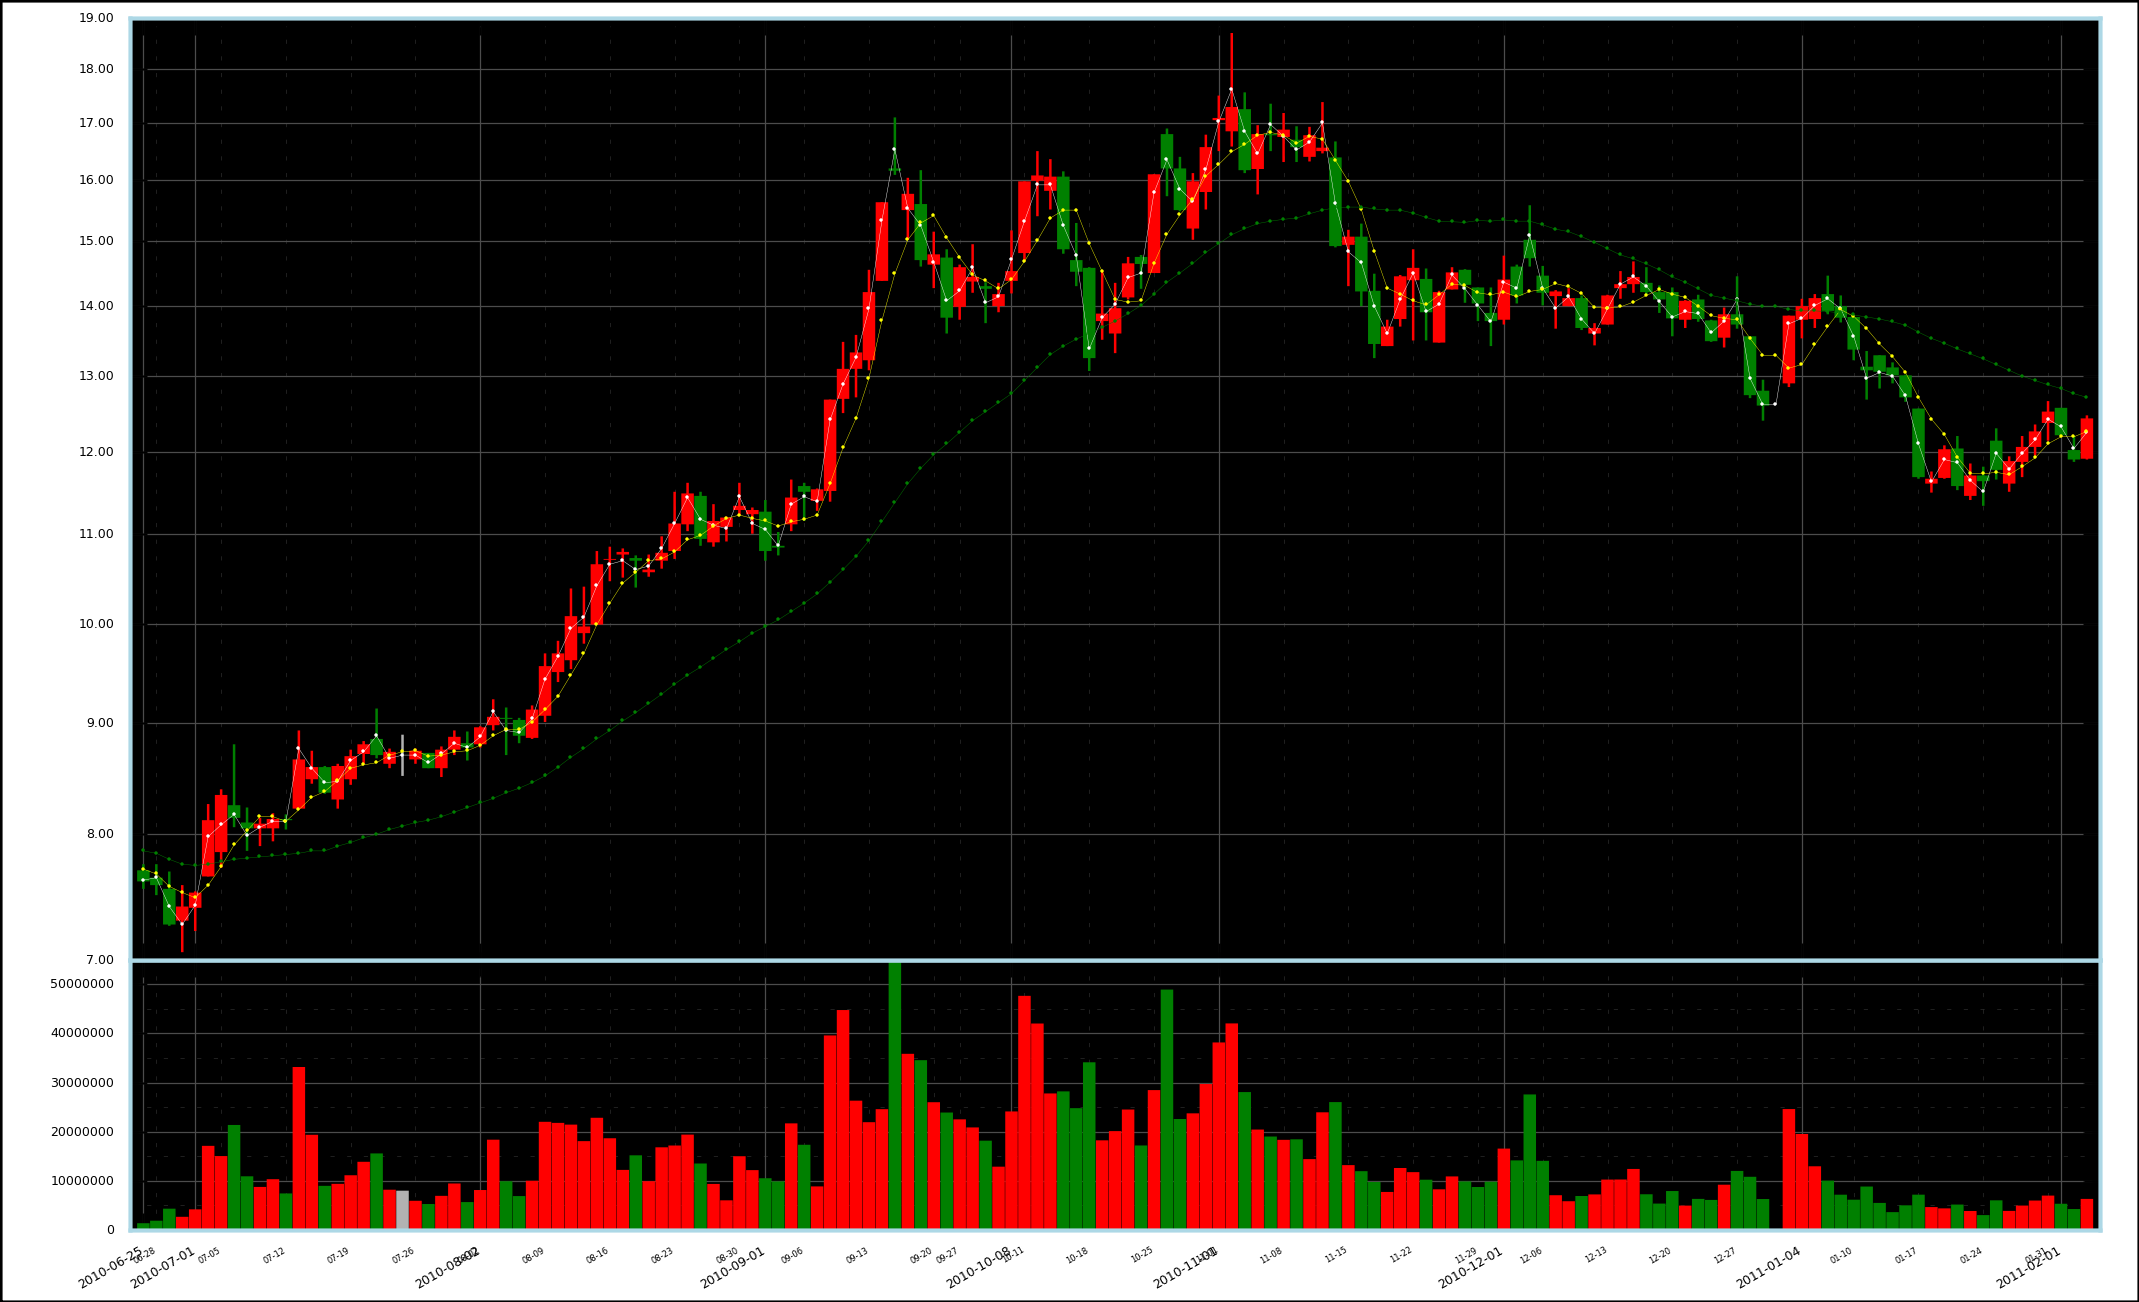
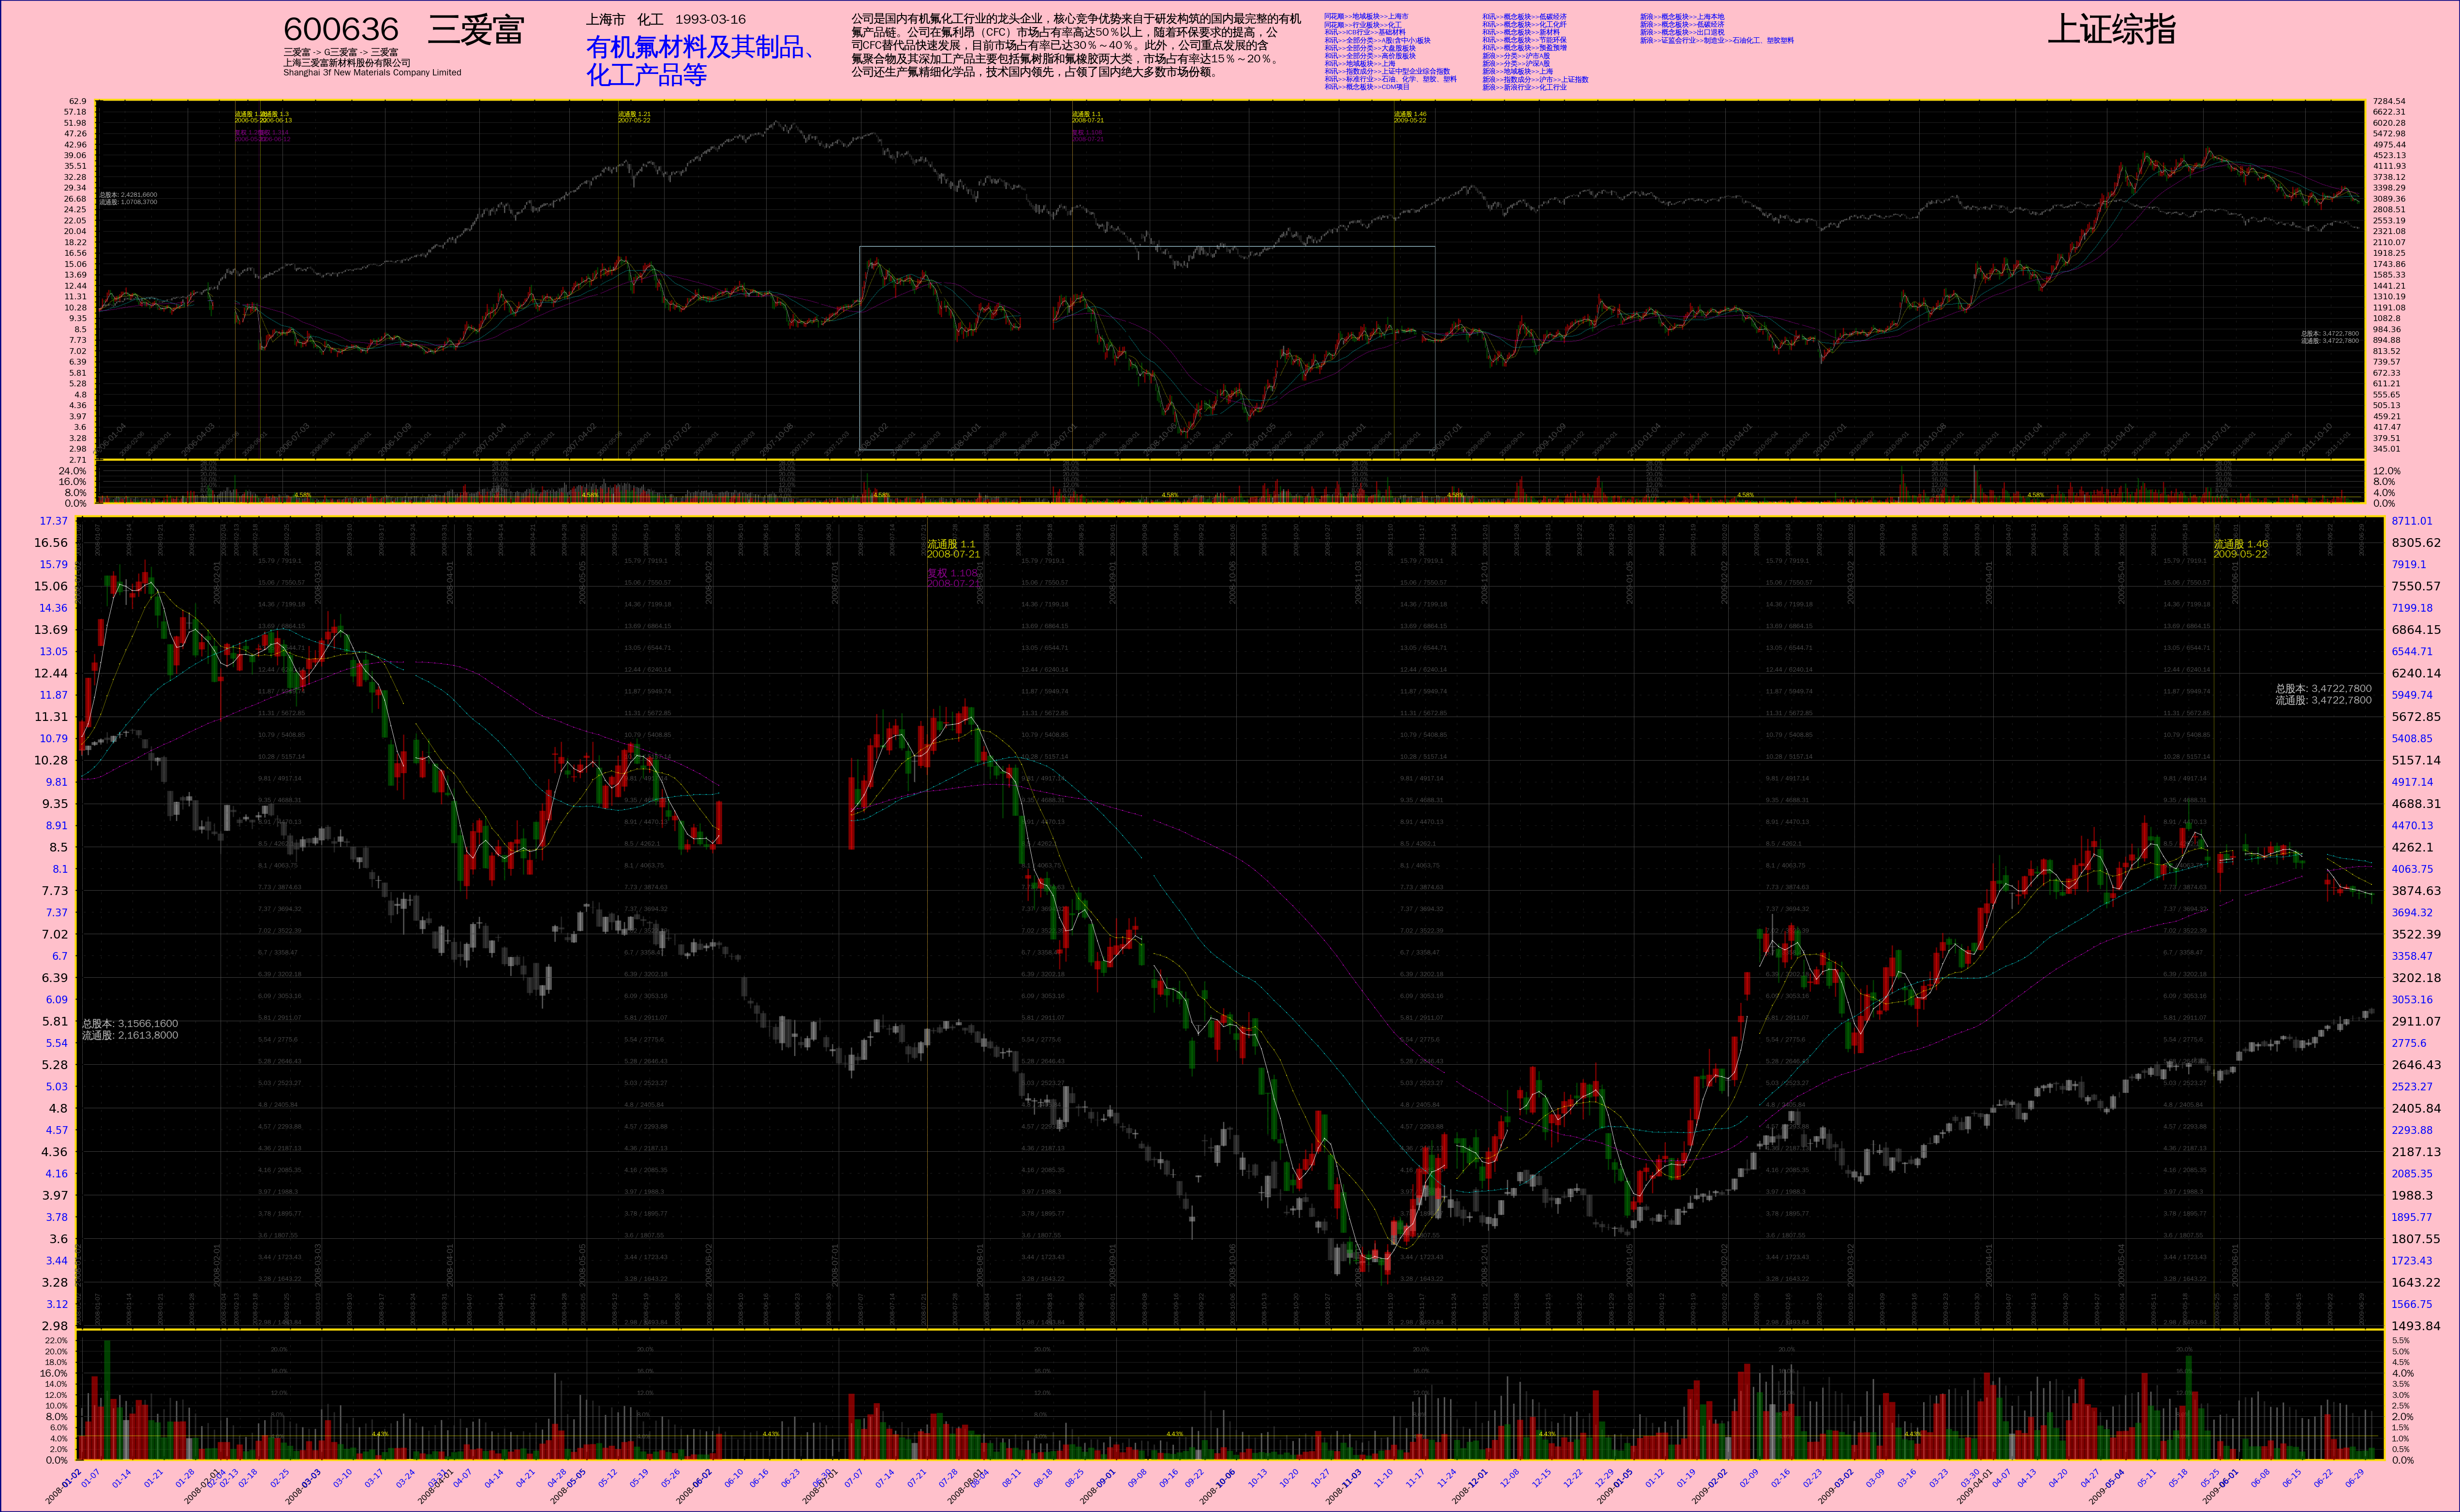
---- 就像上回说的,新内容加进来。除此之外,与上一版代码相比最大的改动就是内部重构过,子图全部定义成 class。图中一共包含 5 个子图,从上到下依次是: 基本信息(就是那些文字)、历史价格、历史换手率、价格、换手率。通过输入的绘图数据进行控制,任何一个子图都可以关闭,关闭子图可以节省绘图时间和存储空间。本来还有一个财务信息子图要加进去,但是现在想暂时告一段落,先弄点其它的。
---- 作为输入的 Python pickle file 在 这里。
---- 最后是脚本,仍然是 Python 2 的:
# -*- coding: utf-8 -*-
import os
import sys
import pickle
import math
import datetime
import itertools
import matplotlib
matplotlib.use("WXAgg", warn=True) # 这个要紧跟在 import matplotlib 之后,而且必须安装了 wxpython 2.8 才行。
import matplotlib.pyplot as pyplot
import matplotlib.font_manager as font_manager
import numpy
from matplotlib.ticker import NullLocator, FixedLocator, MultipleLocator, FuncFormatter, NullFormatter
from matplotlib.patches import Ellipse
__font_properties__= font_manager.FontProperties(fname='/usr/share/fonts/truetype/wqy/wqy-zenhei.ttc')
__color_lightsalmon__= '#ffa07a'
__color_pink__= '#ffc0cb'
__color_navy__= '#000080'
__color_gold__= '#FDDB05'
__color_gray30__= '0.3'
__color_gray70__= '0.7'
__color_lightblue__= 'lightblue'
__shrink__= 1.0 / 4
__expbase__= 1.1
class SubPlot_BasicInfo:
'''
公司的基本信息
Note: this is not "real" subplot, no Axes object contained.
'''
def __init__(self, pdata, parent, name):
self._name= name
self._pdata= pdata
self._cominfo= self._pdata[u'公司信息']
self._parent= parent
self._Axes= None
self._xsize, \
self._ysize= self._compute_size()
def _compute_size(self):
return (300.0, 1.8)
def get_size(self):
return (self._xsize, self._ysize)
def build_axes(self, figobj, rect):
axes= figobj.add_axes(rect)
axes.set_frame_on(False)
self._Axes= axes
self.set_xticks()
self.set_yticks()
def set_xticks(self):
axes= self._Axes
xaxis= axes.get_xaxis()
# 设定 X 轴坐标的范围
#==================================================================================================================================================
axes.set_xlim(0, self._xsize)
xaxis.set_major_locator(NullLocator())
for mal in axes.get_xticklabels(minor=False):
mal.set_visible(False)
for mil in axes.get_xticklabels(minor=True):
mil.set_visible(False)
def set_yticks(self):
axes= self._Axes
yaxis= axes.get_yaxis()
# 设定 X 轴坐标的范围
#==================================================================================================================================================
axes.set_ylim(0, self._ysize)
yaxis.set_major_locator(NullLocator())
for mal in axes.get_yticklabels(minor=False):
mal.set_visible(False)
for mil in axes.get_yticklabels(minor=True):
mil.set_visible(False)
def plot(self):
self.plot_codesymbol(xbase=0.0, ybase=self._ysize)
self.plot_codesymbol_2(xbase=self._xsize, ybase=self._ysize)
self.plot_companyname(xbase=0.0, ybase=self._ysize-0.8)
self.plot_companylocation(xbase=48.0, ybase=self._ysize)
self.plot_mainbusiness(xbase=48.0, ybase=self._ysize)
self.plot_description(xbase=90.0, ybase=self._ysize)
self.plot_sortinginfo(xbase=165.0, ybase=self._ysize)
def plot_codesymbol(self, xbase, ybase):
'''
交易代码、公司简称
'''
txtstr= self._cominfo[u'代码'] + u' ' + self._cominfo[u'简称']
label= self._Axes.text(xbase, ybase, txtstr, fontproperties=__font_properties__, verticalalignment='top', horizontalalignment='left')
label.set_fontsize(16.0)
def plot_codesymbol_2(self, xbase, ybase):
txtstr= self._cominfo[u'简称二']
label= self._Axes.text(xbase, ybase, txtstr, fontproperties=__font_properties__, verticalalignment='top', horizontalalignment='right')
label.set_fontsize(16.0)
def plot_companyname(self, xbase, ybase):
'''
曾用名、全名、英文名
'''
txtstr= self._cominfo[u'基本情况'][u'曾用名']
txtlist= txtstr.split('->')
if len(txtlist) > 15:
txtstr= ' -> '.join(txtlist[:5]) + ' ->\n' + ' -> '.join(txtlist[5:10]) + ' ->\n' + ' -> '.join(txtlist[10:15]) + ' ->\n' + ' -> '.join(txtlist[15:]) + '\n'
elif len(txtlist) > 10:
txtstr= ' -> '.join(txtlist[:5]) + ' ->\n' + ' -> '.join(txtlist[5:10]) + ' ->\n' + ' -> '.join(txtlist[10:]) + '\n'
elif len(txtlist) > 5:
txtstr= ' -> '.join(txtlist[:5]) + ' ->\n' + ' -> '.join(txtlist[5:]) + '\n'
else:
txtstr= ' -> '.join(txtlist) + '\n'
txtstr += self._cominfo[u'基本情况'][u'公司名称'] + '\n'
txtstr += self._cominfo[u'基本情况'][u'英文名称']
label= self._Axes.text(xbase, ybase, txtstr, fontproperties=__font_properties__, verticalalignment='top', horizontalalignment='left')
label.set_fontsize(4.5)
def plot_companylocation(self, xbase, ybase):
'''
地域、所属行业、上市日期
'''
txtstr= self._cominfo[u'公司概况'][u'区域'] + ' ' + self._cominfo[u'公司概况'][u'所属行业'] + ' ' + self._cominfo[u'发行相关'][u'上市日期']
label= self._Axes.text(xbase, ybase, txtstr, fontproperties=__font_properties__, verticalalignment='top', horizontalalignment='left')
label.set_fontsize(6.5)
def plot_mainbusiness(self, xbase, ybase):
'''
主营业务
'''
# 查找表: (<文字长度>, <每行字数>, <字体大小>, <Y轴偏移量>)
lookups= (
(20, 10, 12.0, 0.5),
(45, 15, 8.2, 0.5),
(80, 20, 6.2, 0.5),
(125, 25, 5.0, 0.5),
(180, 30, 4.1, 0.5),
(245, 35, 3.5, 0.4),
(999999, 37, 3.4, 0.4)
)
txtstr= self._cominfo[u'基本情况'][u'主营业务']
length= len(txtstr)
for sizelimit, linelimit, fontsize, yshift in lookups:
if length <= sizelimit:
txtstr= '\n'.join([txtstr[linelimit*idx : linelimit*(idx+1)] for idx in range(length//linelimit + 1)])
fsize= fontsize
ycoord= ybase - yshift
break
label= self._Axes.text(xbase, ycoord, txtstr, fontproperties=__font_properties__, verticalalignment='top', horizontalalignment='left', color='blue')
label.set_fontsize(fsize)
def plot_description(self, xbase, ybase):
'''
公司简介
'''
# 查找表: (<文字长度>, <每行字数>, <字体大小>)
lookups= (
(150, 30, 7.0),
(240, 40, 5.6),
(329, 47, 4.8),
(432, 54, 4.2),
(576, 64, 3.5),
(670, 67, 3.4),
(792, 72, 3.1),
(960, 80, 2.8),
(1222, 94, 2.4),
(1428, 102, 2.26),
(1620, 108, 2.12),
(1938, 114, 2.00),
(999999, 130, 1.75)
)
txtstr= self._cominfo[u'公司概况'][u'公司简介'] # 26 ~ 2600 字符
length= len(txtstr)
for sizelimit, linelimit, fontsize in lookups:
if length <= sizelimit:
txtstr= '\n'.join([txtstr[linelimit*idx : linelimit*(idx+1)] for idx in range(length//linelimit + 1)])
fsize= fontsize
break
label= self._Axes.text(xbase, ybase, txtstr, fontproperties=__font_properties__, verticalalignment='top', horizontalalignment='left')
label.set_fontsize(fsize)
def plot_sortinginfo(self, xbase, ybase):
'''
行业板块信息
'''
infolist= self._cominfo[u'行业板块']
for idx in range(len(infolist)//10 + 1):
txtstr= '\n'.join(infolist[10*idx : 10*(idx+1)])
if not txtstr:
break
xcoord= xbase + 25.0*idx
label= self._Axes.text(xcoord, ybase, txtstr, fontproperties=__font_properties__, verticalalignment='top', horizontalalignment='left', color='blue')
label.set_fontsize(3.4)
class SubPlot_Financial:
'''
换手率子图
'''
pass
class SubPlot_PriceBase:
'''
'''
def __init__(self, pdata, parent, xparams, name):
'''
'''
self._name= name # 派生类自己设置
self._pdata= pdata
self._parent= parent
self._expbase= __expbase__
self._xparams= xparams
self._shrink= __shrink__ if name == 'pricefs' else 1.0
# 绘图数据
quotes= pdata[u'行情']
if name == 'pricefs':
self._dates= quotes[u'日期']
self._open= quotes[u'开盘']
self._close= quotes[u'收盘']
self._high= quotes[u'最高']
self._low= quotes[u'最低']
if u'简化' in quotes: self._simple= quotes[u'简化']
# if u'换手率' in quotes: self._torate= quotes[u'换手率']
# if u'成交量' in quotes: self._volume= quotes[u'成交量']
# if u'成交额' in quotes: self._turnover= quotes[u'成交额']
if u'3日均' in quotes: self._average3= quotes[u'3日均']
if u'5日均' in quotes: self._average5= quotes[u'5日均']
if u'10日均' in quotes: self._average10= quotes[u'10日均']
if u'30日均' in quotes: self._average30= quotes[u'30日均']
if u'60日均' in quotes: self._average60= quotes[u'60日均']
if u'开盘二' in quotes:
self._open_2= quotes[u'开盘二']
self._close_2= quotes[u'收盘二']
self._high_2= quotes[u'最高二']
self._low_2= quotes[u'最低二']
if u'简化二' in quotes: self._simple_2= quotes[u'简化二']
# if u'换手率二' in quotes: self._torate_2= quotes[u'换手率二']
# if u'成交量二' in quotes: self._volume_2= quotes[u'成交量二']
# if u'成交额二' in quotes: self._turnover_2= quotes[u'成交额二']
if u'3日均二' in quotes: self._average3_2= quotes[u'3日均二']
if u'5日均二' in quotes: self._average5_2= quotes[u'5日均二']
if u'10日均二' in quotes: self._average10_2= quotes[u'10日均二']
if u'30日均二' in quotes: self._average30_2= quotes[u'30日均二']
if u'60日均二' in quotes: self._average60_2= quotes[u'60日均二']
else:
sidx, eidx= pdata[u'任务描述'][u'起始偏移'], pdata[u'任务描述'][u'结束偏移']
self._dates= quotes[u'日期'][sidx:eidx]
self._open= quotes[u'开盘'][sidx:eidx]
self._close= quotes[u'收盘'][sidx:eidx]
self._high= quotes[u'最高'][sidx:eidx]
self._low= quotes[u'最低'][sidx:eidx]
if u'简化' in quotes: self._simple= quotes[u'简化'][sidx:eidx]
# if u'换手率' in quotes: self._torate= quotes[u'换手率'][sidx:eidx]
# if u'成交量' in quotes: self._volume= quotes[u'成交量'][sidx:eidx]
# if u'成交额' in quotes: self._turnover= quotes[u'成交额'][sidx:eidx]
if u'3日均' in quotes: self._average3= quotes[u'3日均'][sidx:eidx]
if u'5日均' in quotes: self._average5= quotes[u'5日均'][sidx:eidx]
if u'10日均' in quotes: self._average10= quotes[u'10日均'][sidx:eidx]
if u'30日均' in quotes: self._average30= quotes[u'30日均'][sidx:eidx]
if u'60日均' in quotes: self._average60= quotes[u'60日均'][sidx:eidx]
if u'开盘二' in quotes:
self._open_2= quotes[u'开盘二'][sidx:eidx]
self._close_2= quotes[u'收盘二'][sidx:eidx]
self._high_2= quotes[u'最高二'][sidx:eidx]
self._low_2= quotes[u'最低二'][sidx:eidx]
if u'简化二' in quotes: self._simple_2= quotes[u'简化二'][sidx:eidx]
# if u'换手率二' in quotes: self._torate_2= quotes[u'换手率二'][sidx:eidx]
# if u'成交量二' in quotes: self._volume_2= quotes[u'成交量二'][sidx:eidx]
# if u'成交额二' in quotes: self._turnover_2= quotes[u'成交额二'][sidx:eidx]
if u'3日均二' in quotes: self._average3_2= quotes[u'3日均二'][sidx:eidx]
if u'5日均二' in quotes: self._average5_2= quotes[u'5日均二'][sidx:eidx]
if u'10日均二' in quotes: self._average10_2= quotes[u'10日均二'][sidx:eidx]
if u'30日均二' in quotes: self._average30_2= quotes[u'30日均二'][sidx:eidx]
if u'60日均二' in quotes: self._average60_2= quotes[u'60日均二'][sidx:eidx]
self._length= len(self._dates) # XXX: 由派生类设定
# 衍生数据
#==============================================================================================================
self._xindex= numpy.arange(self._length) # X 轴上的 index,一个辅助数据
self._zipoc= zip(self._open, self._close)
self._up= numpy.array( [ True if po < pc and po is not None else False for po, pc in self._zipoc] ) # 标示出该天股价日内上涨的一个序列
self._down= numpy.array( [ True if po > pc and po is not None else False for po, pc in self._zipoc] ) # 标示出该天股价日内下跌的一个序列
self._side= numpy.array( [ True if po == pc and po is not None else False for po, pc in self._zipoc] ) # 标示出该天股价日内走平的一个序列
if u'开盘二' in quotes:
self._zipoc_2= zip(self._open_2, self._close_2)
self._up_2= numpy.array( [ True if po < pc and po is not None else False for po, pc in self._zipoc_2] ) # 标示出该天股价日内上涨的一个序列
self._down_2= numpy.array( [ True if po > pc and po is not None else False for po, pc in self._zipoc_2] ) # 标示出该天股价日内下跌的一个序列
self._side_2= numpy.array( [ True if po == pc and po is not None else False for po, pc in self._zipoc_2] ) # 标示出该天股价日内走平的一个序列
self._Axes= None
self._AxisX= None
self._AxisY= None
self._xsize= 0.0
self._ysize= 0.0
self._yhighlim= 0 # Y 轴最大坐标
self._ylowlim= 0 # Y 轴最小坐标
if u'开盘二' in self._pdata[u'行情']:
self._Axes_2= None # 如果有第二个行情数据,就建立另一个 Axes 对象
self._AxisX_2= None
self._AxisY_2= None
self._yhighlim_2= 0 # Y 轴最大坐标
self._ylowlim_2= 0 # Y 轴最小坐标
self._compute_size()
self._ytickset= self._compute_ytickset() # 需放在前一句后面
def _compute_size(self):
'''
根据绘图数据 pdata 计算出本子图的尺寸,修改数据成员
'''
quotes= self._pdata[u'行情']
popen= self._open[0] # int 类型
phigh= max( [ph for ph in self._high if ph is not None] ) # 最高价
plow= min( [pl for pl in self._low if pl is not None] ) # 最低价
# Y 轴范围
if self._name == 'pricefs':
yhighlim= phigh * 1.2 # K线子图 Y 轴最大坐标
ylowlim= plow / 1.2 # K线子图 Y 轴最小坐标
else:
yhighlim= phigh * 1.1 # K线子图 Y 轴最大坐标
ylowlim= plow / 1.1 # K线子图 Y 轴最小坐标
self._yhighlim= yhighlim
self._ylowlim= ylowlim
if u'开盘二' in quotes:
popen_2= self._open_2[0] # 同上
phigh_2= max( [ph for ph in self._high_2 if ph is not None] ) # 第二个行情的最高价
phigh= max(phigh, int(phigh_2 * popen / float(popen_2))) # 以第一个行情为基准修正出的总最高价
plow_2= min( [pl for pl in self._low_2 if pl is not None] ) # 最低价
plow= min(plow, int(plow_2 * popen / float(popen_2))) # 以第一个行情为基准修正出的总最低价
if self._name == 'pricefs':
yhighlim= phigh * 1.2 # K线子图 Y 轴最大坐标
ylowlim= plow / 1.2 # K线子图 Y 轴最小坐标
else:
yhighlim= phigh * 1.1 # K线子图 Y 轴最大坐标
ylowlim= plow / 1.1 # K线子图 Y 轴最小坐标
ylowlim_2= ylowlim * popen_2 / float(popen)
yhighlim_2= yhighlim * popen_2 / float(popen)
self._yhighlim= yhighlim
self._ylowlim= ylowlim
self._yhighlim_2= yhighlim_2
self._ylowlim_2= ylowlim_2
# XXX: 价格在 Y 轴上的 “份数”。注意,虽然最高与最低价是以第一个行情为基准修正出来的,但其中包含的倍数因子对结果无影响,即:
# log(base, num1) - log(base, num2) ==
# log(base, num1/num2) ==
# log(base, k*num1/k*num2) ==
# log(base, k*num1) - log(base, k*num2)
# ,这是对数运算的性质。
xmargin= self._xparams['xmargin']
self._xsize= (self._length + xmargin*2) * self._shrink # int, 所有数据的长度,就是天数
self._ysize= (math.log(yhighlim, self._expbase) - math.log(ylowlim, self._expbase)) * self._shrink # float
def get_size(self):
return (self._xsize, self._ysize)
def get_ylimits(self):
return (self._yhighlim, self._ylowlim)
def build_axes(self, figobj, rect):
'''
初始化 self._Axes 对象
'''
# 添加 Axes 对象
#==================================================================================================================================================
if self._name == 'price' and 'torate' in self._parent._subplots:
sharex= self._parent._subplots['torate'].get_axes()
axes= figobj.add_axes(rect, axis_bgcolor='black', sharex=sharex)
elif self._name == 'pricefs' and 'toratefs' in self._parent._subplots:
sharex= self._parent._subplots['toratefs'].get_axes()
axes= figobj.add_axes(rect, axis_bgcolor='black', sharex=sharex)
else:
axes= figobj.add_axes(rect, axis_bgcolor='black')
axes.set_axisbelow(True) # 网格线放在底层
# axes.set_zorder(1) # XXX: 不顶用
# axes.patch.set_visible(False) # hide the 'canvas'
axes.set_yscale('log', basey=self._expbase) # 使用对数坐标
# 改变坐标线的颜色
#==================================================================================================================================================
for child in axes.get_children():
if isinstance(child, matplotlib.spines.Spine):
child.set_color(__color_gold__)
# 得到 X 轴 和 Y 轴 的两个 Axis 对象
#==================================================================================================================================================
xaxis= axes.get_xaxis()
yaxis= axes.get_yaxis()
# 设置两个坐标轴上的网格线
#==================================================================================================================================================
xaxis.grid(True, 'major', color='0.3', linestyle='solid', linewidth=0.2)
xaxis.grid(True, 'minor', color='0.3', linestyle='dotted', linewidth=0.1)
if self._name == 'pricefs': # 如果是小图,就不设辅助网格线
yaxis.grid(True, 'major', color='0.3', linestyle='solid', linewidth=0.1)
else:
yaxis.grid(True, 'major', color='0.3', linestyle='solid', linewidth=0.2)
yaxis.grid(True, 'minor', color='0.3', linestyle='dotted', linewidth=0.1)
yaxis.set_label_position('left')
self._Axes= axes
self._AxisX= xaxis
self._AxisY= yaxis
if u'开盘二' in self._pdata[u'行情']:
# 添加 Axes 对象。注意,设置 axes_2 而不是 axes 的网格线,从而不会跑到 axes 边框上边的做法不顶用。
#==================================================================================================================================================
axes_2= axes.twinx() # twinx is problematic, no use no more.
# XXX: 下面这三行把第一个 axes 放在上面,这样不会被第二个 axes 的图形遮盖。用 zorder 不顶用。
axes.figure.axes[-2:]= [axes_2, axes] # XXX:
axes.set_frame_on(False) # 如果不做此设定,axes_2 的内容会看不见
axes_2.set_frame_on(True)
axes_2.set_axis_bgcolor('black')
axes_2.set_axisbelow(True) # 网格线放在底层
axes_2.set_yscale('log', basey=self._expbase) # 使用对数坐标
# 改变坐标线的颜色
#==================================================================================================================================================
for child in axes_2.get_children():
if isinstance(child, matplotlib.spines.Spine):
child.set_color(__color_gold__)
# 得到 X 轴 和 Y 轴 的两个 Axis 对象
#==================================================================================================================================================
xaxis_2= axes_2.get_xaxis()
yaxis_2= axes_2.get_yaxis()
# 设置两个坐标轴上的网格线
#==================================================================================================================================================
# xaxis_2.grid(True, 'major', color='0.3', linestyle='solid', linewidth=0.2)
# xaxis_2.grid(True, 'minor', color='0.3', linestyle='dotted', linewidth=0.1)
# if self._name == 'pricefs': # 如果是小图,就不设辅助网格线
# yaxis_2.grid(True, 'major', color='0.3', linestyle='solid', linewidth=0.1)
# else:
# yaxis_2.grid(True, 'major', color='0.3', linestyle='solid', linewidth=0.2)
# yaxis_2.grid(True, 'minor', color='0.3', linestyle='dotted', linewidth=0.1)
yaxis_2.set_label_position('right')
self._Axes_2= axes_2
self._AxisX_2= xaxis_2
self._AxisY_2= yaxis_2
def set_xticks(self):
xMajorLocator= self._xparams['xMajorLocator']
xMinorLocator= self._xparams['xMinorLocator']
axes= self._Axes
xaxis= self._AxisX
# 设定 X 轴坐标的范围
#==================================================================================================================================================
xmargin= self._xparams['xmargin']
axes.set_xlim(-xmargin, self._length + xmargin)
# 先设置 label 位置,再将 X 轴上的坐标设为不可见。因为与 成交量子图 共用 X 轴
#==================================================================================================================================================
# 设定 X 轴的 Locator 和 Formatter
xaxis.set_major_locator(xMajorLocator)
# xaxis.set_major_formatter(xMajorFormatter)
xaxis.set_minor_locator(xMinorLocator)
# xaxis.set_minor_formatter(xMinorFormatter)
# 将 X 轴上的坐标设为不可见。
for mal in axes.get_xticklabels(minor=False):
mal.set_visible(False)
for mil in axes.get_xticklabels(minor=True):
mil.set_visible(False)
def set_xticks_2(self):
quotes= self._pdata[u'行情']
axes= self._Axes_2
xaxis= self._AxisX_2
xMajorLocator= self._xparams['xMajorLocator']
xMinorLocator= self._xparams['xMinorLocator']
# 设定 X 轴坐标的范围
#==================================================================================================================================================
xmargin= self._xparams['xmargin']
axes.set_xlim(-xmargin, self._length + xmargin)
# 先设置 label 位置,再将 X 轴上的坐标设为不可见。因为与 成交量子图 共用 X 轴
#==================================================================================================================================================
# 设定 X 轴的 Locator 和 Formatter
xaxis.set_major_locator(xMajorLocator)
# xaxis.set_major_formatter(xMajorFormatter)
xaxis.set_minor_locator(xMinorLocator)
# xaxis.set_minor_formatter(xMinorFormatter)
# 将 X 轴上的坐标设为不可见。
for mal in axes.get_xticklabels(minor=False):
mal.set_visible(False)
for mil in axes.get_xticklabels(minor=True):
mil.set_visible(False)
def _compute_ytickset(self):
'''
计算 Y 轴坐标点的位置,包括第二个行情
'''
quotes= self._pdata[u'行情']
expbase= self._expbase
ytickset= {}
yhighlim= self._yhighlim
ylowlim= self._ylowlim
if u'开盘二' in quotes:
yhighlim_2= self._yhighlim_2
ylowlim_2= self._ylowlim_2
if self._name == 'price' and 'pricefs' in self._parent._subplots:
tsetfs= self._parent._subplots['pricefs'].get_ytickset()
majors= tsetfs['major']
while majors[-1] < yhighlim: majors.append(majors[-1] * expbase)
while majors[0] > ylowlim: majors.insert(0, majors[0] / expbase)
minors= tsetfs['minor']
while minors[-1] < yhighlim: minors.append(minors[-1] * expbase)
while minors[0] > ylowlim: minors.insert(0, minors[0] / expbase)
ytickset['major']= [loc for loc in majors if loc > ylowlim and loc < yhighlim]
ytickset['minor']= [loc for loc in minors if loc > ylowlim and loc < yhighlim]
else:
# 主要坐标点
#----------------------------------------------------------------------------
majors= [ylowlim]
while majors[-1] < yhighlim: majors.append(majors[-1] * 1.1)
# 辅助坐标点
#----------------------------------------------------------------------------
minors= [ylowlim * 1.1**0.5]
while minors[-1] < yhighlim: minors.append(minors[-1] * 1.1)
ytickset['major']= [loc for loc in majors if loc > ylowlim and loc < yhighlim] # 注意,第一项(ylowlim)被排除掉了
ytickset['minor']= [loc for loc in minors if loc > ylowlim and loc < yhighlim]
if u'开盘二' in quotes:
popen= self._open[0] # int 类型
popen_2= self._open_2[0] # 同上
ytickset['major_2']= [loc * popen_2 / popen for loc in ytickset['major']]
ytickset['minor_2']= [loc * popen_2 / popen for loc in ytickset['minor']]
return ytickset
def get_ytickset(self):
return self._ytickset
def set_yticks(self):
'''
设置第一只行情的 Y 轴坐标,包括坐标值在图中间的显示
'''
axes= self._Axes
ylowlim= self._ylowlim
yhighlim= self._yhighlim
yaxis= self._AxisY
majorticks= self._ytickset['major']
minorticks= self._ytickset['minor']
# 设定 Y 轴坐标的范围
#==================================================================================================================================================
axes.set_ylim(ylowlim, yhighlim)
# 设定 Y 轴上的坐标
#==================================================================================================================================================
# 主要坐标点
#----------------------------------------------------------------------------
yMajorLocator= FixedLocator(numpy.array(majorticks))
# 确定 Y 轴的 MajorFormatter
def y_major_formatter(num, pos=None):
return str(round(num/1000.0, 2))
yMajorFormatter= FuncFormatter(y_major_formatter)
# 设定 X 轴的 Locator 和 Formatter
yaxis.set_major_locator(yMajorLocator)
yaxis.set_major_formatter(yMajorFormatter)
# 设定 Y 轴主要坐标点与辅助坐标点的样式
fsize= 4 if self._name == 'pricefs' else 6
for mal in axes.get_yticklabels(minor=False):
mal.set_fontsize(fsize)
# 辅助坐标点
#----------------------------------------------------------------------------
yMinorLocator= FixedLocator(numpy.array(minorticks))
# 确定 Y 轴的 MinorFormatter
def y_minor_formatter(num, pos=None):
return str(round(num/1000.0, 2))
yMinorFormatter= FuncFormatter(y_minor_formatter)
# 设定 X 轴的 Locator 和 Formatter
yaxis.set_minor_locator(yMinorLocator)
yaxis.set_minor_formatter(yMinorFormatter)
# 设定 Y 轴辅助坐标点的样式
if self._name == 'pricefs':
for mil in axes.get_yticklabels(minor=True):
mil.set_visible(False)
else:
for mil in axes.get_yticklabels(minor=True):
mil.set_fontsize(5)
mil.set_color('blue')
def set_yticks_2(self):
'''
子图右侧的 Y 轴坐标
'''
axes= self._Axes_2
yaxis= self._AxisY_2
yhighlim_2= self._yhighlim_2
ylowlim_2= self._ylowlim_2
majorticks_2= self._ytickset['major_2']
minorticks_2= self._ytickset['minor_2']
# 设定 Y 轴坐标的范围
#==================================================================================================================================================
axes.set_ylim(ylowlim_2, yhighlim_2)
# 设定 Y 轴上的坐标
#==================================================================================================================================================
# 主要坐标点
#----------------------------------------------------------------------------
yMajorLocator= FixedLocator(numpy.array(majorticks_2))
# 确定 Y 轴的 MajorFormatter
def y_major_formatter(num, pos=None):
return str(round(num/1000.0, 2))
yMajorFormatter= FuncFormatter(y_major_formatter)
# 设定 X 轴的 Locator 和 Formatter
yaxis.set_major_locator(yMajorLocator)
yaxis.set_major_formatter(yMajorFormatter)
# 设定 Y 轴主要坐标点与辅助坐标点的样式
fsize= 4 if self._name == 'pricefs' else 6
for mal in axes.get_yticklabels(minor=False):
mal.set_fontsize(fsize)
# 辅助坐标点
#----------------------------------------------------------------------------
yMinorLocator= FixedLocator(numpy.array(minorticks_2)) # XXX minor ticks 已经在上面一并设置,这里不需要了。
# 确定 Y 轴的 MinorFormatter
def y_minor_formatter(num, pos=None):
return str(round(num/1000.0, 2))
yMinorFormatter= FuncFormatter(y_minor_formatter)
# 设定 X 轴的 Locator 和 Formatter
yaxis.set_minor_locator(yMinorLocator)
yaxis.set_minor_formatter(yMinorFormatter)
# 设定 Y 轴主要坐标点与辅助坐标点的样式
if self._name == 'pricefs':
for mil in axes.get_yticklabels(minor=True):
mil.set_visible(False)
else:
for mil in axes.get_yticklabels(minor=True):
mil.set_fontsize(5)
mil.set_color('blue')
def plot(self):
'''
由派生类自己定义
'''
pass
def plot_candlestick(self):
'''
绘制 K 线
'''
axes= self._Axes
xindex= self._xindex
up= self._up
down= self._down
side= self._side
# 绘制 K 线部分
#==================================================================================================================================================
# 对开收盘价进行视觉修正
for idx, poc in enumerate(self._zipoc):
if poc[0] == poc[1] and None not in poc:
variant= int(round((poc[1]+1000)/2000.0, 0))
self._open[idx]= poc[0] - variant # 稍微偏离一点,使得在图线上不致于完全看不到
self._close[idx]= poc[1] + variant
rarray_open= numpy.array(self._open)
rarray_close= numpy.array(self._close)
rarray_high= numpy.array(self._high)
rarray_low= numpy.array(self._low)
# XXX: 如果 up, down, side 里有一个全部为 False 组成,那么 vlines() 会报错。
# XXX: 可以使用 alpha 参数调节透明度
if True in up:
axes.vlines(xindex[up], rarray_low[up], rarray_high[up], edgecolor='red', linewidth=0.6, label='_nolegend_', alpha=0.5)
axes.vlines(xindex[up], rarray_open[up], rarray_close[up], edgecolor='red', linewidth=3.0, label='_nolegend_', alpha=0.5)
if True in down:
axes.vlines(xindex[down], rarray_low[down], rarray_high[down], edgecolor='green', linewidth=0.6, label='_nolegend_', alpha=0.5)
axes.vlines(xindex[down], rarray_open[down], rarray_close[down], edgecolor='green', linewidth=3.0, label='_nolegend_', alpha=0.5)
if True in side:
axes.vlines(xindex[side], rarray_low[side], rarray_high[side], edgecolor='0.7', linewidth=0.6, label='_nolegend_', alpha=0.5)
axes.vlines(xindex[side], rarray_open[side], rarray_close[side], edgecolor='0.7', linewidth=3.0, label='_nolegend_', alpha=0.5)
def plot_simplified(self):
'''
绘制简化行情
'''
xindex= self._xindex
axes= self._Axes
rarray_simple= numpy.array(self._simple)
axes.plot(xindex, rarray_simple, 'o-', color='white', linewidth=0.3, label='simple', \
markersize=0.3, markeredgecolor='white', markeredgewidth=0.1, alpha=0.3) # 简化行情
def plot_average(self):
'''
绘制均线
'''
# 绘制均线部分
#==================================================================================================================================================
quotes= self._pdata[u'行情']
xindex= self._xindex
axes= self._Axes
if self._name == 'pricefs':
widthw= 0.1
widthn= 0.07
mksize= 0.07
mkwidth= 0.1
alpha= 1.0
else:
widthw= 0.2
widthn= 0.1
mksize= 0.3
mkwidth= 0.1
alpha= 1.0
if u'3日均' in quotes:
rarray_3dayave= numpy.array(self._average3)
axes.plot(xindex, rarray_3dayave, 'o-', color='white', linewidth=widthw, label='avg_3', \
markersize=mksize, markeredgecolor='white', markeredgewidth=mkwidth, alpha=alpha) # 3日均线
if u'5日均' in quotes:
rarray_5dayave= numpy.array(self._average5)
axes.plot(xindex, rarray_5dayave, 'o-', color='white', linewidth=widthn, label='avg_5', \
markersize=mksize, markeredgecolor='white', markeredgewidth=mkwidth, alpha=alpha) # 5日均线
if u'10日均' in quotes:
rarray_10dayave= numpy.array(self._average10)
axes.plot(xindex, rarray_10dayave, 'o-', color='yellow', linewidth=widthn, label='avg_10', \
markersize=mksize, markeredgecolor='yellow', markeredgewidth=mkwidth, alpha=alpha) # 10日均线
if u'30日均' in quotes:
rarray_30dayave= numpy.array(self._average30)
axes.plot(xindex, rarray_30dayave, 'o-', color='cyan', linewidth=widthn, label='avg_30', \
markersize=mksize, markeredgecolor='cyan', markeredgewidth=mkwidth, alpha=alpha) # 30日均线
if u'60日均' in quotes:
rarray_60dayave= numpy.array(self._average60)
axes.plot(xindex, rarray_60dayave, 'o-', color='magenta', linewidth=widthn, label='avg_60', \
markersize=mksize, markeredgecolor='magenta', markeredgewidth=mkwidth, alpha=alpha) # 60日均线
def plot_adjustnotes(self):
'''
绘制复权提示
'''
quotes= self._pdata[u'行情']
firstday= self._dates[0]
lastday= self._dates[-1]
ylowlim= self._ylowlim
yhighlim= self._yhighlim
axes= self._Axes
# 使用 annotate() 进行标注。不用了,留作纪念。
#===========================================================================================================================
# adjdict= dict(quotes[u'相对复权']) # key 是 date string,value 是相对复权因子(float 类型)
# el= Ellipse((2, -1), 0.5, 0.5)
# for idx, dstr in enumerate(self._dates):
# if dstr in adjdict:
# axes.plot([idx, idx], [ylowlim, yhighlim], '-', color='purple', linewidth=0.1)
# axes.annotate(u'复权\n' + str(adjdict[dstr]),
# fontproperties=__font_properties__,
# xy=(idx, yhighlim/1.1), xycoords='data',
# xytext=(10, 5), textcoords='offset points', size=5, verticalalignment="center",
# bbox=dict(boxstyle="round", facecolor='white', edgecolor='purple'),
# arrowprops=dict(arrowstyle="wedge,tail_width=1.",
# facecolor='white', edgecolor='purple',
# patchA=None,
# patchB=el,
# relpos=(0.2, 0.8),
# connectionstyle="arc3,rad=-0.1"),
# alpha=0.5
# )
adjrecs= [rec for rec in quotes[u'相对复权'] if rec[0] >= firstday and rec[0] <= lastday]
if self._name == 'pricefs':
fsize= 3.0
ycoord= yhighlim/1.3
alpha= 1.0
else:
fsize= 5.0
ycoord= yhighlim/1.12
alpha= 1.0
for dstr, afac in adjrecs:
idx= self._dates.index(dstr)
axes.plot([idx, idx], [ylowlim, yhighlim], '-', color='purple', linewidth=0.1)
label= axes.text( \
idx, ycoord, \
u'复权 ' + str(afac) + u'\n' + dstr, \
fontproperties=__font_properties__, \
horizontalalignment='left', \
verticalalignment='top', \
color='purple', \
alpha=alpha
)
label.set_fontsize(fsize)
def plot_capchangenotes(self):
'''
绘制流通股本变更提示
注意两个问题:
1. 流通股本变更提示中的日期可能不是交易日期
2. 流通股本变更提示涵盖个股的所有历史,有些内容可能在绘图目标区间以外
'''
pdata= self._pdata
axes= self._Axes
ylowlim= self._ylowlim
yhighlim= self._yhighlim
firstday= self._dates[0]
lastday= self._dates[-1]
# 把目标区间之外的记录滤掉
changerecs= [rec for rec in pdata[u'公司信息'][u'流通股变更'] if rec[u'变更日期'] >= firstday and rec[u'变更日期'] <= lastday]
# 使用 annotate() 进行标注。不用了,留作纪念。
#===========================================================================================================================
# el= Ellipse((2, -1), 0.5, 0.5)
# for datestr, chrate in changerecs:
# dstr= [ds for ds in self._dates if ds >= datestr][0]
# idx= self._dates.index(dstr)
# axes.plot([idx, idx], [ylowlim, yhighlim], '-', color='yellow', linewidth=0.1)
# axes.annotate(u'流通股\n' + str(chrate),
# fontproperties=__font_properties__,
# xy=(idx, yhighlim/1.1), xycoords='data',
# xytext=(10, 5), textcoords='offset points', size=5, verticalalignment="center",
# bbox=dict(boxstyle="round", facecolor='white', edgecolor='yellow'),
# arrowprops=dict(arrowstyle="wedge,tail_width=1.",
# facecolor='white', edgecolor='yellow',
# patchA=None,
# patchB=el,
# relpos=(0.2, 0.8),
# connectionstyle="arc3,rad=-0.1"),
# alpha=0.5
# )
if self._name == 'pricefs':
fsize= 3.0
ycoord= yhighlim/1.1
alpha= 1.0
else:
fsize= 5.0
ycoord= yhighlim/1.05
alpha= 0.8
for record in changerecs:
datestr= record[u'变更日期']
chrate= record[u'变更比']
dstr= [ds for ds in self._dates if ds >= datestr][0]
idx= self._dates.index(dstr)
axes.plot([idx, idx], [ylowlim, yhighlim], '-', color='yellow', linewidth=0.1)
label= axes.text( \
idx, ycoord, \
u'流通股 ' + str(chrate) + u'\n' + datestr, \
fontproperties=__font_properties__, \
horizontalalignment='left', \
verticalalignment='top', \
color='yellow', \
alpha=alpha
)
label.set_fontsize(fsize)
def plot_candlestick_2(self):
'''
绘制第二条 K 线
'''
xindex= self._xindex
axes= self._Axes_2
up= self._up_2
down= self._down_2
side= self._side_2
# 对开收盘价进行视觉修正
for idx, poc in enumerate( self._zipoc_2 ):
if poc[0] == poc[1] and None not in poc:
self._open_2[idx]= poc[0] - 5 # 稍微偏离一点,使得在图线上不致于完全看不到
self._close_2[idx]= poc[1] + 5
rarray_open= numpy.array(self._open_2)
rarray_close= numpy.array(self._close_2)
rarray_high= numpy.array(self._high_2)
rarray_low= numpy.array(self._low_2)
# XXX: 如果 up, down, side 里有一个全部为 False 组成,那么 vlines() 会报错。
# XXX: 可以使用 alpha 参数调节透明度
if True in up:
axes.vlines(xindex[up], rarray_low[up], rarray_high[up], edgecolor='0.7', linewidth=0.6, label='_nolegend_', alpha=0.5)
axes.vlines(xindex[up], rarray_open[up], rarray_close[up], edgecolor='0.7', linewidth=3.0, label='_nolegend_', alpha=0.5)
if True in down:
axes.vlines(xindex[down], rarray_low[down], rarray_high[down], edgecolor='0.3', linewidth=0.6, label='_nolegend_', alpha=0.5)
axes.vlines(xindex[down], rarray_open[down], rarray_close[down], edgecolor='0.3', linewidth=3.0, label='_nolegend_', alpha=0.5)
if True in side:
axes.vlines(xindex[side], rarray_low[side], rarray_high[side], edgecolor='1.0', linewidth=0.6, label='_nolegend_', alpha=1.0)
axes.vlines(xindex[side], rarray_open[side], rarray_close[side], edgecolor='1.0', linewidth=3.0, label='_nolegend_', alpha=1.0)
def plot_capitalinfo(self):
'''
绘制行情首日和尾日的股本信息
'''
def find_biggestblank(didx):
'''
找出 X 轴某个位置图中最大的空隙
'''
pstart= self._open[0]
ptarget= self._open[didx]
compseq= [yhighlim, ptarget, ylowlim]
if u'开盘二' in quotes:
pstart_2= self._open_2[0]
ptarget_2= self._open_2[didx]
padjust= int(ptarget_2 * pstart / float(pstart_2))
compseq.append(padjust)
compseq.sort(reverse=True) # 图中的三个或四个关键点,高到底排序
diff, hi, low= max([(math.log(compseq[idx]/float(compseq[idx+1]), expbase), compseq[idx], compseq[idx+1]) for idx in range(len(compseq)-1)])
# XXX: for debugging
# print(compseq)
# print([diff, hi, low])
return (hi*low)**0.5 # 相乘再开平方,在 log 坐标系里看起来就是在中间位置。
def repr_int(intnum):
'''
123456789 --> '1,2345,6789'
'''
if type(intnum) not in (int, long): return str(intnum)
if intnum == 0: return '0'
if intnum < 0:
intnum= -intnum
isminus= True
else:
isminus= False
intstr= str(intnum)
intstr= '0'*((4-len(intstr)%4)%4) + intstr
intlist= [intstr[i:i+4] for i in range(0, len(intstr), 4)]
intlist[0]= intlist[0].lstrip('0')
return ('-' + ','.join(intlist)) if isminus else ','.join(intlist)
pdata= self._pdata
quotes= pdata[u'行情']
ylowlim= self._ylowlim
yhighlim= self._yhighlim
length= self._length
expbase= self._expbase
capinfo= pdata[u'公司信息'][u'股本变更记录']
axes= self._Axes
firstday, lastday= self._dates[0], self._dates[-1]
fsize= 5.0 if self._name == 'price' else 3.0
# 首日总股本与流通股信息
#====================================================================================================================================
chunk= [rec for rec in capinfo if rec[u'变更日期'] <= firstday]
if chunk:
allshares= repr_int(chunk[-1][u'总股本'])
circulating= repr_int(chunk[-1][u'流通股'])
else:
allshares= 'None'
circulating= 'None'
infostr= u'总股本: ' + allshares + '\n' + u'流通股: ' + circulating
label= axes.text(0, find_biggestblank(didx=0), infostr, fontproperties=__font_properties__, color='0.7')
label.set_fontsize(fsize)
# label.set_zorder(0) # XXX: 放在底层
# 尾日总股本与流通股信息
#====================================================================================================================================
chunk= [rec for rec in capinfo if rec[u'变更日期'] <= lastday]
if chunk:
allshares= repr_int(chunk[-1][u'总股本'])
circulating= repr_int(chunk[-1][u'流通股'])
else:
allshares= 'None'
circulating= 'None'
infostr= u'总股本: ' + allshares + '\n' + u'流通股: ' + circulating
label= axes.text(length-1, find_biggestblank(didx=length-1), infostr, fontproperties=__font_properties__, horizontalalignment='right', color='0.7')
label.set_fontsize(fsize)
# label.set_zorder(0) # XXX: 放在底层
def plot_usernotes(self):
'''
'''
pdata= self._pdata
quotes= pdata[u'行情']
sidx= self._pdata[u'任务描述'][u'起始偏移']
eidx= self._pdata[u'任务描述'][u'结束偏移']
axes= self._Axes
usernotes= pdata[u'用户标记']
alldates= quotes[u'日期'][sidx:eidx]
lowprices= quotes[u'最低'][sidx:eidx]
expbase= self._expbase
# 绘制短线买点标记
for note in usernotes:
if note[u'类型'] == u'筛选结果':
dstr= note[u'日期']
# 日期不在绘图区间范围内,忽略
if dstr not in alldates:
continue
# 决定箭头的颜色
result= note[u'结果']
color= 'magenta' if result == u'上涨' else 'cyan' if result == u'下跌' else 'white'
# 箭头的起始位置
idx= alldates.index(dstr)
xpos= idx
ypos= lowprices[idx] / expbase
# 箭头的长度
dx= 0.0
dy= ypos * (expbase-1) * 0.9
# 头端的长度
head_length= dy * 0.2
# 绘制箭头
arrow_params={'length_includes_head':True, 'shape':'full', 'head_starts_at_zero':False}
axes.arrow(xpos, ypos, dx, dy, facecolor=color, edgecolor=color, linewidth=0.7, head_width=0.6, head_length=head_length, **arrow_params)
def plot_vlines(self):
xindex= self._xindex
up= self._up
down= self._down
side= self._side
axes= self._Axes
lwidth= 2.4 * self._shrink
# 绘制 K 线部分
#==================================================================================================================================================
rarray_high= numpy.array(self._high)
rarray_low= numpy.array(self._low)
# XXX: 如果 up, down, side 里有一个全部为 False 组成,那么 vlines() 会报错。
# XXX: 可以使用 alpha 参数调节透明度
if True in up:
axes.vlines(xindex[up], rarray_low[up], rarray_high[up], edgecolor='red', linewidth=lwidth, label='_nolegend_', alpha=0.5)
if True in down:
axes.vlines(xindex[down], rarray_low[down], rarray_high[down], edgecolor='green', linewidth=lwidth, label='_nolegend_', alpha=0.5)
if True in side:
axes.vlines(xindex[side], rarray_low[side], rarray_high[side], edgecolor='0.7', linewidth=lwidth, label='_nolegend_', alpha=0.5)
def plot_vlines_2(self):
xindex= self._xindex
axes= self._Axes_2
up= self._up_2
down= self._down_2
side= self._side_2
lwidth= 2.4 * self._shrink
rarray_high= numpy.array(self._high_2)
rarray_low= numpy.array(self._low_2)
# XXX: 如果 up, down, side 里有一个全部为 False 组成,那么 vlines() 会报错。
# XXX: 可以使用 alpha 参数调节透明度
if True in up:
axes.vlines(xindex[up], rarray_low[up], rarray_high[up], edgecolor='0.7', linewidth=lwidth, label='_nolegend_', alpha=0.5)
if True in down:
axes.vlines(xindex[down], rarray_low[down], rarray_high[down], edgecolor='0.3', linewidth=lwidth, label='_nolegend_', alpha=0.5)
if True in side:
axes.vlines(xindex[side], rarray_low[side], rarray_high[side], edgecolor='1.0', linewidth=lwidth, label='_nolegend_', alpha=1.0)
def plot_datenotes(self):
'''
内部的日期注释,由派生类定义
'''
pass
def plot_pricenotes(self):
'''
内部的价格注释,由派生类定义
'''
pass
class SubPlot_PriceFullSpan(SubPlot_PriceBase):
'''
'''
def plot(self):
'''
绘图
'''
pdata= self._pdata
# if u'简化' in pdata:
# self.plot_simplified()
# else:
# self.plot_candlestick()
self.plot_vlines()
self.plot_average()
if u'相对复权' in pdata[u'行情']:
self.plot_adjustnotes()
if u'流通股变更' in pdata[u'公司信息']:
self.plot_capchangenotes()
if u'股本变更记录' in pdata[u'公司信息']:
self.plot_capitalinfo()
self.set_xticks()
self.set_yticks()
if u'开盘二' in pdata[u'行情']:
self.plot_vlines_2()
self.set_xticks_2()
self.set_yticks_2()
self.plot_datenotes()
if 'price' in self._parent._subplots:
self.plot_windowspan()
def plot_datenotes(self):
'''
日期在图中间的显示
'''
ylowlim= self._ylowlim
axes= self._Axes
sdindex= self._xparams['sdindex']
mdindex= self._xparams['mdindex']
# 每季度第一个交易日
for ix in sdindex:
newlab= axes.text(ix - (1/self._shrink), ylowlim*1.03, self._dates[ix])
newlab.set_font_properties(__font_properties__)
newlab.set_color('0.3')
newlab.set_fontsize(4)
newlab.set_rotation('45')
# newlab.set_rotation('vertical')
# newlab.set_horizontalalignment('left')
# newlab.set_verticalalignment('bottom')
# newlab.set_verticalalignment('center')
newlab.set_zorder(0) # XXX: 放在底层
# 每月第一个交易日
for ix in mdindex:
newlab= axes.text(ix - (0.8/self._shrink), ylowlim * 1.03, self._dates[ix])
newlab.set_font_properties(__font_properties__)
newlab.set_color('0.3')
newlab.set_fontsize(3)
newlab.set_rotation('45')
# newlab.set_rotation('vertical')
# newlab.set_horizontalalignment('left')
# newlab.set_verticalalignment('top') # 不行
# newlab.set_verticalalignment('center')
# newlab.set_verticalalignment('bottom')
newlab.set_zorder(0) # XXX: 放在底层
def plot_windowspan(self):
axes= self._Axes
jobstat= self._pdata[u'任务描述']
sindex, eindex= jobstat[u'起始偏移'], jobstat[u'结束偏移']
hibdry, lobdry= self._parent._subplots['price'].get_ylimits()
xcoord= sindex - 1
width= eindex - sindex + 1
ycoord= lobdry
height= hibdry - lobdry
window= matplotlib.patches.Rectangle((xcoord, ycoord), width, height, fill=False, edgecolor=__color_lightblue__, linewidth=0.3, alpha=0.7)
window.set_zorder(-1) # 放在底层
axes.add_patch(window)
class SubPlot_Price(SubPlot_PriceBase):
'''
'''
def plot(self):
'''
绘图
'''
pdata= self._pdata
# if u'简化' in pdata:
# self.plot_simplified()
# else:
# self.plot_candlestick()
self.plot_candlestick()
self.plot_average()
if u'相对复权' in pdata[u'行情']:
self.plot_adjustnotes()
if u'流通股变更' in pdata[u'公司信息']:
self.plot_capchangenotes()
if u'股本变更记录' in pdata[u'公司信息']:
self.plot_capitalinfo()
if u'用户标记' in pdata:
self.plot_usernotes()
self.set_xticks()
self.set_yticks()
if u'开盘二' in pdata[u'行情']:
self.plot_candlestick_2()
self.set_xticks_2()
self.set_yticks_2()
self.plot_pricenotes()
self.plot_datenotes()
def plot_datenotes(self):
'''
日期在图中间的显示
'''
ylowlim= self._ylowlim
yhighlim= self._yhighlim
axes= self._Axes
mdindex= self._xparams['mdindex']
wdindex= self._xparams['wdindex']
# 每月第一个交易日
for iy in [ylowlim*1.1, yhighlim/1.21]:
for ix in mdindex:
newlab= axes.text(ix-1, iy, self._dates[ix])
newlab.set_font_properties(__font_properties__)
newlab.set_color('0.3')
newlab.set_fontsize(4)
newlab.set_rotation('vertical')
# newlab.set_horizontalalignment('left')
# newlab.set_verticalalignment('bottom')
# newlab.set_verticalalignment('center')
newlab.set_zorder(0) # XXX: 放在底层
# 每周第一个交易日,根据这个可以推算出全部确切的日期。
# for iy in minorticks[0:-1:6]:
for iy in [ylowlim*1.01, yhighlim/1.09]:
for ix in wdindex:
newlab= axes.text(ix-0.8, iy, self._dates[ix])
newlab.set_font_properties(__font_properties__)
newlab.set_color('0.3')
newlab.set_fontsize(3)
newlab.set_rotation('vertical')
# newlab.set_horizontalalignment('left')
# newlab.set_verticalalignment('top') # 不行
# newlab.set_verticalalignment('center')
# newlab.set_verticalalignment('bottom')
newlab.set_zorder(0) # XXX: 放在底层
def plot_pricenotes(self):
# 价格数值在图中间的显示
#==================================================================================================================================================
quotes= self._pdata[u'行情']
axes= self._Axes
majorticks= self._ytickset['major']
minorticks= self._ytickset['minor']
mdindex= self._xparams['mdindex']
def price_note(num):
return str(round(num/1000.0, 2))
if u'开盘二' in quotes:
majorticks_2= self._ytickset['major_2']
minorticks_2= self._ytickset['minor_2']
for iy, iy2 in zip(sorted(majorticks[:-1] + minorticks[1:-1]), sorted(majorticks_2[:-1] + minorticks_2[1:-1])):
for ix in mdindex[1:-1:3]:
newlab= axes.text(ix+6, iy*1.001, price_note(iy) + ' / ' + price_note(iy2))
newlab.set_font_properties(__font_properties__)
newlab.set_color('0.3')
newlab.set_fontsize(3)
newlab.set_zorder(0) # XXX: 放在底层
else:
for iy in sorted(majorticks[:-1] + minorticks[1:-1]):
for ix in mdindex[1:-1:3]:
newlab= axes.text(ix+9, iy*1.001, price_note(iy))
newlab.set_font_properties(__font_properties__)
newlab.set_color('0.3')
newlab.set_fontsize(3)
newlab.set_zorder(0) # XXX: 放在底层
class SubPlot_TORateBase:
'''
换手率子图
'''
def __init__(self, pdata, parent, xparams, name):
self._name= name
self._pdata= pdata
self._parent= parent
self._xparams= xparams
self._shrink= __shrink__ if name == 'toratefs' else 1.0
self._tostep= 0 # 每一格代表的换手率数值
self._yrange= 0
self._xsize= 0 # int
self._ysize= 0 # int
self._Axes= None
self._AxisX= None
self._AxisY= None
if u'换手率二' in pdata[u'行情']:
self._Axes_2= None
self._AxisX_2= None
self._AxisY_2= None
self._tostep_2= 0
# 绘图数据
quotes= pdata[u'行情']
if name == 'toratefs':
self._dates= quotes[u'日期']
self._open= quotes[u'开盘']
self._close= quotes[u'收盘']
self._high= quotes[u'最高']
self._low= quotes[u'最低']
if u'简化' in quotes: self._simple= quotes[u'简化']
if u'换手率' in quotes: self._torate= quotes[u'换手率']
if u'成交量' in quotes: self._volume= quotes[u'成交量']
if u'成交额' in quotes: self._turnover= quotes[u'成交额']
if u'开盘二' in quotes:
self._open_2= quotes[u'开盘二']
self._close_2= quotes[u'收盘二']
self._high_2= quotes[u'最高二']
self._low_2= quotes[u'最低二']
if u'简化二' in quotes: self._simple_2= quotes[u'简化二']
if u'换手率二' in quotes: self._torate_2= quotes[u'换手率二']
if u'成交量二' in quotes: self._volume_2= quotes[u'成交量二']
if u'成交额二' in quotes: self._turnover_2= quotes[u'成交额二']
else:
sidx, eidx= pdata[u'任务描述'][u'起始偏移'], pdata[u'任务描述'][u'结束偏移']
self._dates= quotes[u'日期'][sidx:eidx]
self._open= quotes[u'开盘'][sidx:eidx]
self._close= quotes[u'收盘'][sidx:eidx]
self._high= quotes[u'最高'][sidx:eidx]
self._low= quotes[u'最低'][sidx:eidx]
if u'简化' in quotes: self._simple= quotes[u'简化'][sidx:eidx]
if u'换手率' in quotes: self._torate= quotes[u'换手率'][sidx:eidx]
if u'成交量' in quotes: self._volume= quotes[u'成交量'][sidx:eidx]
if u'成交额' in quotes: self._turnover= quotes[u'成交额'][sidx:eidx]
if u'开盘二' in quotes:
self._open_2= quotes[u'开盘二'][sidx:eidx]
self._close_2= quotes[u'收盘二'][sidx:eidx]
self._high_2= quotes[u'最高二'][sidx:eidx]
self._low_2= quotes[u'最低二'][sidx:eidx]
if u'简化二' in quotes: self._simple_2= quotes[u'简化二'][sidx:eidx]
if u'换手率二' in quotes: self._torate_2= quotes[u'换手率二'][sidx:eidx]
if u'成交量二' in quotes: self._volume_2= quotes[u'成交量二'][sidx:eidx]
if u'成交额二' in quotes: self._turnover_2= quotes[u'成交额二'][sidx:eidx]
# 衍生数据
#==============================================================================================================
self._length= len(self._dates)
self._xindex= numpy.arange(self._length) # X 轴上的 index,一个辅助数据
self._zipoc= zip(self._open, self._close)
self._up= numpy.array( [ True if po < pc and po is not None else False for po, pc in self._zipoc] ) # 标示出该天股价日内上涨的一个序列
self._down= numpy.array( [ True if po > pc and po is not None else False for po, pc in self._zipoc] ) # 标示出该天股价日内下跌的一个序列
self._side= numpy.array( [ True if po == pc and po is not None else False for po, pc in self._zipoc] ) # 标示出该天股价日内走平的一个序列
if u'开盘二' in quotes:
self._zipoc_2= zip(self._open_2, self._close_2)
self._up_2= numpy.array( [ True if po < pc and po is not None else False for po, pc in self._zipoc_2] ) # 标示出该天股价日内上涨的一个序列
self._down_2= numpy.array( [ True if po > pc and po is not None else False for po, pc in self._zipoc_2] ) # 标示出该天股价日内下跌的一个序列
self._side_2= numpy.array( [ True if po == pc and po is not None else False for po, pc in self._zipoc_2] ) # 标示出该天股价日内走平的一个序列
self._compute_size()
def _compute_size(self):
'''
根据 pdata 计算自身尺寸
'''
def _compute_step(maxto):
'''
maxto 是 换手率 最大值。返回每格单位(最小 500, 代表 0.5%)以及格数
'''
for i in range(9):
if maxto > (4 * 500 * (2**i)): # 换手率最大是 100000, 代表 100%
continue
else:
tostep= 500 * (2**i)
tosize= int(round((maxto + tostep/2.0 - 1) / float(tostep), 0))
break
return (tostep, tosize)
quotes= self._pdata[u'行情']
xmargin= self._xparams['xmargin']
self._xsize= (self._length + xmargin*2) * self._shrink
maxto= max(self._torate)
self._tostep, self._yrange= _compute_step(maxto=maxto)
if u'换手率二' in quotes:
maxto_2= max(self._torate_2)
self._tostep_2, yrange_2= _compute_step(maxto=maxto_2)
self._yrange= max(self._yrange, yrange_2) # 成交量部分在 Y 轴所占的 “份数”
self._ysize= self._yrange * self._shrink
def get_size(self):
return (self._xsize, self._ysize)
def build_axes(self, figobj, rect):
# 第一只:添加 Axes 对象
#==================================================================================================================================================
axes= figobj.add_axes(rect, axis_bgcolor='black')
axes.set_axis_bgcolor('black')
axes.set_axisbelow(True) # 网格线放在底层
# 第一只:改变坐标线的颜色
#==================================================================================================================================================
for child in axes.get_children():
if isinstance(child, matplotlib.spines.Spine):
child.set_color(__color_gold__)
# child.set_zorder(3) # XXX: 放在上层,好像没什么用。
# 得到 X 轴 和 Y 轴 的两个 Axis 对象
#==================================================================================================================================================
xaxis= axes.get_xaxis()
yaxis= axes.get_yaxis()
# 设置两个坐标轴上的 grid
#==================================================================================================================================================
xaxis.grid(True, 'major', color='0.3', linestyle='solid', linewidth=0.2)
xaxis.grid(True, 'minor', color='0.3', linestyle='dotted', linewidth=0.1)
yaxis.grid(True, 'major', color='0.3', linestyle='solid', linewidth=0.2)
yaxis.grid(True, 'minor', color='0.3', linestyle='solid', linewidth=0.1)
self._Axes= axes
self._AxisX= xaxis
self._AxisY= yaxis
if u'换手率二' in self._pdata[u'行情']:
# 添加 Axes 对象
#==================================================================================================================================================
axes_2= axes.twinx()
# XXX: 下面这三行把第一个 axes 放在上面,这样不会被第二个 axes 的图形遮盖。用 zorder 不顶用。
axes.figure.axes[-2:]= [axes_2, axes] # XXX: 把第一个 axes 放在上面,用 zorder 不顶用。
axes.set_frame_on(False) # 如果不做此设定,axes_2 的内容会看不见
axes_2.set_frame_on(True)
axes_2.set_axis_bgcolor('black')
axes_2.set_axisbelow(True) # 网格线放在底层
# 改变坐标线的颜色
#==================================================================================================================================================
for child in axes_2.get_children():
if isinstance(child, matplotlib.spines.Spine):
child.set_color(__color_gold__)
# 得到 X 轴 和 Y 轴 的两个 Axis 对象
#==================================================================================================================================================
xaxis_2= axes_2.get_xaxis()
yaxis_2= axes_2.get_yaxis()
# 设置网格线
#==================================================================================================================================================
# xaxis_2.grid(True, 'major', color='0.3', linestyle='solid', linewidth=0.2)
# xaxis_2.grid(True, 'minor', color='0.3', linestyle='dotted', linewidth=0.1)
# yaxis_2.grid(True, 'major', color='0.3', linestyle='solid', linewidth=0.2)
# yaxis_2.grid(True, 'minor', color='0.3', linestyle='dotted', linewidth=0.1)
self._Axes_2= axes_2
self._AxisX_2= xaxis_2
self._AxisY_2= yaxis_2
def get_axes(self):
return self._Axes
def plot(self):
'''
绘制换手率图形
'''
self.plot_torate()
self.set_xticks()
self.set_yticks()
if u'换手率二' in self._pdata[u'行情']:
self.plot_torate_2()
self.set_xticks_2()
self.set_yticks_2()
def plot_torate(self):
'''
绘制换手率
'''
xindex= self._xindex
stopset= self._xparams['mdindex'] if self._name == 'torate' else self._xparams['sdindex']
axes= self._Axes
up= self._up
down= self._down
side= self._side
rarray_to= numpy.array(self._torate)
tozeros= numpy.zeros(self._length) # 辅助数据
lwidth= 3.0 if self._name == 'torate' else 2.4 * self._shrink
# XXX: 如果 up/down/side 各项全部为 False,那么 vlines() 会报错。
if True in up:
axes.vlines(xindex[up], tozeros[up], rarray_to[up], edgecolor='red', linewidth=lwidth, label='_nolegend_', alpha=0.5)
if True in down:
axes.vlines(xindex[down], tozeros[down], rarray_to[down], edgecolor='green', linewidth=lwidth, label='_nolegend_', alpha=0.5)
if True in side:
axes.vlines(xindex[side], tozeros[side], rarray_to[side], edgecolor='0.7', linewidth=lwidth, label='_nolegend_', alpha=0.5)
# 绘制平均换手率(直线)
toeffect= [num for num in self._torate if num is not None]
toaverage= sum(toeffect) / float(len(toeffect))
axes.plot([-1, self._length], [toaverage, toaverage], '-', color='yellow', linewidth=0.2, alpha=0.7)
# 换手率数值在图中间的显示
#==================================================================================================================================================
for ix in stopset[2:-1:3]:
newlab= axes.text(ix+8, toaverage, str(round(toaverage/1000.0, 2)) + '%')
newlab.set_font_properties(__font_properties__)
newlab.set_color('yellow')
newlab.set_fontsize(3)
# newlab.set_zorder(0) # XXX: 放在底层
# newlab.set_verticalalignment('center')
def plot_torate_2(self):
'''
绘制第二条换手率柱状图
'''
quotes= self._pdata[u'行情']
xindex= self._xindex
axes= self._Axes_2
up= self._up_2
down= self._down_2
side= self._side_2
rarray_to= numpy.array(self._torate_2)
tozeros= numpy.zeros(self._length) # 辅助数据
lwidth, alpha= (0.7, 0.5) if self._name == 'torate' else (0.3, 0.7)
# XXX: 如果 up/down/side 各项全部为 False,那么 vlines() 会报错。
if True in up:
axes.vlines(xindex[up], tozeros[up], rarray_to[up], edgecolor='0.7', linewidth=lwidth, label='_nolegend_', alpha=alpha)
if True in down:
axes.vlines(xindex[down], tozeros[down], rarray_to[down], edgecolor='0.3', linewidth=lwidth, label='_nolegend_', alpha=alpha)
if True in side:
axes.vlines(xindex[side], tozeros[side], rarray_to[side], edgecolor='0.7', linewidth=lwidth, label='_nolegend_', alpha=1.0)
def set_xticks(self):
'''
X 轴坐标
'''
length= self._length
xmargin= self._xparams['xmargin']
axes= self._Axes
xaxis= self._AxisX
# xaxis.set_tick_params(which='both', direction='out') # XXX: 坐标点设到外面去,也可以用 Axes.tick_params(),好像 matplotlib 1.0.1 才有
# 设定 X 轴坐标的范围
#==================================================================================================================================================
axes.set_xlim(-xmargin, length + xmargin)
xMajorLocator= self._xparams['xMajorLocator']
xMinorLocator= self._xparams['xMinorLocator']
xMajorFormatter= self._xparams['xMajorFormatter']
xMinorFormatter= self._xparams['xMinorFormatter']
# 设定 X 轴的 Locator 和 Formatter
xaxis.set_major_locator(xMajorLocator)
xaxis.set_minor_locator(xMinorLocator)
if self._name == 'torate':
xaxis.set_major_formatter(xMajorFormatter)
xaxis.set_minor_formatter(xMinorFormatter)
# 设定 X 轴主要坐标点与辅助坐标点的样式
for mal in axes.get_xticklabels(minor=False):
mal.set_fontsize(4)
mal.set_horizontalalignment('right')
mal.set_rotation('45')
for mil in axes.get_xticklabels(minor=True):
mil.set_fontsize(4)
mil.set_color('blue')
mil.set_horizontalalignment('right')
mil.set_rotation('45')
else:
# 设为不可见
for mal in axes.get_xticklabels(minor=False):
mal.set_visible(False)
for mil in axes.get_xticklabels(minor=True):
mil.set_visible(False)
def set_xticks_2(self):
length= self._length
xmargin= self._xparams['xmargin']
axes= self._Axes_2
xaxis= self._AxisX_2
# xaxis.set_tick_params(which='both', direction='out') # XXX: 坐标点设到外面去,也可以用 Axes.tick_params(),好像 matplotlib 1.0.1 才有
# 设定 X 轴坐标的范围
#==================================================================================================================================================
axes.set_xlim(-xmargin, length + xmargin)
xMajorLocator= self._xparams['xMajorLocator']
xMinorLocator= self._xparams['xMinorLocator']
# 设定 X 轴的 Locator 和 Formatter
xaxis.set_major_locator(xMajorLocator)
xaxis.set_minor_locator(xMinorLocator)
# 设为不可见
for mal in axes.get_xticklabels(minor=False):
mal.set_visible(False)
for mil in axes.get_xticklabels(minor=True):
mil.set_visible(False)
def set_yticks(self):
'''
设置 Y 轴坐标
'''
axes= self._Axes
yaxis= self._AxisY
tostep= self._tostep
yrange= self._yrange
stopset= self._xparams['mdindex'] if self._name == 'torate' else self._xparams['sdindex']
# 设定换手率 Y 轴坐标的范围
#==================================================================================================================================================
axes.set_ylim(0, tostep*yrange)
# 主要坐标点
#==================================================================================================================================================
majorticks= [tostep*i for i in range(yrange)]
yMajorLocator= FixedLocator(numpy.array(majorticks))
# 确定 Y 轴的 MajorFormatter
def y_major_formatter(num, pos=None):
return str(round(num/1000.0, 2)) + '%'
yMajorFormatter= FuncFormatter(y_major_formatter)
# 确定 Y 轴的 MinorFormatter
yMinorFormatter= NullFormatter()
# 第一只:设定 X 轴的 Locator 和 Formatter
yaxis.set_major_locator(yMajorLocator)
yaxis.set_major_formatter(yMajorFormatter)
# 设定 Y 轴主要坐标点的样式
for mal in axes.get_yticklabels(minor=False):
mal.set_font_properties(__font_properties__)
mal.set_fontsize(5) # 这个必须放在前一句后面,否则作用会被覆盖
# 辅助坐标点
#==================================================================================================================================================
if self._name == 'torate':
minorticks= list( itertools.chain.from_iterable( mi for mi in [[ma + (tostep/4.0)*i for i in range(1, 4)] for ma in majorticks] ) )
yMinorLocator= FixedLocator(numpy.array(minorticks))
yaxis.set_minor_locator(yMinorLocator)
def y_minor_formatter(num, pos=None):
return str(round(num/1000.0, 3)) + '%'
yMinorFormatter= FuncFormatter(y_minor_formatter)
yaxis.set_minor_formatter(yMinorFormatter)
# 设定 Y 轴主要坐标点的样式
for mil in axes.get_yticklabels(minor=True):
mil.set_font_properties(__font_properties__)
mil.set_fontsize(4) # 这个必须放在前一句后面,否则作用会被覆盖
else:
# minorticks= list( itertools.chain.from_iterable( mi for mi in [[ma + (tostep/4.0)*i for i in range(1, 4)] for ma in majorticks] ) )
minorticks= list( [ma + (tostep/2.0) for ma in majorticks] )
yMinorLocator= FixedLocator(numpy.array(minorticks))
yaxis.set_minor_locator(yMinorLocator)
# 设定 Y 轴主要坐标点的样式
for mil in axes.get_yticklabels(minor=True):
mil.set_visible(False)
# 换手率数值在图中间的显示
#==================================================================================================================================================
for iy in range(int(tostep/2.0), tostep*yrange, int(tostep/2.0)):
for ix in stopset[1:-1:3]:
newlab= axes.text(ix+8, iy, y_major_formatter(iy))
newlab.set_font_properties(__font_properties__)
newlab.set_color('0.3')
newlab.set_fontsize(3)
newlab.set_zorder(0) # XXX: 放在底层
# newlab.set_verticalalignment('center')
def set_yticks_2(self):
'''
设置 Y 轴坐标
'''
axes= self._Axes_2
yaxis= self._AxisY_2
tostep= self._tostep_2
yrange= self._yrange # 与 1 是一样的
# 设定换手率 Y 轴坐标的范围
#==================================================================================================================================================
axes.set_ylim(0, tostep*yrange)
# 主要坐标点
#==================================================================================================================================================
majorticks= [tostep*i for i in range(yrange)]
yMajorLocator= FixedLocator(numpy.array(majorticks))
# 确定 Y 轴的 MajorFormatter
def y_major_formatter(num, pos=None):
return str(round(num/1000.0, 2)) + '%'
yMajorFormatter= FuncFormatter(y_major_formatter)
# 确定 Y 轴的 MinorFormatter
yMinorFormatter= NullFormatter()
# 第一只:设定 X 轴的 Locator 和 Formatter
yaxis.set_major_locator(yMajorLocator)
yaxis.set_major_formatter(yMajorFormatter)
# 设定 Y 轴主要坐标点的样式
for mal in axes.get_yticklabels(minor=False):
mal.set_font_properties(__font_properties__)
mal.set_fontsize(5) # 这个必须放在前一句后面,否则作用会被覆盖
# 辅助坐标点
#==================================================================================================================================================
if self._name == 'torate':
minorticks= list( itertools.chain.from_iterable( mi for mi in [[ma + (tostep/4.0)*i for i in range(1, 4)] for ma in majorticks] ) )
yMinorLocator= FixedLocator(numpy.array(minorticks))
def y_minor_formatter(num, pos=None):
return str(round(num/1000.0, 3)) + '%'
yMinorFormatter= FuncFormatter(y_minor_formatter)
yaxis.set_minor_locator(yMinorLocator)
yaxis.set_minor_formatter(yMinorFormatter)
# 设定 Y 轴主要坐标点的样式
for mil in axes.get_yticklabels(minor=True):
mil.set_font_properties(__font_properties__)
mil.set_fontsize(4) # 这个必须放在前一句后面,否则作用会被覆盖
else:
minorticks= list( [ma + (tostep/2.0) for ma in majorticks] )
yMinorLocator= FixedLocator(numpy.array(minorticks))
yaxis.set_minor_locator(yMinorLocator)
# 设定 Y 轴主要坐标点的样式
for mil in axes.get_yticklabels(minor=True):
mil.set_visible(False)
class SubPlot_TORate(SubPlot_TORateBase):
pass
class SubPlot_TORateFullSpan(SubPlot_TORateBase):
pass
class MyFigure:
'''
'''
def __init__(self, pdata):
self._pdata= pdata # 绘图数据
self._figfacecolor= __color_pink__
self._figedgecolor= __color_navy__
self._figdpi= 300
self._figlinewidth= 1.0
self._xfactor= 10.0 / 230.0 # x size * x factor = x length
self._yfactor= 0.3 # y size * y factor = y length
jobstat= pdata[u'任务描述']
self._xsize_left= 12.0 # left blank
self._xsize_right= 12.0 # right blank
self._ysize_top= 0.3 # top blank
self._ysize_bottom= 1.2 # bottom blank
self._ysize_gap1= 0.2
self._ysize_gap2= 0.3 if (jobstat[u'历史价格子图'] or jobstat[u'历史换手率子图'] or jobstat[u'财务指标子图']) else 0.0
# 建立 X 轴参数
#===============================================================================================================
if jobstat[u'价格子图'] or jobstat[u'换手率子图']:
xparams= {'xmargin': 1}
xparams.update(self._compute_xparams()) # 与 X 轴坐标点相关的数据结构
if jobstat[u'历史价格子图'] or jobstat[u'历史换手率子图'] or jobstat[u'财务指标子图']:
xparams_fs= {'xmargin': 3}
xparams_fs.update(self._compute_xparams_fullspan())
# 建立子图对象
#===============================================================================================================
self._subplots= {}
if jobstat[u'公司信息子图']:
name= 'basic'
self._subplots[name]= SubPlot_BasicInfo(pdata=pdata, parent=self, name=name)
if jobstat[u'历史价格子图']: # XXX: 这个要放在 价格子图 前面,因为后者可能会用到它的 Y 轴坐标点位置
name= 'pricefs'
self._subplots[name]= SubPlot_PriceFullSpan(pdata=pdata, parent=self, xparams=xparams_fs, name=name)
if jobstat[u'价格子图']:
name= 'price'
self._subplots[name]= SubPlot_Price(pdata=pdata, parent=self, xparams=xparams, name=name)
if jobstat[u'财务指标子图']:
name= 'financial'
self._subplots[name]= SubPlot_Financial(pdata=pdata, parent=self, xparams=xparams_fs, name=name)
if jobstat[u'换手率子图']:
name= 'torate'
self._subplots[name]= SubPlot_TORate(pdata=pdata, parent=self, xparams=xparams, name=name)
if jobstat[u'历史换手率子图']:
name= 'toratefs'
self._subplots[name]= SubPlot_TORateFullSpan(pdata=pdata, parent=self, xparams=xparams_fs, name=name)
# 根据子图对象的尺寸计算自身的尺寸
#===============================================================================================================
self._xsize, \
self._ysize= self._compute_size()
self._xlength= self._xsize * self._xfactor
self._ylength= self._ysize * self._yfactor
# 根据计算出的尺寸建立 Figure 对象
#===============================================================================================================
self._Fig= pyplot.figure(figsize=(self._xlength, self._ylength), dpi=self._figdpi, facecolor=self._figfacecolor, \
edgecolor=self._figedgecolor, linewidth=self._figlinewidth) # Figure 对象
# 用新建立的 Figure 对象交给子图对象,完成子图对象的初始化
#===============================================================================================================
rects= self._compute_rect()
if 'basic' in self._subplots:
self._subplots['basic'].build_axes(figobj=self._Fig, rect=rects['basic'])
# XXX: 这个要放在 price 前面,因为后者要用到它的 Axes 对象
if 'torate' in self._subplots:
self._subplots['torate'].build_axes(figobj=self._Fig, rect=rects['torate'])
if 'price' in self._subplots:
self._subplots['price'].build_axes(figobj=self._Fig, rect=rects['price'])
# XXX: 这个要放在 pricefs 前面
if 'toratefs' in self._subplots:
self._subplots['toratefs'].build_axes(figobj=self._Fig, rect=rects['toratefs'])
if 'pricefs' in self._subplots:
self._subplots['pricefs'].build_axes(figobj=self._Fig, rect=rects['pricefs'])
def _compute_size(self):
'''
根据子图的尺寸计算自身尺寸
'''
pdata= self._pdata
jobstat= pdata[u'任务描述']
x_left, x_right= self._xsize_left, self._xsize_right
y_top, y_bottom= self._ysize_top, self._ysize_bottom
y_gap1= self._ysize_gap1
y_gap2= self._ysize_gap2
x_basic, y_basic= self._subplots['basic'].get_size() if 'basic' in self._subplots else (0.0, 0.0)
x_price, y_price= self._subplots['price'].get_size() if 'price' in self._subplots else (0.0, 0.0)
x_pricefs, y_pricefs= self._subplots['pricefs'].get_size() if 'pricefs' in self._subplots else (0.0, 0.0)
x_torate, y_torate= self._subplots['torate'].get_size() if 'torate' in self._subplots else (0.0, 0.0)
x_toratefs, y_toratefs= self._subplots['toratefs'].get_size() if 'toratefs' in self._subplots else (0.0, 0.0)
x_financial, y_financial= self._subplots['financial'].get_size() if 'financial' in self._subplots else (0.0, 0.0)
x_all= x_left + max(x_price, x_basic, x_pricefs) + x_right
y_all= y_top + y_basic + y_gap1 + y_pricefs + y_toratefs + y_financial + y_gap2 + y_price + y_torate + y_bottom
return (x_all, y_all)
def get_sizeset(self):
sizeset= {
'x': self._xsize,
'y': self._ysize,
'top': self._ysize_top,
'bottom': self._ysize_bottom,
'left': self._xsize_left,
'right': self._xsize_right
}
return sizeset
def _compute_rect(self):
'''
'''
pdata= self._pdata
jobstat= pdata[u'任务描述']
x_left= self._xsize_left
x_right= self._xsize_right
y_top= self._ysize_top
y_bottom= self._ysize_bottom
x_all= self._xsize
y_all= self._ysize
y_gap1= self._ysize_gap1 # basic 与 financial 之间的空隙
y_gap2= self._ysize_gap2 # toratefs 与 price 之间的空隙
x_basic, y_basic= self._subplots['basic'].get_size() if 'basic' in self._subplots else (0.0, 0.0)
x_price, y_price= self._subplots['price'].get_size() if 'price' in self._subplots else (0.0, 0.0)
x_pricefs, y_pricefs= self._subplots['pricefs'].get_size() if 'pricefs' in self._subplots else (0.0, 0.0)
x_torate, y_torate= self._subplots['torate'].get_size() if 'torate' in self._subplots else (0.0, 0.0)
x_toratefs, y_toratefs= self._subplots['toratefs'].get_size() if 'toratefs' in self._subplots else (0.0, 0.0)
x_financial, y_financial= self._subplots['financial'].get_size() if 'financial' in self._subplots else (0.0, 0.0)
rects= {}
if 'basic' in self._subplots:
rect= ((x_left + (x_all-x_left-x_right-x_basic)/2) / x_all, (y_all - y_top - y_basic)/y_all, x_basic/x_all, y_basic/y_all) # K线图部分
rects['basic']= rect
if 'price' in self._subplots:
rect= ((x_left + (x_all-x_left-x_right-x_price)/2) / x_all, (y_bottom + y_torate)/y_all, x_price/x_all, y_price/y_all) # K线图部分
rects['price']= rect
if 'torate' in self._subplots:
rect= ((x_left + (x_all-x_left-x_right-x_torate)/2)/x_all, y_bottom/y_all, x_torate/x_all, y_torate/y_all) # 成交量部分
rects['torate']= rect
if 'pricefs' in self._subplots:
rect= ((x_left + (x_all-x_left-x_right-x_pricefs)/2)/x_all, (y_all - y_top - y_basic - y_gap1 - y_pricefs)/y_all, x_pricefs/x_all, y_pricefs/y_all)
rects['pricefs']= rect
if 'toratefs' in self._subplots:
rect= ((x_left + (x_all-x_left-x_right-x_toratefs)/2)/x_all, (y_bottom + y_torate + y_price + y_gap2)/y_all, x_toratefs/x_all, y_toratefs/y_all)
rects['toratefs']= rect
return rects
def _compute_xparams(self):
'''
主要坐标点是每月第一个交易日,辅助坐标点是每周第一个交易日
'''
quotes= self._pdata[u'行情']
sidx= self._pdata[u'任务描述'][u'起始偏移']
eidx= self._pdata[u'任务描述'][u'结束偏移']
# 设定 X 轴上的坐标
#==================================================================================================================================================
datelist= [ datetime.date(int(ys), int(ms), int(ds)) for ys, ms, ds in [ dstr.split('-') for dstr in quotes[u'日期'][sidx:eidx] ] ]
# 确定 X 轴的 MajorLocator
mdindex= [] # 每个月第一个交易日在所有日期列表中的 index
allyears= set([d.year for d in datelist]) # 所有的交易年份
for yr in sorted(allyears):
allmonths= set([d.month for d in datelist if d.year == yr]) # 当年所有的交易月份
for mon in sorted(allmonths):
monthday= min([dt for dt in datelist if dt.year==yr and dt.month==mon]) # 当月的第一个交易日
mdindex.append(datelist.index(monthday))
xMajorLocator= FixedLocator(numpy.array(mdindex))
# 确定 X 轴的 MinorLocator
wdindex= {} # value: 每周第一个交易日在所有日期列表中的 index; key: 当周的序号 week number(当周是第几周)
for d in datelist:
isoyear, weekno= d.isocalendar()[0:2]
dmark= isoyear*100 + weekno
if dmark not in wdindex:
wdindex[dmark]= datelist.index(d)
wdindex= sorted(wdindex.values())
xMinorLocator= FixedLocator(numpy.array(wdindex))
# 确定 X 轴的 MajorFormatter 和 MinorFormatter
def x_major_formatter(idx, pos=None):
return datelist[idx].strftime('%Y-%m-%d')
def x_minor_formatter(idx, pos=None):
return datelist[idx].strftime('%m-%d')
xMajorFormatter= FuncFormatter(x_major_formatter)
xMinorFormatter= FuncFormatter(x_minor_formatter)
return {'xMajorLocator': xMajorLocator,
'xMinorLocator': xMinorLocator,
'xMajorFormatter': xMajorFormatter,
'xMinorFormatter': xMinorFormatter,
'mdindex': mdindex,
'wdindex': wdindex
}
def _compute_xparams_fullspan(self):
'''
主要坐标点是每季第一个交易日,辅助坐标点是每月第一个交易日。是给宏观子图用的。
'''
quotes= self._pdata[u'行情']
datelist= [ datetime.date(int(ys), int(ms), int(ds)) for ys, ms, ds in [ dstr.split('-') for dstr in quotes[u'日期'] ] ]
# 确定 X 轴的 MinorLocator
mdindex= [] # 每个月第一个交易日在所有日期列表中的 index
sdindex= [] # 每季度第一个交易日在所有日期列表中的 index
ydindex= [] # 每年第一个交易日在所有日期列表中的 index
allyears= set([d.year for d in datelist]) # 所有的交易年份
for yr in sorted(allyears):
allmonths= set([d.month for d in datelist if d.year == yr]) # 当年所有的交易月份
for mon in sorted(allmonths):
monthday= min([dt for dt in datelist if dt.year==yr and dt.month==mon]) # 当月的第一个交易日
idx= datelist.index(monthday)
if mon in (1, 4, 7, 10):
sdindex.append(idx)
if mon == 1:
ydindex.append(idx)
else:
mdindex.append(idx)
xMajorLocator= FixedLocator(numpy.array(sdindex))
xMinorLocator= FixedLocator(numpy.array(mdindex))
# 确定 X 轴的 MajorFormatter 和 MinorFormatter
def x_major_formatter(idx, pos=None):
return datelist[idx].strftime('%Y-%m-%d')
def x_minor_formatter(idx, pos=None):
return datelist[idx].strftime('%m-%d')
xMajorFormatter= FuncFormatter(x_major_formatter)
xMinorFormatter= FuncFormatter(x_minor_formatter)
return {'xMajorLocator': xMajorLocator,
'xMinorLocator': xMinorLocator,
'xMajorFormatter': xMajorFormatter,
'xMinorFormatter': xMinorFormatter,
'sdindex': sdindex,
'mdindex': mdindex,
'ydindex': ydindex
}
def plot(self):
'''
'''
# self.plot_title()
# 调用子图对象的绘图函数
if 'basic' in self._subplots:
self._subplots['basic'].plot()
if 'price' in self._subplots:
self._subplots['price'].plot()
if 'torate' in self._subplots:
self._subplots['torate'].plot()
if 'pricefs' in self._subplots:
self._subplots['pricefs'].plot()
if 'toratefs' in self._subplots:
self._subplots['toratefs'].plot()
def plot_title(self):
'''
绘制整个 Figure 的标题
'''
info= self._pdata[u'公司信息']
figobj= self._Fig
# 整个 figure 的标题
subtitle= (info[u'代码'] + ' ' if u'代码' in info else '') + info[u'简称']
subtitle_2= (info[u'代码二'] + ' ' if u'代码二' in info else '') + info[u'简称二']
figobj.suptitle(subtitle + ' / ' + subtitle_2, fontsize=12, fontproperties=__font_properties__)
def savefig(self, figpath):
'''
保存图片
'''
self._Fig.savefig(figpath, dpi=self._figdpi, facecolor=self._figfacecolor, edgecolor=self._figedgecolor, linewidth=self._figlinewidth)
if __name__ == '__main__':
# pfile 指明存放绘图数据的 pickle file,figpath 指定图片需存放的路径
pfile= sys.argv[1]
figpath= sys.argv[2]
# 绘图数据 pdata
fileobj= open(name=pfile, mode='rb')
pdata= pickle.load(fileobj)
fileobj.close()
os.remove(pfile)
myfig= MyFigure(pdata=pdata)
myfig.plot()
myfig.savefig(figpath=figpath)
用 Python / Matplotlib 画出来的股票 K线图 (二)
---- 最新的在这里: 用 Python / Matplotlib 画出来的股票 K线图 (四)
---- 下一篇在这里: 用 Python / Matplotlib 画出来的股票 K线图 (三)
---- 上一版的改进,双股同列 + 无数细小改进,如下图。dpi= 300。明的一条是个股走势,暗的是同期的指数走势。这大概是近期最强的一只。
---- 要想培养对走势的感觉,采用固定比例尺的图形是必须的。一般股票软件里的图形都为显示方便而做了变形处理,用处不大。
---- 图形感觉差不多了,告一段落。接下来的目标是 股本结构、历史分配、行业板块、股东研究 这些信息,还包括个股资讯。实时的数据仍然暂时不碰。
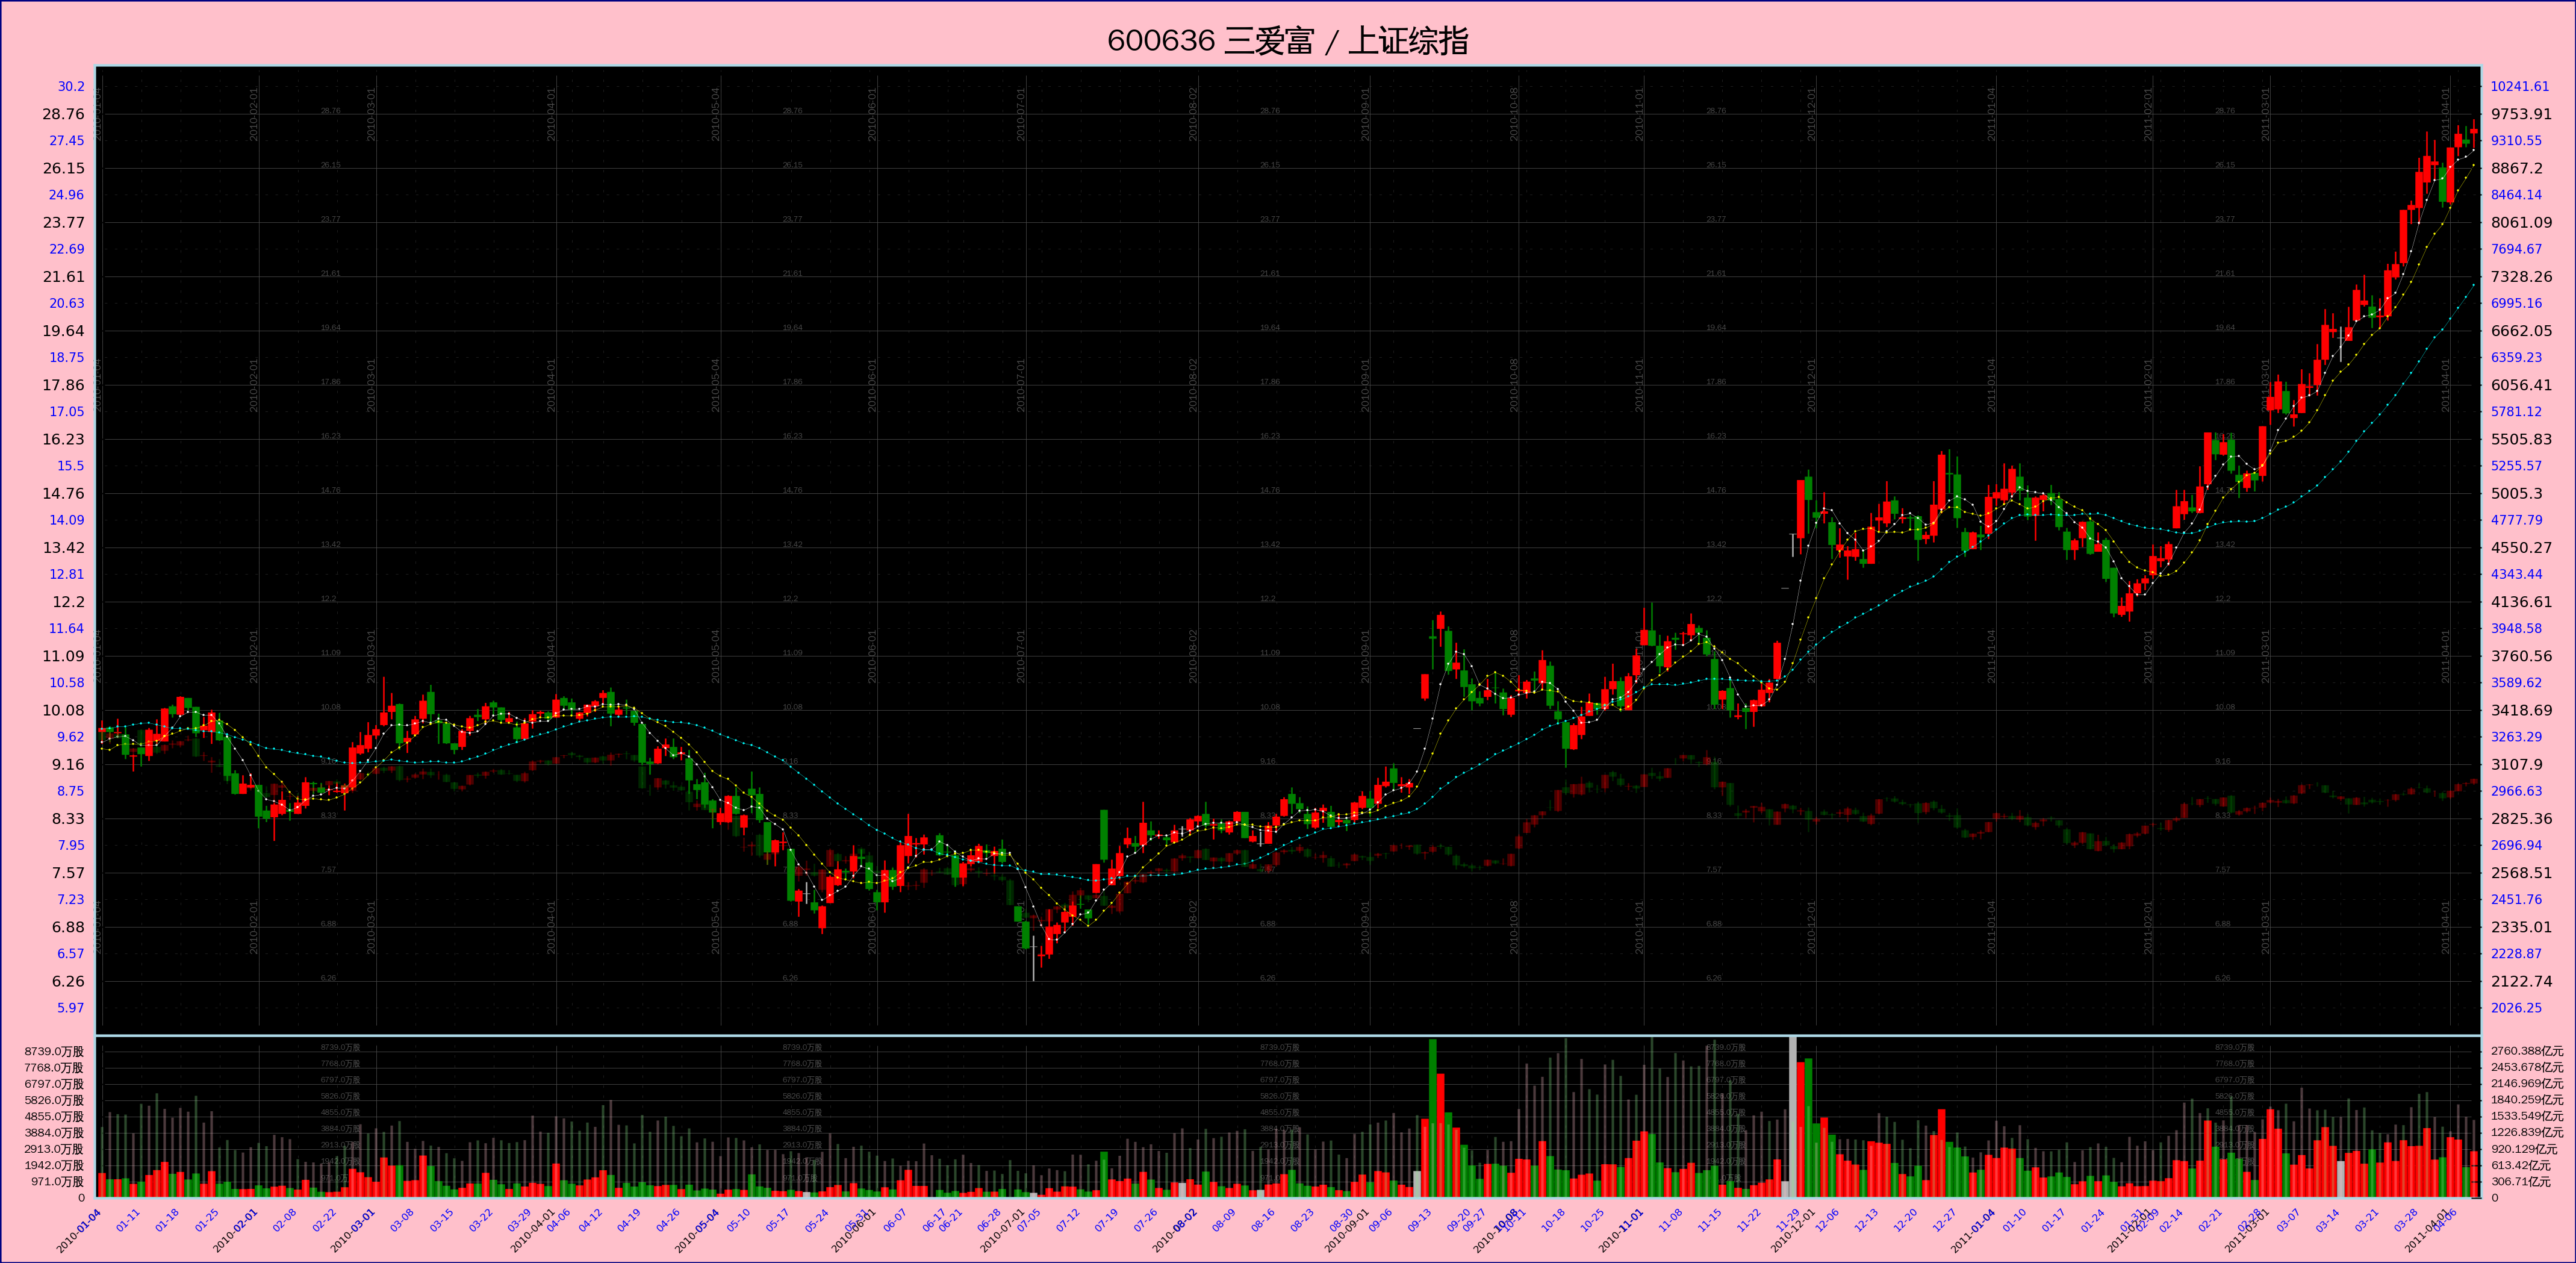
---- 源码贴出来。因为 Matplotlib 还不支持 Python3, 所以单写了一个 Python2 脚本。注意绘图数据是用 pickle file 传递的。
[补记:我决定放弃线性坐标了。这个脚本只支持对数坐标。]
# -*- coding: utf-8 -*-

import os
import sys
import pickle
import math
import datetime
import matplotlib

matplotlib.use("WXAgg", warn=True)	# 这个要紧跟在 import matplotlib 之后,而且必须安装了 wxpython 2.8 才行。

import matplotlib.pyplot as pyplot
import matplotlib.font_manager as font_manager

import numpy
from matplotlib.ticker import FixedLocator, MultipleLocator, FuncFormatter, NullFormatter


__font_properties__=font_manager.FontProperties(fname='/usr/share/fonts/truetype/wqy/wqy-zenhei.ttc')
__color_lightsalmon__= '#ffa07a'
__color_pink__= '#ffc0cb'
__color_navy__= '#000080'


def Plot(pfile, figpath):
	'''
	pfile 指明存放绘图数据的 pickle file,figpath 指定图片需存放的路径
	'''

	fileobj= open(name=pfile, mode='rb')
	pdata= pickle.load(fileobj)
	fileobj.close()
	os.remove(pfile)

	#	计算图片的尺寸(单位英寸)
	#	注意:Python2 里面, "1 / 10" 结果是 0, 必须写成 "1.0 / 10" 才会得到 0.1
	#==================================================================================================================================================
	length= len(pdata[u'日期'])		# 所有数据的长度,就是天数

	open_price_pri= pdata[u'开盘'][0]	# int 类型
	open_price_sec= pdata[u'开盘二'][0]	# 同上

	highest_price_pri= max( [phigh for phigh in pdata[u'最高'] if phigh != None] )		# 第一个行情的最高价
	highest_price_sec= max( [phigh for phigh in pdata[u'最高二'] if phigh != None] )	# 第二个行情的最高价
	highest_price= max(highest_price_pri, highest_price_sec*open_price_pri/open_price_sec)	# 以第一个行情为基准修正出的总最高价

	lowest_price_pri= min( [plow for plow in pdata[u'最低'] if plow != None] )	# 最低价
	lowest_price_sec= min( [plow for plow in pdata[u'最低二'] if plow != None] )	# 最低价
	lowest_price= min(lowest_price_pri, lowest_price_sec*open_price_pri/open_price_sec)	# 以第一个行情为基准修正出的总最低价


	yhighlim_price= int(highest_price * 1.1)	# K线子图 Y 轴最大坐标
	ylowlim_price=  int(lowest_price / 1.1)		# K线子图 Y 轴最小坐标


	xfactor= 10.0/230.0	# 一条 K 线的宽度在 X 轴上所占距离(英寸)
	yfactor= 0.3	# Y 轴上每一个距离单位的长度(英寸),这个单位距离是线性坐标和对数坐标通用的

	expbase= 1.1	# 底数,取得小一点,比较接近 1。股价 3 元到 4 元之间有大约 3 个单位距离

	# XXX: 价格在 Y 轴上的 “份数”。注意,虽然最高与最低价是以第一个行情为基准修正出来的,但其中包含的倍数因子对结果无影响,即:
	#	log(base, num1) - log(base, num2) ==
	#	log(base, num1/num2) ==
	#	log(base, k*num1/k*num2) ==
	#	log(base, k*num1) - log(base, k*num2)
	# ,这是对数运算的性质。
	ymulti_price= math.log(yhighlim_price, expbase)	- math.log(ylowlim_price, expbase)

	ymulti_vol= 3.0		# 成交量部分在 Y 轴所占的 “份数”
	ymulti_top= 1.2		# 顶部空白区域在 Y 轴所占的 “份数”
	ymulti_bot= 1.2		# 底部空白区域在 Y 轴所占的 “份数”

	xmulti_left= 12.0	# 左侧空白区域所占的 “份数”
	xmulti_right= 12.0	# 右侧空白区域所占的 “份数”

	xmulti_all= length + xmulti_left + xmulti_right
	xlen_fig= xmulti_all * xfactor		# 整个 Figure 的宽度
	ymulti_all= ymulti_price + ymulti_vol + ymulti_top + ymulti_bot
	ylen_fig= ymulti_all * yfactor		# 整个 Figure 的高度

	rect_1= (xmulti_left/xmulti_all, (ymulti_bot+ymulti_vol)/ymulti_all, length/xmulti_all, ymulti_price/ymulti_all)	# K线图部分
	rect_2= (xmulti_left/xmulti_all, ymulti_bot/ymulti_all, length/xmulti_all, ymulti_vol/ymulti_all)	# 成交量部分


	#	建立 Figure 对象
	#==================================================================================================================================================
	figfacecolor= __color_pink__
	figedgecolor= __color_navy__
	figdpi= 300
	figlinewidth= 1.0

	figobj= pyplot.figure(figsize=(xlen_fig, ylen_fig), dpi=figdpi, facecolor=figfacecolor, edgecolor=figedgecolor, linewidth=figlinewidth)	# Figure 对象

	# 整个 figure 的标题
	title_pri= (pdata[u'代码'] + ' ' if u'代码' in pdata else '') + pdata[u'简称']
	title_sec= (pdata[u'代码二'] + '   ' if u'代码二' in pdata else '') + pdata[u'简称二']

	figobj.suptitle(title_pri + ' / ' + title_sec, fontsize=12, fontproperties=__font_properties__)


	#==================================================================================================================================================
	#==================================================================================================================================================
	#=======
	#=======	XXX: 第一只:成交量部分
	#=======
	#==================================================================================================================================================
	#==================================================================================================================================================

	#	第一只:添加 Axes 对象
	#==================================================================================================================================================
	axes_2= figobj.add_axes(rect_2, axis_bgcolor='black')
	axes_2.set_axisbelow(True)	# 网格线放在底层

	#	第一只:改变坐标线的颜色
	#==================================================================================================================================================
	for child in axes_2.get_children():
		if isinstance(child, matplotlib.spines.Spine):
			child.set_color('lightblue')

	#	第一只:得到 X 轴 和 Y 轴 的两个 Axis 对象
	#==================================================================================================================================================
	xaxis_2= axes_2.get_xaxis()
	yaxis_2= axes_2.get_yaxis()

	#	第一只:设置两个坐标轴上的 grid
	#==================================================================================================================================================
	xaxis_2.grid(True, 'major', color='0.3', linestyle='solid', linewidth=0.2)
	xaxis_2.grid(True, 'minor', color='0.3', linestyle='dotted', linewidth=0.1)

	yaxis_2.grid(True, 'major', color='0.3', linestyle='solid', linewidth=0.2)
	yaxis_2.grid(True, 'minor', color='0.3', linestyle='dotted', linewidth=0.1)


	#==================================================================================================================================================
	#=======	第一只:成交量绘图
	#==================================================================================================================================================
	xindex= numpy.arange(length)	# X 轴上的 index,一个辅助数据

	zipoc= zip(pdata[u'开盘'], pdata[u'收盘'])
	up=   numpy.array( [ True if po < pc and po != None else False for po, pc in zipoc] )		# 标示出该天股价日内上涨的一个序列
	down= numpy.array( [ True if po > pc and po != None else False for po, pc in zipoc] )		# 标示出该天股价日内下跌的一个序列
	side= numpy.array( [ True if po == pc and po != None else False for po, pc in zipoc] )		# 标示出该天股价日内走平的一个序列


	if u'成交额' in pdata:
		volume= pdata[u'成交额']
	else:
		volume= pdata[u'成交量']

	rarray_vol= numpy.array(volume)
	volzeros= numpy.zeros(length)	# 辅助数据

	# XXX: 如果 up/down/side 各项全部为 False,那么 vlines() 会报错。
	if True in up:
		axes_2.vlines(xindex[up], volzeros[up], rarray_vol[up], edgecolor='red', linewidth=3.0, label='_nolegend_')
	if True in down:
		axes_2.vlines(xindex[down], volzeros[down], rarray_vol[down], edgecolor='green', linewidth=3.0, label='_nolegend_')
	if True in side:
		axes_2.vlines(xindex[side], volzeros[side], rarray_vol[side], edgecolor='0.7', linewidth=3.0, label='_nolegend_')


	#	第一只:设定 X 轴坐标的范围
	#==================================================================================================================================================
	axes_2.set_xlim(-1, length)


	#	第一只:设定 X 轴上的坐标
	#==================================================================================================================================================
	datelist= [ datetime.date(int(ys), int(ms), int(ds)) for ys, ms, ds in [ dstr.split('-') for dstr in pdata[u'日期'] ] ]

	# 确定 X 轴的 MajorLocator
	mdindex= []	# 每个月第一个交易日在所有日期列表中的 index
	years= set([d.year for d in datelist])	# 所有的交易年份

	for y in sorted(years):
		months= set([d.month for d in datelist if d.year == y])		# 当年所有的交易月份
		for m in sorted(months):
			monthday= min([dt for dt in datelist if dt.year==y and dt.month==m])	# 当月的第一个交易日
			mdindex.append(datelist.index(monthday))

	xMajorLocator= FixedLocator(numpy.array(mdindex))

	# 第一只:确定 X 轴的 MinorLocator
	wdindex= {}	# value: 每周第一个交易日在所有日期列表中的 index; key: 当周的序号 week number(当周是第几周)

	for d in datelist:
		isoyear, weekno= d.isocalendar()[0:2]
		dmark= isoyear*100 + weekno
		if dmark not in wdindex:
			wdindex[dmark]= datelist.index(d)

	xMinorLocator= FixedLocator(numpy.array( sorted(wdindex.values()) ))

	# 第一只:确定 X 轴的 MajorFormatter 和 MinorFormatter
	def x_major_formatter_2(idx, pos=None):
		return datelist[idx].strftime('%Y-%m-%d')

	def x_minor_formatter_2(idx, pos=None):
		return datelist[idx].strftime('%m-%d')

	xMajorFormatter= FuncFormatter(x_major_formatter_2)
	xMinorFormatter= FuncFormatter(x_minor_formatter_2)

	# 第一只:设定 X 轴的 Locator 和 Formatter
	xaxis_2.set_major_locator(xMajorLocator)
	xaxis_2.set_major_formatter(xMajorFormatter)

	xaxis_2.set_minor_locator(xMinorLocator)
	xaxis_2.set_minor_formatter(xMinorFormatter)

	# 第一只:设定 X 轴主要坐标点与辅助坐标点的样式
	for malabel in axes_2.get_xticklabels(minor=False):
		malabel.set_fontsize(4)
		malabel.set_horizontalalignment('right')
		malabel.set_rotation('45')

	for milabel in axes_2.get_xticklabels(minor=True):
		milabel.set_fontsize(4)
		milabel.set_color('blue')
		milabel.set_horizontalalignment('right')
		milabel.set_rotation('45')


	#	第一只:设定成交量 Y 轴坐标的范围
	#==================================================================================================================================================
	maxvol= max(volume)	# 注意是 int 类型
	axes_2.set_ylim(0, maxvol)


	#	第一只:设定成交量 Y 轴上的坐标
	#==================================================================================================================================================
	vollen= len(str(maxvol))

	volstep_pri= int(round(maxvol/10.0+5000, -4))

	yMajorLocator_2= MultipleLocator(volstep_pri)


	# 第一只:确定 Y 轴的 MajorFormatter
	dimsuffix= u'元' if u'成交额' in pdata else u'股'
	def y_major_formatter_2(num, pos=None):
		if num >= 10**8:	# 大于 1 亿
			return (str(round(num/10.0**8, 2)) + u'亿' + dimsuffix) if num != 0 else '0'
		else:
			return (str(num/10.0**4) + u'万' + dimsuffix) if num != 0 else '0'

	#	def y_major_formatter_2(num, pos=None):
	#		return int(num)
	yMajorFormatter_2= FuncFormatter(y_major_formatter_2)

	# 确定 Y 轴的 MinorFormatter
	#	def y_minor_formatter_2(num, pos=None):
	#		return int(num)
	#	yMinorFormatter_2= FuncFormatter(y_minor_formatter_2)
	yMinorFormatter_2= NullFormatter()

	# 第一只:设定 X 轴的 Locator 和 Formatter
	yaxis_2.set_major_locator(yMajorLocator_2)
	yaxis_2.set_major_formatter(yMajorFormatter_2)

	#	yaxis_2.set_minor_locator(yMinorLocator_2)
	yaxis_2.set_minor_formatter(yMinorFormatter_2)

	# 第一只:设定 Y 轴主要坐标点与辅助坐标点的样式
	for malab in axes_2.get_yticklabels(minor=False):
		malab.set_font_properties(__font_properties__)
		malab.set_fontsize(4.5)	# 这个必须放在前一句后面,否则作用会被覆盖


	#	第一只:成交量数值在图中间的显示
	#==================================================================================================================================================
	for iy in range(volstep_pri, maxvol, volstep_pri):
		for ix in mdindex[1:-1:3]:
			newlab= axes_2.text(ix+8, iy, y_major_formatter_2(iy))
			newlab.set_font_properties(__font_properties__)
			newlab.set_color('0.3')
			newlab.set_fontsize(3)
			newlab.set_zorder(0)		# XXX: 放在底层
			#	newlab.set_verticalalignment('center')


	#==================================================================================================================================================
	#==================================================================================================================================================
	#=======
	#=======	XXX: 第二条成交量图线
	#=======
	#==================================================================================================================================================
	#==================================================================================================================================================

	#	添加 Axes 对象
	#==================================================================================================================================================
	axes_2_sec= axes_2.twinx()
	#	axes_2_sec.set_axisbelow(True)	# 网格线放在底层

	axes_2_sec.set_axisbelow(True)	# 网格线放在底层

	#	改变坐标线的颜色
	#==================================================================================================================================================
	#	for child in axes_2_sec.get_children():
	#		if isinstance(child, matplotlib.spines.Spine):
	#			child.set_color('lightblue')

	#	得到 X 轴 和 Y 轴 的两个 Axis 对象
	#==================================================================================================================================================
	xaxis_2_sec= axes_2_sec.get_xaxis()
	yaxis_2_sec= axes_2_sec.get_yaxis()

	#	设置两个坐标轴上的 grid
	#==================================================================================================================================================
	#	xaxis_2_sec.grid(True, 'major', color='0.3', linestyle='solid', linewidth=0.2)
	#	xaxis_2_sec.grid(True, 'minor', color='0.3', linestyle='dotted', linewidth=0.1)

	#	yaxis_2_sec.grid(True, 'major', color='0.3', linestyle='solid', linewidth=0.2)
	#	yaxis_2_sec.grid(True, 'minor', color='0.3', linestyle='dotted', linewidth=0.1)


	#==================================================================================================================================================
	#=======	绘图
	#==================================================================================================================================================

	if u'成交额二' in pdata:
		volume_sec= pdata[u'成交额二']
	else:
		volume_sec= pdata[u'成交量二']

	zipoc_sec= zip(pdata[u'开盘二'], pdata[u'收盘二'])
	up_sec=   numpy.array( [ True if po < pc and po != None else False for po, pc in zipoc_sec] )		# 标示出该天股价日内上涨的一个序列
	down_sec= numpy.array( [ True if po > pc and po != None else False for po, pc in zipoc_sec] )		# 标示出该天股价日内下跌的一个序列
	side_sec= numpy.array( [ True if po == pc and po != None else False for po, pc in zipoc_sec] )		# 标示出该天股价日内走平的一个序列

	rarray_vol_sec= numpy.array(volume_sec)
	volzeros_sec= numpy.zeros(length)	# 辅助数据

	# XXX: 如果 up_sec/down_sec/side_sec 各项全部为 False,那么 vlines() 会报错。
	if True in up_sec:
		axes_2_sec.vlines(xindex[up_sec], volzeros_sec[up_sec], rarray_vol_sec[up_sec], edgecolor='pink', linewidth=1.0, label='_nolegend_', alpha=0.3)
	if True in down_sec:
		axes_2_sec.vlines(xindex[down_sec], volzeros_sec[down_sec], rarray_vol_sec[down_sec], edgecolor='lightgreen', linewidth=1.0, label='_nolegend_', alpha=0.3)
	if True in side_sec:
		axes_2_sec.vlines(xindex[side_sec], volzeros_sec[side_sec], rarray_vol_sec[side_sec], edgecolor='0.7', linewidth=1.0, label='_nolegend_', alpha=0.3)


	#	设定 X 轴坐标的范围
	#==================================================================================================================================================
	#	XXX: 不用了,与 axes_2 共用。


	#	设定 Y 轴坐标的范围
	#==================================================================================================================================================
	maxvol_sec= max(volume_sec)	# 注意是 int 类型
	axes_2_sec.set_ylim(0, maxvol_sec)


	#	设定 Y 轴上的坐标
	#==================================================================================================================================================

	volstep_sec= volstep_pri*maxvol_sec/float(maxvol)
	yMajorLocator_2_sec= MultipleLocator(volstep_sec)

	# 确定 Y 轴的 MajorFormatter
	dimsuffix_sec= u'元' if u'成交额二' in pdata else u'股'
	def y_major_formatter_2_sec(num, pos=None):
		if num >= 10**8:	# 大于 1 亿
			print(('num= ' + str(num) + ', result= ' + str(round(num/10.0**8, 3)) + u'亿' + dimsuffix_sec).encode('utf8'))

			return (str(round(num/10.0**8, 3)) + u'亿' + dimsuffix_sec) if num != 0 else '0'
		else:
			return (str(round(num/10.0**4, 2)) + u'万' + dimsuffix_sec) if num != 0 else '0'

	#	def y_major_formatter_2_sec(num, pos=None):
	#		return int(num)
	yMajorFormatter_2_sec= FuncFormatter(y_major_formatter_2_sec)

	# 确定 Y 轴的 MinorFormatter
	#	def y_minor_formatter_2(num, pos=None):
	#		return int(num)
	#	yMinorFormatter_2_sec= FuncFormatter(y_minor_formatter_2)
	yMinorFormatter_2_sec= NullFormatter()

	# 设定 X 轴的 Locator 和 Formatter
	yaxis_2_sec.set_major_locator(yMajorLocator_2_sec)
	yaxis_2_sec.set_major_formatter(yMajorFormatter_2_sec)

	#	yaxis_2_sec.set_minor_locator(yMinorLocator_2_sec)
	yaxis_2_sec.set_minor_formatter(yMinorFormatter_2_sec)

	# 设定 Y 轴主要坐标点与辅助坐标点的样式
	for malab in axes_2_sec.get_yticklabels(minor=False):
		malab.set_font_properties(__font_properties__)
		malab.set_fontsize(4.5)	# 这个必须放在前一句后面,否则作用会被覆盖


	#==================================================================================================================================================
	#==================================================================================================================================================
	#=======
	#=======	XXX: K 线图部分
	#=======
	#==================================================================================================================================================
	#==================================================================================================================================================

	#	添加 Axes 对象
	#==================================================================================================================================================
	axes_1= figobj.add_axes(rect_1, axis_bgcolor='black', sharex=axes_2)
	axes_1.set_axisbelow(True)	# 网格线放在底层

	axes_1.set_yscale('log', basey=expbase)		# 使用对数坐标

	#	改变坐标线的颜色
	#==================================================================================================================================================
	for child in axes_1.get_children():
		if isinstance(child, matplotlib.spines.Spine):
			child.set_color('lightblue')

	#	得到 X 轴 和 Y 轴 的两个 Axis 对象
	#==================================================================================================================================================
	xaxis_1= axes_1.get_xaxis()
	yaxis_1= axes_1.get_yaxis()

	#	设置两个坐标轴上的 grid
	#==================================================================================================================================================
	xaxis_1.grid(True, 'major', color='0.3', linestyle='solid', linewidth=0.2)
	xaxis_1.grid(True, 'minor', color='0.3', linestyle='dotted', linewidth=0.1)

	yaxis_1.grid(True, 'major', color='0.3', linestyle='solid', linewidth=0.2)
	yaxis_1.grid(True, 'minor', color='0.3', linestyle='dotted', linewidth=0.1)


	#==================================================================================================================================================
	#=======	绘图
	#==================================================================================================================================================

	#	绘制 K 线部分
	#==================================================================================================================================================

	#	对开收盘价进行视觉修正
	for idx, poc in enumerate( zip(pdata[u'开盘'], pdata[u'收盘']) ):
		if poc[0] == poc[1] and None not in poc:
			variant= round((poc[1]+1000)/2000, 0)
			pdata[u'开盘'][idx]= poc[0] - variant		# 稍微偏离一点,使得在图线上不致于完全看不到
			pdata[u'收盘'][idx]= poc[1] + variant

	rarray_open= numpy.array(pdata[u'开盘'])
	rarray_close= numpy.array(pdata[u'收盘'])
	rarray_high= numpy.array(pdata[u'最高'])
	rarray_low= numpy.array(pdata[u'最低'])

	# XXX: 如果 up, down, side 里有一个全部为 False 组成,那么 vlines() 会报错。
	# XXX: 可以使用 alpha 参数调节透明度
	if True in up:
		axes_1.vlines(xindex[up], rarray_low[up], rarray_high[up], edgecolor='red', linewidth=0.6, label='_nolegend_')
		axes_1.vlines(xindex[up], rarray_open[up], rarray_close[up], edgecolor='red', linewidth=3.0, label='_nolegend_')

	if True in down:
		axes_1.vlines(xindex[down], rarray_low[down], rarray_high[down], edgecolor='green', linewidth=0.6, label='_nolegend_')
		axes_1.vlines(xindex[down], rarray_open[down], rarray_close[down], edgecolor='green', linewidth=3.0, label='_nolegend_')

	if True in side:
		axes_1.vlines(xindex[side], rarray_low[side], rarray_high[side], edgecolor='0.7', linewidth=0.6, label='_nolegend_')
		axes_1.vlines(xindex[side], rarray_open[side], rarray_close[side], edgecolor='0.7', linewidth=3.0, label='_nolegend_')

	#	绘制均线部分
	#==================================================================================================================================================
	if u'5日均' in pdata:
		rarray_5dayave= numpy.array(pdata[u'5日均'])
		axes_1.plot(xindex, rarray_5dayave, 'o-', color='white', linewidth=0.1, label='ave_5', \
			markersize=0.7, markeredgecolor='white', markeredgewidth=0.1)	# 5日均线

	if u'10日均' in pdata:
		rarray_10dayave= numpy.array(pdata[u'10日均'])
		axes_1.plot(xindex, rarray_10dayave, 'o-', color='yellow', linewidth=0.1, label='ave_10', \
			markersize=0.7, markeredgecolor='yellow', markeredgewidth=0.1)	# 10日均线

	if u'30日均' in pdata:
		rarray_30dayave= numpy.array(pdata[u'30日均'])
		axes_1.plot(xindex, rarray_30dayave, 'o-', color='cyan', linewidth=0.1, label='ave_30', \
			markersize=0.7, markeredgecolor='cyan', markeredgewidth=0.1)	# 30日均线


	#	绘制 复权提示
	#==================================================================================================================================================
	if u'复权' in pdata:
		adjdict= dict(pdata[u'复权'])

		for idx, dstr in enumerate(pdata[u'日期']):
			if dstr in adjdict:
				axes_1.plot([idx, idx], [ylowlim_price, yhighlim_price], '-', color='purple', linewidth=0.3)


	#	设定 X 轴坐标的范围
	#==================================================================================================================================================
	axes_1.set_xlim(-1, length)


	#	先设置 label 位置,再将 X 轴上的坐标设为不可见。因为与 成交量子图 共用 X 轴
	#==================================================================================================================================================

	# 设定 X 轴的 Locator 和 Formatter
	xaxis_1.set_major_locator(xMajorLocator)
	xaxis_1.set_major_formatter(xMajorFormatter)

	xaxis_1.set_minor_locator(xMinorLocator)
	xaxis_1.set_minor_formatter(xMinorFormatter)

	# 将 X 轴上的坐标设为不可见。
	for malab in axes_1.get_xticklabels(minor=False):
		malab.set_visible(False)

	for milab in axes_1.get_xticklabels(minor=True):
		milab.set_visible(False)

	# 用这一段效果也一样
	#	pyplot.setp(axes_1.get_xticklabels(minor=False), visible=False)
	#	pyplot.setp(axes_1.get_xticklabels(minor=True), visible=False)


	#	设定 Y 轴坐标的范围
	#==================================================================================================================================================
	axes_1.set_ylim(ylowlim_price, yhighlim_price)


	#	设定 Y 轴上的坐标
	#==================================================================================================================================================

	# XXX: 不用 LogLocator 了,因为不能控制坐标点的位置。

	#	主要坐标点
	#----------------------------------------------------------------------------
	yticks_major_pri= []
	for i in range(1, 999):
		newloc= ylowlim_price * (expbase**i)
		if newloc <= yhighlim_price:
			yticks_major_pri.append(newloc)
		else:
			break

	yMajorLocator_1= FixedLocator(numpy.array(yticks_major_pri))

	# 确定 Y 轴的 MajorFormatter
	def y_major_formatter_1(num, pos=None):
		return str(round(num/1000.0, 2))

	yMajorFormatter_1= FuncFormatter(y_major_formatter_1)

	# 设定 X 轴的 Locator 和 Formatter
	yaxis_1.set_major_locator(yMajorLocator_1)
	yaxis_1.set_major_formatter(yMajorFormatter_1)

	# 设定 Y 轴主要坐标点与辅助坐标点的样式
	for mal in axes_1.get_yticklabels(minor=False):
		mal.set_fontsize(6)


	#	辅助坐标点
	#----------------------------------------------------------------------------
	yticks_minor_pri= []
	mtstart= ylowlim_price * (1.0+(expbase-1.0)/2)
	for i in range(999):
		newloc= mtstart * (expbase**i)
		if newloc <= yhighlim_price:
			yticks_minor_pri.append(newloc)
		else:
			break

	yMinorLocator_1= FixedLocator(numpy.array(yticks_minor_pri))		# XXX minor ticks 已经在上面一并设置,这里不需要了。

	# 确定 Y 轴的 MinorFormatter
	def y_minor_formatter_1(num, pos=None):
		return str(round(num/1000.0, 2))

	yMinorFormatter_1= FuncFormatter(y_minor_formatter_1)

	# 设定 X 轴的 Locator 和 Formatter
	yaxis_1.set_minor_locator(yMinorLocator_1)
	yaxis_1.set_minor_formatter(yMinorFormatter_1)
	# 设定 Y 轴主要坐标点与辅助坐标点的样式
	for mal in axes_1.get_yticklabels(minor=True):
		mal.set_fontsize(5)
		mal.set_color('blue')


	#	第一只:价格数值在图中间的显示
	#==================================================================================================================================================
	for iy in yticks_major_pri:
		for ix in mdindex[1:-1:3]:
			newlab= axes_1.text(ix+8, iy*1.001, y_major_formatter_1(iy))
			newlab.set_font_properties(__font_properties__)
			newlab.set_color('0.3')
			newlab.set_fontsize(3)
			newlab.set_zorder(0)		# XXX: 放在底层
			#	newlab.set_verticalalignment('center')


	#	第一只:日期在图中间的显示
	#==================================================================================================================================================
	for iy in yticks_minor_pri[1:-1:5]:
		for ix in mdindex:
			newlab= axes_1.text(ix-1, iy, pdata[u'日期'][ix])
			newlab.set_font_properties(__font_properties__)
			newlab.set_color('0.3')
			newlab.set_fontsize(4)
			newlab.set_rotation('vertical')
			#	newlab.set_horizontalalignment('left')
			#	newlab.set_verticalalignment('bottom')
			newlab.set_zorder(0)		# XXX: 放在底层
			#	newlab.set_verticalalignment('center')


	#==================================================================================================================================================
	#==================================================================================================================================================
	#=======
	#=======	XXX: 第二条 K 线图
	#=======
	#==================================================================================================================================================
	#==================================================================================================================================================

	#	添加 Axes 对象
	#==================================================================================================================================================
	axes_1_sec= axes_1.twinx()
	#	axes_1_sec.set_axisbelow(True)	# 网格线放在底层

	axes_1_sec.set_yscale('log', basey=expbase)	# 使用对数坐标


	#	得到 X 轴 和 Y 轴 的两个 Axis 对象
	#==================================================================================================================================================
	xaxis_1_sec= axes_1_sec.get_xaxis()
	yaxis_1_sec= axes_1_sec.get_yaxis()


	#==================================================================================================================================================
	#=======	绘图
	#==================================================================================================================================================

	#	绘制 K 线部分
	#==================================================================================================================================================

	#	对开收盘价进行视觉修正
	for idx, poc in enumerate( zipoc_sec ):
		if poc[0] == poc[1] and None not in poc:
			pdata[u'开盘二'][idx]= poc[0] - 5		# 稍微偏离一点,使得在图线上不致于完全看不到
			pdata[u'收盘二'][idx]= poc[1] + 5

	rarray_open= numpy.array(pdata[u'开盘二'])
	rarray_close= numpy.array(pdata[u'收盘二'])
	rarray_high= numpy.array(pdata[u'最高二'])
	rarray_low= numpy.array(pdata[u'最低二'])

	# XXX: 如果 up_sec, down_sec, side_sec 里有一个全部为 False 组成,那么 vlines() 会报错。
	# XXX: 可以使用 alpha 参数调节透明度
	if True in up_sec:
		axes_1_sec.vlines(xindex[up_sec], rarray_low[up_sec], rarray_high[up_sec], edgecolor='red', linewidth=0.6, label='_nolegend_', alpha=0.3)
		axes_1_sec.vlines(xindex[up_sec], rarray_open[up_sec], rarray_close[up_sec], edgecolor='red', linewidth=3.0, label='_nolegend_', alpha=0.3)

	if True in down_sec:
		axes_1_sec.vlines(xindex[down_sec], rarray_low[down_sec], rarray_high[down_sec], edgecolor='green', linewidth=0.6, label='_nolegend_', alpha=0.3)
		axes_1_sec.vlines(xindex[down_sec], rarray_open[down_sec], rarray_close[down_sec], edgecolor='green', linewidth=3.0, label='_nolegend_', alpha=0.3)

	if True in side_sec:
		axes_1_sec.vlines(xindex[side_sec], rarray_low[side_sec], rarray_high[side_sec], edgecolor='0.7', linewidth=0.6, label='_nolegend_', alpha=0.3)
		axes_1_sec.vlines(xindex[side_sec], rarray_open[side_sec], rarray_close[side_sec], edgecolor='0.7', linewidth=3.0, label='_nolegend_', alpha=0.3)


	#	设定 X 轴坐标的范围
	#==================================================================================================================================================
	axes_1_sec.set_xlim(-1, length)


	#	先设置 label 位置,再将 X 轴上的坐标设为不可见。因为与 成交量子图 共用 X 轴
	#==================================================================================================================================================

	# 设定 X 轴的 Locator 和 Formatter
	xaxis_1_sec.set_major_locator(xMajorLocator)
	xaxis_1_sec.set_major_formatter(xMajorFormatter)

	xaxis_1_sec.set_minor_locator(xMinorLocator)
	xaxis_1_sec.set_minor_formatter(xMinorFormatter)

	# 将 X 轴上的坐标设为不可见。
	for malab in axes_1_sec.get_xticklabels(minor=False):
		malab.set_visible(False)

	for milab in axes_1_sec.get_xticklabels(minor=True):
		milab.set_visible(False)


	#	设定 Y 轴坐标的范围
	#==================================================================================================================================================
	axes_1_sec.set_ylim(ylowlim_price*open_price_sec/open_price_pri, yhighlim_price*open_price_sec/open_price_pri)


	#	设定 Y 轴上的坐标
	#==================================================================================================================================================

	#	主要坐标点
	#----------------------------------------------------------------------------
	yticks_major_sec= []
	ylowlim_price_sec=  ylowlim_price*open_price_sec/open_price_pri
	yhighlim_price_sec= yhighlim_price*open_price_sec/open_price_pri

	for i in range(1, 999):
		newloc= ylowlim_price_sec * (expbase**i)
		if newloc <= yhighlim_price_sec:
			yticks_major_sec.append(newloc)
		else:
			break

	yMajorLocator_1_sec= FixedLocator(numpy.array(yticks_major_sec))

	# 确定 Y 轴的 MajorFormatter
	def y_major_formatter_1_sec(num, pos=None):
		return str(round(num/1000.0, 2))

	yMajorFormatter_1_sec= FuncFormatter(y_major_formatter_1_sec)

	# 设定 X 轴的 Locator 和 Formatter
	yaxis_1_sec.set_major_locator(yMajorLocator_1_sec)
	yaxis_1_sec.set_major_formatter(yMajorFormatter_1_sec)

	# 设定 Y 轴主要坐标点与辅助坐标点的样式
	for mal in axes_1_sec.get_yticklabels(minor=False):
		mal.set_fontsize(6)


	#	辅助坐标点
	#----------------------------------------------------------------------------
	yticks_minor_sec= []
	mtstart_sec= ylowlim_price_sec * (1.0+(expbase-1.0)/2)
	for i in range(999):
		newloc= mtstart_sec * (expbase**i)
		if newloc <= yhighlim_price_sec:
			yticks_minor_sec.append(newloc)
		else:
			break

	yMinorLocator_1_sec= FixedLocator(numpy.array(yticks_minor_sec))		# XXX minor ticks 已经在上面一并设置,这里不需要了。

	# 确定 Y 轴的 MinorFormatter
	def y_minor_formatter_1_sec(num, pos=None):
		return str(round(num/1000.0, 2))

	yMinorFormatter_1_sec= FuncFormatter(y_minor_formatter_1_sec)

	# 设定 X 轴的 Locator 和 Formatter
	yaxis_1_sec.set_minor_locator(yMinorLocator_1_sec)
	yaxis_1_sec.set_minor_formatter(yMinorFormatter_1_sec)
	# 设定 Y 轴主要坐标点与辅助坐标点的样式
	for mal in axes_1_sec.get_yticklabels(minor=True):
		mal.set_fontsize(5)
		mal.set_color('blue')


	#	显示图片
	#==================================================================================================================================================
	#	pyplot.show()

	#	保存图片
	#==================================================================================================================================================
	figobj.savefig(figpath, dpi=figdpi, facecolor=figfacecolor, edgecolor=figedgecolor, linewidth=figlinewidth)


if __name__ == '__main__':
	Plot(pfile=sys.argv[1], figpath=sys.argv[2])
用来画股票 K线图 的 Python 脚本
---- <补记>:
最新的在这里: 用 Python / Matplotlib 画出来的股票 K线图 (四)
下一篇在这里: 用 Python / Matplotlib 画出来的股票 K线图 (三)
---- 花了 20 个小时左右的时间才从新浪下载完复权日线数据,把复权日线表建起来。这速度也太慢了,还有首次下载网页失败的比例居然这么高,一定有问题,印象中以前不是这么慢的,下载几千只股票的数据也只有几十个页面会首次下载失败吧。但昨天晚上更新最新数据的时候把下载任务之间的延迟扩大了一些,好像好一些,速度还可以,而且失败率不高。我开的是 5 个线程,下载页面之间的间隔是 0.2 ~ 0.3 秒。
---- 另外,把那个画 K 线图的脚本贴出来。这个脚本是通过研究 Matplotlib 官网里的示例并且借助 Google,用大概 1 周的时间改出来的。简单介绍一下:
1. 由两个子图(subplot)构成,上面一个显示价格(K 线),下面一个显示成交量。
2. K 线子图可以使用线性坐标或者对数坐标(由 Plot() 函数第三个参数控制)。使用线性坐标的时候,每个单位价格区间所占高度是固定的;使用对数坐标的时候,每个单位涨幅区间(比如 10%)所占高度是固定的。成交量子图的高度总是固定,不论成交量数值大小。
3. 对 X 轴来说,每根 K 线的宽度固定,整个图形的宽度决定于行情的天数。只要把行情数据文件作为参数传递过去就可以,图片尺寸由程序自主计算。
4. 另外,figdpi 这个变量控制图片的分辨率(解析度),可以随意调大调小。上一篇文章里贴的图使用的 dpi 值是 300。另外,X 轴和 Y 轴上的坐标点也是程序自主决定的。
---- 整个脚本还是一个 work-in-progress,目前的局限主要在于使用对数坐标时,Y 轴坐标点的确定。前一篇里所贴的那个图,可以看见价格上限在 20 块左右,如果换一只价格 90 块上下的股票,或者用来画几千点的指数行情,那 Y 轴的坐标点就会太密集。解决办法是根据取值区间来自主选择合适的 Y 轴坐标间距,但是这个目前还没有做。
---- 任何意见或建议都许多欢迎 !
---- <补记>:已经有了大幅改进的版本,在下一篇里。
# -*- coding: utf-8 -*-

import sys
import pickle
import math
import datetime
import matplotlib

matplotlib.use("WXAgg", warn=True)	# 这个要紧跟在 import matplotlib 之后,而且必须安装了 wxpython 2.8 才行。

import matplotlib.pyplot as pyplot
import numpy
from matplotlib.ticker import FixedLocator, MultipleLocator, LogLocator, FuncFormatter, NullFormatter, LogFormatter


def Plot(pfile, figpath, useexpo=True):
	'''
	pfile 指明存放绘图数据的 pickle file,figpath 指定图片需存放的路径
	'''

	fileobj= open(name=pfile, mode='rb')
	pdata= pickle.load(fileobj)
	fileobj.close()

	#	计算图片的尺寸(单位英寸)
	#	注意:Python2 里面, "1 / 10" 结果是 0, 必须写成 "1.0 / 10" 才会得到 0.1
	#==================================================================================================================================================

	length= len(pdata[u'日期'])		# 所有数据的长度,就是天数

	highest_price= max(pdata[u'最高'])	# 最高价
	lowest_price= min( [plow for plow in pdata[u'最低'] if plow != None] )	# 最低价

	yhighlim_price= round(highest_price+50, -2)	# K线子图 Y 轴最大坐标
	ylowlim_price=  round(lowest_price-50, -2)	# K线子图 Y 轴最小坐标

	xfactor= 10.0/230.0	# 一条 K 线的宽度在 X 轴上所占距离(英寸)
	yfactor= 0.3	# Y 轴上每一个距离单位的长度(英寸),这个单位距离是线性坐标和对数坐标通用的

	if useexpo:	# 要使用对数坐标
		expbase= 1.1	# 底数,取得小一点,比较接近 1。股价 3 元到 4 元之间有大约 3 个单位距离
		ymulti_price= math.log(yhighlim_price, expbase)	- math.log(ylowlim_price, expbase)	# 价格在 Y 轴上的 “份数”

	else:
		ymulti_price= (yhighlim_price - ylowlim_price) / 100	# 价格在 Y 轴上的 “份数”

	ymulti_vol= 3.0		# 成交量部分在 Y 轴所占的 “份数”
	ymulti_top= 0.2		# 顶部空白区域在 Y 轴所占的 “份数”
	ymulti_bot= 0.8		# 底部空白区域在 Y 轴所占的 “份数”

	xmulti_left= 10.0	# 左侧空白区域所占的 “份数”
	xmulti_right= 3.0	# 右侧空白区域所占的 “份数”

	xmulti_all= length + xmulti_left + xmulti_right
	xlen_fig= xmulti_all * xfactor		# 整个 Figure 的宽度
	ymulti_all= ymulti_price + ymulti_vol + ymulti_top + ymulti_bot
	ylen_fig= ymulti_all * yfactor		# 整个 Figure 的高度

	rect_1= (xmulti_left/xmulti_all, (ymulti_bot+ymulti_vol)/ymulti_all, length/xmulti_all, ymulti_price/ymulti_all)	# K线图部分
	rect_2= (xmulti_left/xmulti_all, ymulti_bot/ymulti_all, length/xmulti_all, ymulti_vol/ymulti_all)	# 成交量部分

	#	建立 Figure 对象
	#==================================================================================================================================================
	figfacecolor= 'white'
	figedgecolor= 'black'
	figdpi= 600
	figlinewidth= 1.0

	figobj= pyplot.figure(figsize=(xlen_fig, ylen_fig), dpi=figdpi, facecolor=figfacecolor, edgecolor=figedgecolor, linewidth=figlinewidth)	# Figure 对象

	#==================================================================================================================================================
	#==================================================================================================================================================
	#=======	成交量部分
	#==================================================================================================================================================
	#==================================================================================================================================================

	#	添加 Axes 对象
	#==================================================================================================================================================
	axes_2= figobj.add_axes(rect_2, axis_bgcolor='black')
	axes_2.set_axisbelow(True)	# 网格线放在底层

	#	改变坐标线的颜色
	#==================================================================================================================================================
	for child in axes_2.get_children():
		if isinstance(child, matplotlib.spines.Spine):
			child.set_color('lightblue')

	#	得到 X 轴 和 Y 轴 的两个 Axis 对象
	#==================================================================================================================================================
	xaxis_2= axes_2.get_xaxis()
	yaxis_2= axes_2.get_yaxis()

	#	设置两个坐标轴上的 grid
	#==================================================================================================================================================
	xaxis_2.grid(True, 'major', color='0.3', linestyle='solid', linewidth=0.2)
	xaxis_2.grid(True, 'minor', color='0.3', linestyle='dotted', linewidth=0.1)

	yaxis_2.grid(True, 'major', color='0.3', linestyle='solid', linewidth=0.2)
	yaxis_2.grid(True, 'minor', color='0.3', linestyle='dotted', linewidth=0.1)


	#==================================================================================================================================================
	#=======	绘图
	#==================================================================================================================================================
	xindex= numpy.arange(length)	# X 轴上的 index,一个辅助数据

	zipoc= zip(pdata[u'开盘'], pdata[u'收盘'])
	up=   numpy.array( [ True if po < pc and po != None else False for po, pc in zipoc] )		# 标示出该天股价日内上涨的一个序列
	down= numpy.array( [ True if po > pc and po != None else False for po, pc in zipoc] )		# 标示出该天股价日内下跌的一个序列
	side= numpy.array( [ True if po == pc and po != None else False for po, pc in zipoc] )		# 标示出该天股价日内走平的一个序列


	volume= pdata[u'成交量']
	rarray_vol= numpy.array(volume)
	volzeros= numpy.zeros(length)	# 辅助数据

	# XXX: 如果 up/down/side 各项全部为 False,那么 vlines() 会报错。
	if True in up:
		axes_2.vlines(xindex[up], volzeros[up], rarray_vol[up], color='red', linewidth=3.0, label='_nolegend_')
	if True in down:
		axes_2.vlines(xindex[down], volzeros[down], rarray_vol[down], color='green', linewidth=3.0, label='_nolegend_')
	if True in side:
		axes_2.vlines(xindex[side], volzeros[side], rarray_vol[side], color='0.7', linewidth=3.0, label='_nolegend_')


	#	设定 X 轴坐标的范围
	#==================================================================================================================================================
	axes_2.set_xlim(-1, length)


	#	设定 X 轴上的坐标
	#==================================================================================================================================================
	datelist= [ datetime.date(int(ys), int(ms), int(ds)) for ys, ms, ds in [ dstr.split('-') for dstr in pdata[u'日期'] ] ]

	# 确定 X 轴的 MajorLocator
	mdindex= []	# 每个月第一个交易日在所有日期列表中的 index
	years= set([d.year for d in datelist])	# 所有的交易年份

	for y in sorted(years):
		months= set([d.month for d in datelist if d.year == y])		# 当年所有的交易月份
		for m in sorted(months):
			monthday= min([dt for dt in datelist if dt.year==y and dt.month==m])	# 当月的第一个交易日
			mdindex.append(datelist.index(monthday))

	xMajorLocator= FixedLocator(numpy.array(mdindex))

	# 确定 X 轴的 MinorLocator
	wdindex= []	# 每周第一个交易日在所有日期列表中的 index
	for d in datelist:
		if d.weekday() == 0: wdindex.append(datelist.index(d))

	xMinorLocator= FixedLocator(numpy.array(wdindex))

	# 确定 X 轴的 MajorFormatter 和 MinorFormatter
	def x_major_formatter_2(idx, pos=None):
		return datelist[idx].strftime('%Y-%m-%d')

	def x_minor_formatter_2(idx, pos=None):
		return datelist[idx].strftime('%m-%d')

	xMajorFormatter= FuncFormatter(x_major_formatter_2)
	xMinorFormatter= FuncFormatter(x_minor_formatter_2)

	# 设定 X 轴的 Locator 和 Formatter
	xaxis_2.set_major_locator(xMajorLocator)
	xaxis_2.set_major_formatter(xMajorFormatter)

	xaxis_2.set_minor_locator(xMinorLocator)
	xaxis_2.set_minor_formatter(xMinorFormatter)

	# 设定 X 轴主要坐标点与辅助坐标点的样式
	for malabel in axes_2.get_xticklabels(minor=False):
		malabel.set_fontsize(3)
		malabel.set_horizontalalignment('right')
		malabel.set_rotation('30')

	for milabel in axes_2.get_xticklabels(minor=True):
		milabel.set_fontsize(2)
		milabel.set_horizontalalignment('right')
		milabel.set_rotation('30')


	#	设定 Y 轴坐标的范围
	#==================================================================================================================================================
	maxvol= max(volume)	# 注意是 int 类型
	axes_2.set_ylim(0, maxvol)


	#	设定 Y 轴上的坐标
	#==================================================================================================================================================
	vollen= len(str(maxvol))

	yMajorLocator_2= MultipleLocator(10**(vollen-1))
	yMinorLocator_2= MultipleLocator((10**(vollen-2))*5)

	# 确定 Y 轴的 MajorFormatter
	#	def y_major_formatter_2(num, pos=None):
	#		numtable= {'1':u'一', '2':u'二', '3':u'三', '4':u'四', '5':u'五', '6':u'六', '7':u'七', '8':u'八', '9':u'九', }
	#		dimtable= {3:u'百', 4:u'千', 5:u'万', 6:u'十万', 7:u'百万', 8:u'千万', 9:u'亿', 10:u'十亿', 11:u'百亿'}
	#		return numtable[str(num)[0]] + dimtable[vollen] if num != 0 else '0'

	def y_major_formatter_2(num, pos=None):
		return int(num)
	yMajorFormatter_2= FuncFormatter(y_major_formatter_2)

	# 确定 Y 轴的 MinorFormatter
	#	def y_minor_formatter_2(num, pos=None):
	#		return int(num)
	#	yMinorFormatter_2= FuncFormatter(y_minor_formatter_2)
	yMinorFormatter_2= NullFormatter()

	# 设定 X 轴的 Locator 和 Formatter
	yaxis_2.set_major_locator(yMajorLocator_2)
	yaxis_2.set_major_formatter(yMajorFormatter_2)

	yaxis_2.set_minor_locator(yMinorLocator_2)
	yaxis_2.set_minor_formatter(yMinorFormatter_2)

	# 设定 Y 轴主要坐标点与辅助坐标点的样式
	for malab in axes_2.get_yticklabels(minor=False):
		malab.set_fontsize(3)

	for milab in axes_2.get_yticklabels(minor=True):
		milab.set_fontsize(2)


	#==================================================================================================================================================
	#==================================================================================================================================================
	#=======	K 线图部分
	#==================================================================================================================================================
	#==================================================================================================================================================

	#	添加 Axes 对象
	#==================================================================================================================================================
	axes_1= figobj.add_axes(rect_1, axis_bgcolor='black', sharex=axes_2)
	axes_1.set_axisbelow(True)	# 网格线放在底层

	if useexpo:
		axes_1.set_yscale('log', basey=expbase)	# 使用对数坐标

	#	改变坐标线的颜色
	#==================================================================================================================================================
	for child in axes_1.get_children():
		if isinstance(child, matplotlib.spines.Spine):
			child.set_color('lightblue')

	#	得到 X 轴 和 Y 轴 的两个 Axis 对象
	#==================================================================================================================================================
	xaxis_1= axes_1.get_xaxis()
	yaxis_1= axes_1.get_yaxis()

	#	设置两个坐标轴上的 grid
	#==================================================================================================================================================
	xaxis_1.grid(True, 'major', color='0.3', linestyle='solid', linewidth=0.2)
	xaxis_1.grid(True, 'minor', color='0.3', linestyle='dotted', linewidth=0.1)

	yaxis_1.grid(True, 'major', color='0.3', linestyle='solid', linewidth=0.2)
	yaxis_1.grid(True, 'minor', color='0.3', linestyle='dotted', linewidth=0.1)


	#==================================================================================================================================================
	#=======	绘图
	#==================================================================================================================================================

	#	绘制 K 线部分
	#==================================================================================================================================================
	rarray_open= numpy.array(pdata[u'开盘'])
	rarray_close= numpy.array(pdata[u'收盘'])
	rarray_high= numpy.array(pdata[u'最高'])
	rarray_low= numpy.array(pdata[u'最低'])

	# XXX: 如果 up, down, side 里有一个全部为 False 组成,那么 vlines() 会报错。
	if True in up:
		axes_1.vlines(xindex[up], rarray_low[up], rarray_high[up], color='red', linewidth=0.6, label='_nolegend_')
		axes_1.vlines(xindex[up], rarray_open[up], rarray_close[up], color='red', linewidth=3.0, label='_nolegend_')
	if True in down:
		axes_1.vlines(xindex[down], rarray_low[down], rarray_high[down], color='green', linewidth=0.6, label='_nolegend_')
		axes_1.vlines(xindex[down], rarray_open[down], rarray_close[down], color='green', linewidth=3.0, label='_nolegend_')
	if True in side:
		axes_1.vlines(xindex[side], rarray_low[side], rarray_high[side], color='0.7', linewidth=0.6, label='_nolegend_')
		axes_1.vlines(xindex[side], rarray_open[side], rarray_close[side], color='0.7', linewidth=3.0, label='_nolegend_')

	#	绘制均线部分
	#==================================================================================================================================================
	rarray_1dayave= numpy.array(pdata[u'1日权均'])
	rarray_5dayave= numpy.array(pdata[u'5日均'])
	rarray_30dayave= numpy.array(pdata[u'30日均'])

	axes_1.plot(xindex, rarray_1dayave, 'o-', color='white', linewidth=0.1, markersize=0.7, markeredgecolor='white', markeredgewidth=0.1)	# 1日加权均线
	axes_1.plot(xindex, rarray_5dayave, 'o-', color='yellow', linewidth=0.1, markersize=0.7, markeredgecolor='yellow', markeredgewidth=0.1)	# 5日均线
	axes_1.plot(xindex, rarray_30dayave, 'o-', color='green', linewidth=0.1, markersize=0.7, markeredgecolor='green', markeredgewidth=0.1)	# 30日均线

	#	设定 X 轴坐标的范围
	#==================================================================================================================================================
	axes_1.set_xlim(-1, length)


	#	先设置 label 位置,再将 X 轴上的坐标设为不可见。因为与 成交量子图 共用 X 轴
	#==================================================================================================================================================

	# 设定 X 轴的 Locator 和 Formatter
	xaxis_1.set_major_locator(xMajorLocator)
	xaxis_1.set_major_formatter(xMajorFormatter)

	xaxis_1.set_minor_locator(xMinorLocator)
	xaxis_1.set_minor_formatter(xMinorFormatter)

	# 将 X 轴上的坐标设为不可见。
	for malab in axes_1.get_xticklabels(minor=False):
		malab.set_visible(False)

	for milab in axes_1.get_xticklabels(minor=True):
		milab.set_visible(False)

	# 用这一段效果也一样
	#	pyplot.setp(axes_1.get_xticklabels(minor=False), visible=False)
	#	pyplot.setp(axes_1.get_xticklabels(minor=True), visible=False)


	#	设定 Y 轴坐标的范围
	#==================================================================================================================================================
	axes_1.set_ylim(ylowlim_price, yhighlim_price)


	#	设定 Y 轴上的坐标
	#==================================================================================================================================================

	if useexpo:
		#	主要坐标点
		#-----------------------------------------------------
		yMajorLocator_1= LogLocator(base=expbase)

		yMajorFormatter_1= NullFormatter()

		# 设定 X 轴的 Locator 和 Formatter
		yaxis_1.set_major_locator(yMajorLocator_1)
		yaxis_1.set_major_formatter(yMajorFormatter_1)

		# 设定 Y 轴主要坐标点与辅助坐标点的样式
		#	for mal in axes_1.get_yticklabels(minor=False):
		#		mal.set_fontsize(3)

		#	辅助坐标点
		#-----------------------------------------------------
		minorticks= range(int(ylowlim_price), int(yhighlim_price)+1, 100)

		yMinorLocator_1= FixedLocator(numpy.array(minorticks))

		# 确定 Y 轴的 MinorFormatter
		def y_minor_formatter_1(num, pos=None):
			return str(num/100.0) + '0'

		yMinorFormatter_1= FuncFormatter(y_minor_formatter_1)

		# 设定 X 轴的 Locator 和 Formatter
		yaxis_1.set_minor_locator(yMinorLocator_1)
		yaxis_1.set_minor_formatter(yMinorFormatter_1)

		# 设定 Y 轴主要坐标点与辅助坐标点的样式
		for mil in axes_1.get_yticklabels(minor=True):
			mil.set_fontsize(3)

	else:	# 如果使用线性坐标,那么只标主要坐标点
		yMajorLocator_1= MultipleLocator(100)

		def y_major_formatter_1(num, pos=None):
			return str(num/100.0) + '0'

		yMajorFormatter_1= FuncFormatter(y_major_formatter_1)

		# 设定 Y 轴的 Locator 和 Formatter
		yaxis_1.set_major_locator(yMajorLocator_1)
		yaxis_1.set_major_formatter(yMajorFormatter_1)

		# 设定 Y 轴主要坐标点与辅助坐标点的样式
		for mal in axes_1.get_yticklabels(minor=False):
			mal.set_fontsize(3)


	#	保存图片
	#==================================================================================================================================================
	figobj.savefig(figpath, dpi=figdpi, facecolor=figfacecolor, edgecolor=figedgecolor, linewidth=figlinewidth)


if __name__ == '__main__':
	Plot(pfile=sys.argv[1], figpath=sys.argv[2], useexpo=True)
用 Python / Matplotlib 画出来的股票 K线图
---- 过年后开始真正学用 Matplotlib 画一些实际的图形,以下是最新的改进结果:
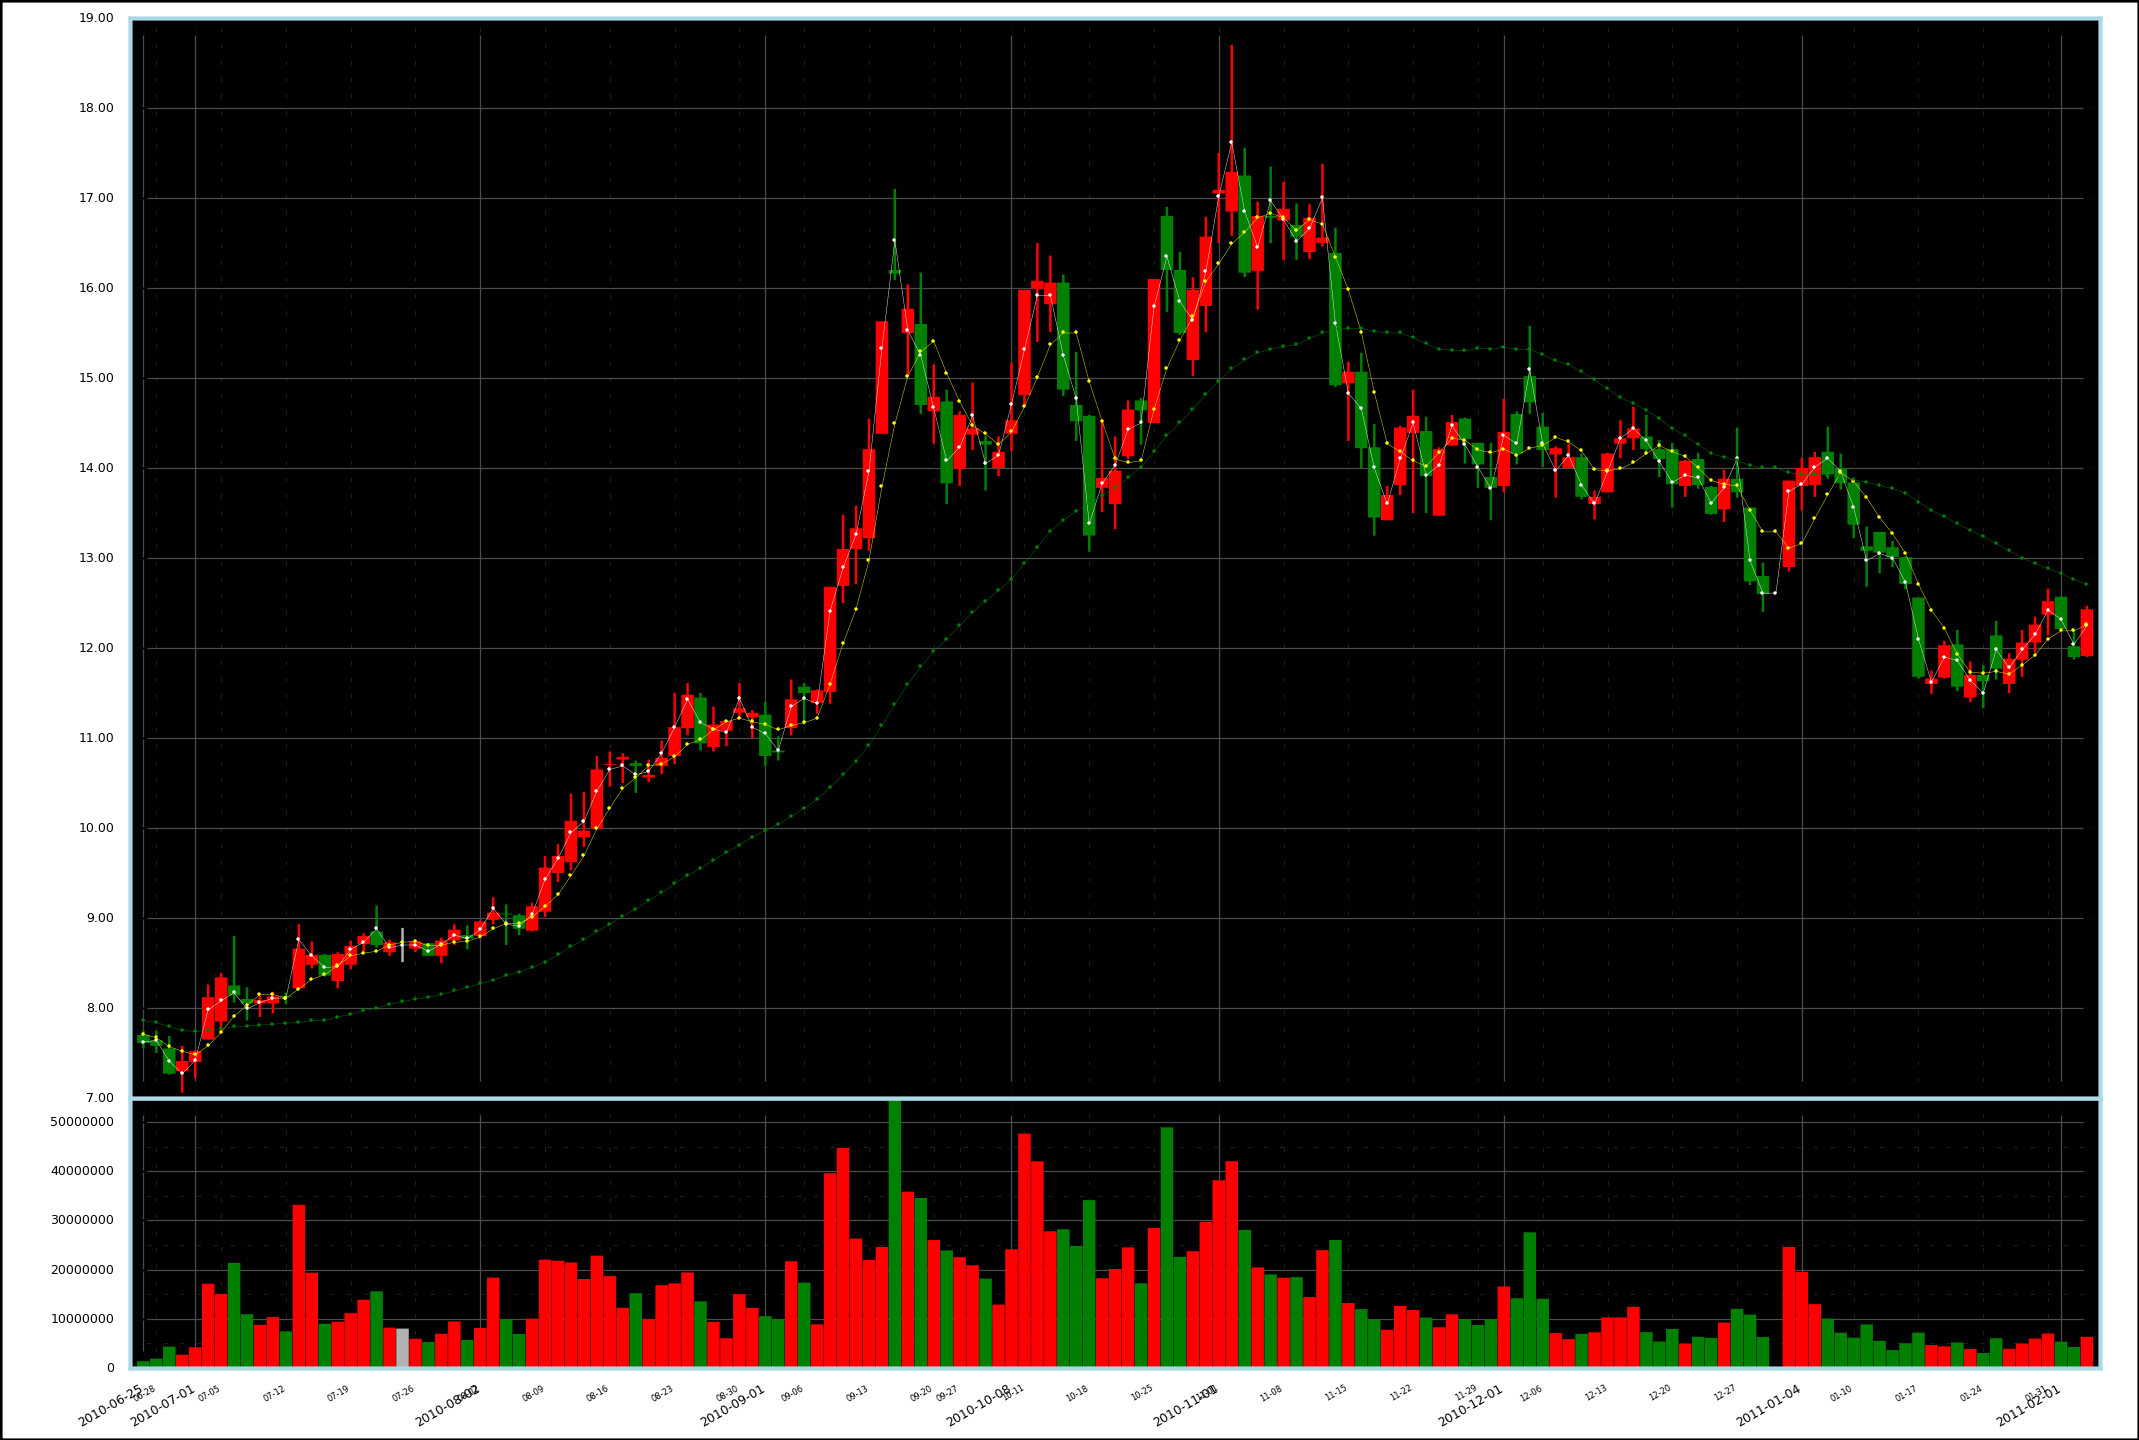
---- 股票是 600644,原始数据来自网络。就不总结要点了,Matplotlib 十分给力!
---- 下一步打算在标示价格的 Y 轴上使用对数坐标。得精确计算图片的尺寸,使代表相同涨幅的图线看起来具有相同的长度,而且要精确定位坐标点。另外还可以加上一定的注释和图例。
补记:已实现,如下图,注意 Y 轴对数坐标: