Jacky Liu's Blog
自动交易模式
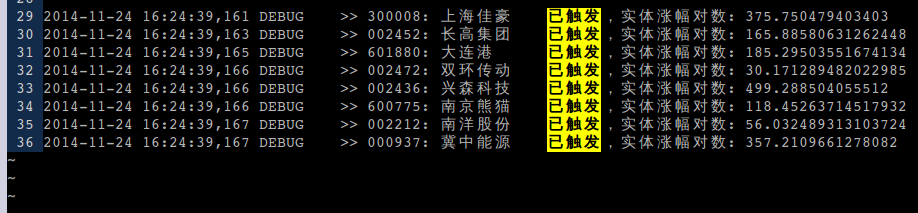
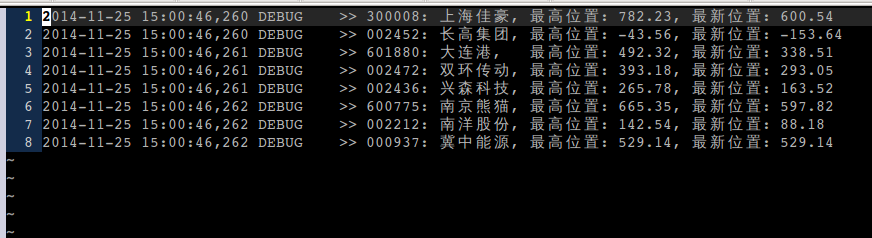
---- 收盘!昨天开始试验 自动交易模式,条件触发模拟买入了 8 只。以 200.0(对数,大约 2%)作为盈利门槛的话,今天 6 只盈利,1 只平盘,1 只亏损。嗯。
---- 昨天的记录:
---- 今天的脚本:

---- 今天的结果:
---- 模拟亏损的那一只:
.png)
基于 gvim 的股票操作界面
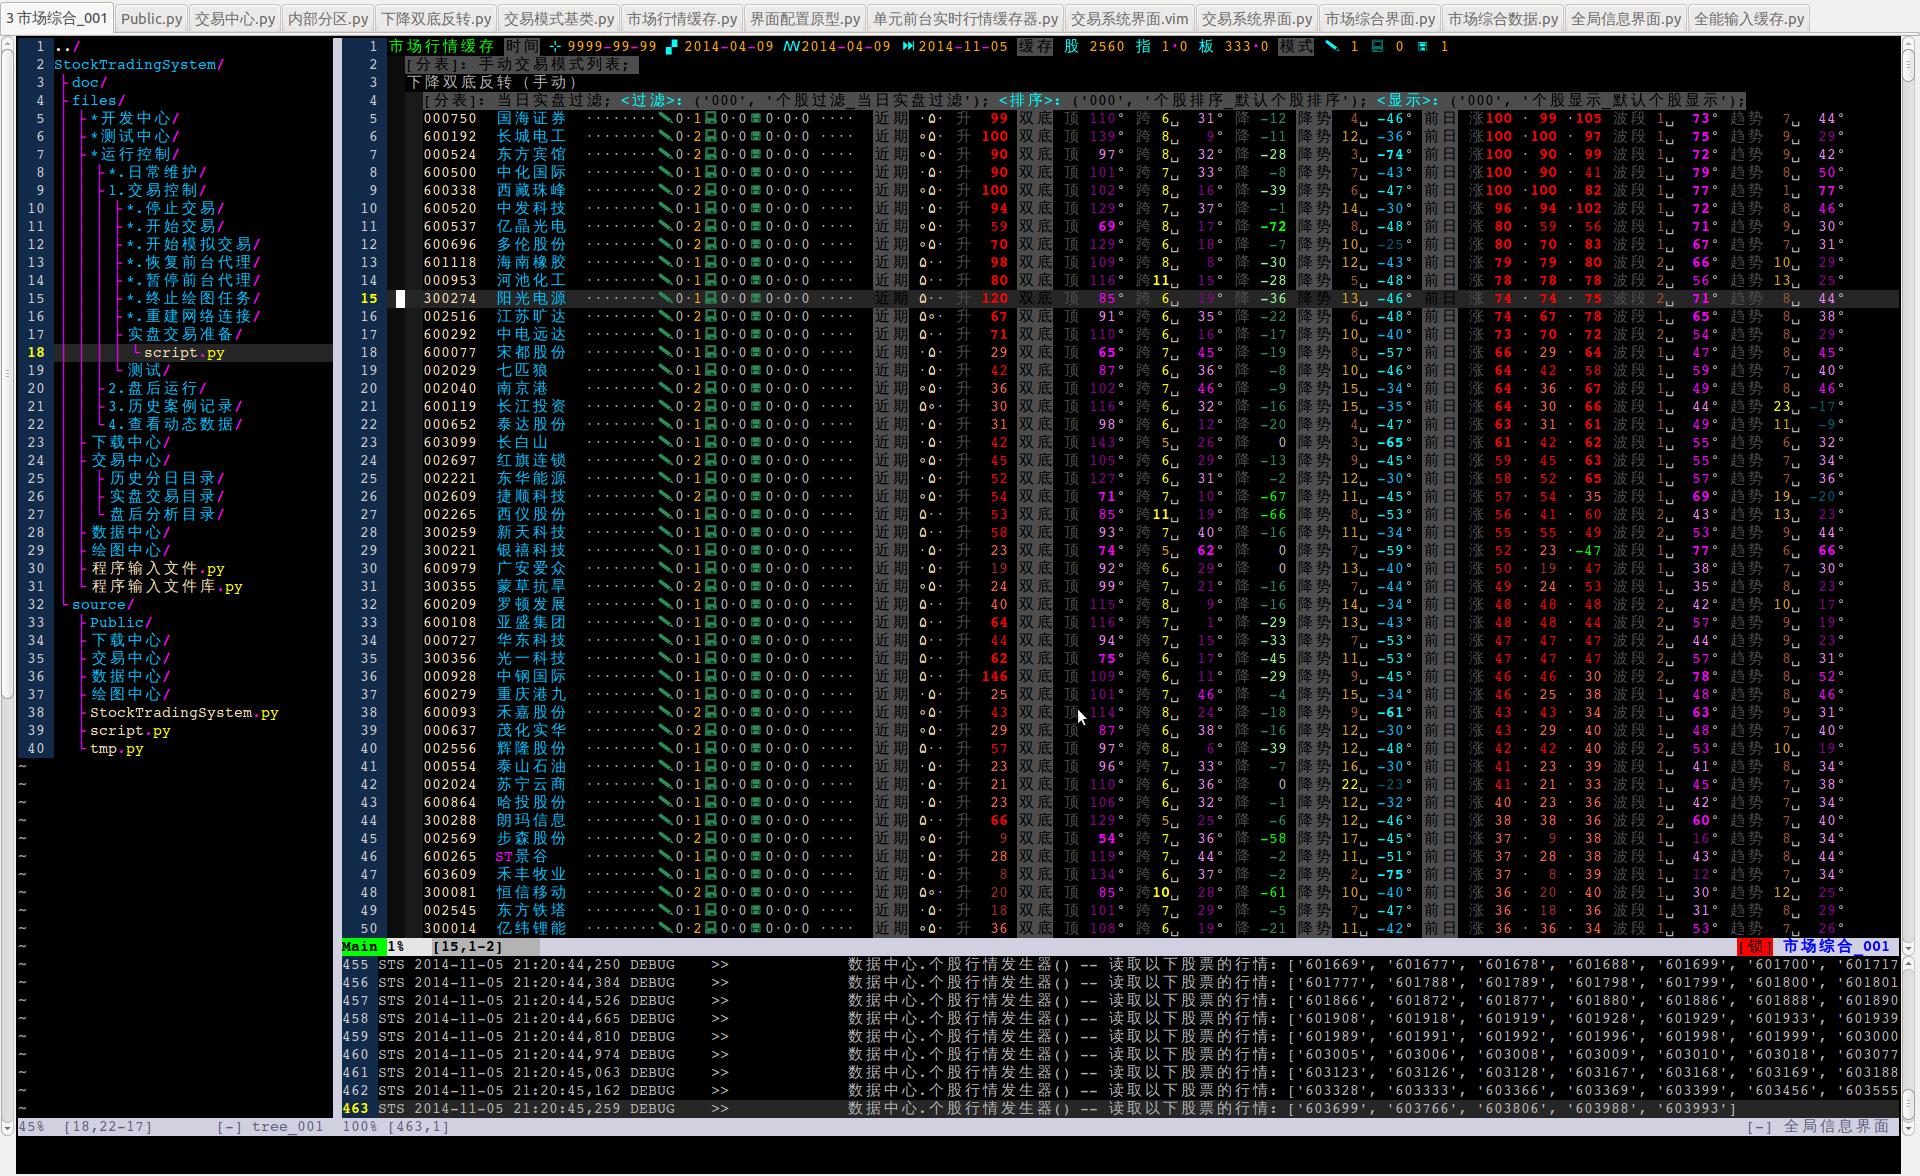
---- 自己开发的基于 gvim 的股票操作界面。截图没开实盘,内容不具有实际操作意义,只做演示用。此文只谈界面设计,而且最终无可避免地回归到恶俗的主题—— Vim 的高端和我对它的钟爱上面来。
---- 基本显示形式就是图中那样,3 个窗口就够了。Vim 的任意一个窗口都可以加载任何一个缓冲区,所以 3 个窗口可以显示非常非常多的内容。左下两个辅助窗口的大小用自动命令的方式控制,光标进入时自动增大,离开时自动缩小。在窗口中切换缓冲区有一套自定义的按键。
---- 左边窗口显示的是 分析交易系统 的文件结构,背后的插件是 文件浏览器 插件。它并不只是显示文件结构这么简单,还可以跟 分析交易系统 配合,执行自定义的操作。对 股票分析交易系统 来讲,最常用的操作都定义成了 Vim 命令,比如 :Run :Quit :Update :Backup 这些。更多的操作都是预先写好的 python 脚本,以文件的形式显示在左边。需要执行的时候,只要在相应的脚本或目录名上按 \e 按键,这是更加灵活的方式。如果需要某个新功能或新操作,只要再写个 python 脚本,写好以后 \e 执行就可以了。
因为所有的插件都是自己写的,它们有共同的插件管理器,也有一套内部传送信号的定义。按 \e 按键的时候,文件浏览插件 就会把文件路径这些参数交给 分析交易系统 去加载执行。自写自用插件可以避免一些通用插件固有的问题,比如自定义命令过长(怕跟其它插件重复),插件之间无法配合,还有莫名其妙的冲突问题。插件之间冲突是 Vim 的痼疾,因为 Vim 的资源(窗口、缓冲区、系统选项、寄存器 ...)都是公有的,任意一个插件都可以动。虽然有经验的插件作者会有意避免,但是对于安装了许多插件的用户来说,冲突现象一定不陌生。
---- 中间最大的窗口是主窗口,用来显示 市场综合界面。可以建立多个 市场综合界面,用来显示不同内容,比如实盘时用来显示不同交易模式下属的符合条件的个股。不同综合界面之间可以通过自定义按键切换。
---- 市场综合界面 里用界面条目作为基本的显示单位,每一个界面条目对应一个后台数据结构,比如 个股、板块、交易模式 等等。界面条目之间有上下级关系,符合树状的体系结构。根节点是 市场行情缓存,它的下级数据分成几大类:
第一类是不同市场对象,有 个股、指数、板块;
第二类是自己定义的交易模式,分成 手动模式、自动模式、盘后开发模式。除了交易模式之外,还有 全局监控模式。交易模式 和 市场对象(个股)相互作用,符合匹配条件时会产生以个股代码和时间点为标志的 综合分析记录,分析记录在界面中会作为相应个股或交易模式的下级。
全局监控模式 目前有三种,实现在分析交易过程中需要的不同功能:
持仓模式,用来记录已持仓的个股,对持仓和资金情况进行统计,也负责仓位和资金管理;
关注模式,用来记录和管理手动设置的关注目标,便于后续操作。
预设指令模式,用来记录预设的条件交易指令,条件符合时自动执行。
第三类是一些比较复杂又专门的功能,在程序里单独作为一个组件,比如 历史分时交易模拟缓存器。分时模拟交易 是个不可缺少的功能,每种交易模式在投入实际运用之前,都需要用历史分时数据进行模拟交易,检验模式的成效。模拟过程会产生 分时模拟交易记录,这些模拟交易记录既不从属于个股也不从属于交易模式,而是从属于一个预设条件(比如可用资金多少)限制下的模拟过程,这些都需要一个专门的对象(分时交易模拟缓存器)来记录和管理。分时交易模拟缓存器也是 市场行情缓存 的下级。
---- 市场综合界面 中的数据条目有一些基本操作,可以展开(显示下级列表)、合上。下级列表由多个分列表组成,一个界面条目可以对应多种下级总列表,比如 市场行情缓存 展开后,可以显示市场全部个股,也可以显示全部交易模式。每个分表有自己独立的 成员过滤、排序、显示 定义,通过在分表标题的不同位置按 < 或 > 键,可以切换不同的过滤、排序、显示方式。比如一个交易模式下面当日符合条件的个股,可以按最新的收盘涨幅排序,也可以按开盘涨幅或最低涨幅排序,也可以按相关模式专门定义的特有指标排序。每种排序方式都可提供不同的关注角度,帮助快速找到值得关注的目标。
这里要补充一下,股票与其它品种(比如期货)相比,最大的好处是个股数量多,有几千个可选。即使在坏的市道下,也不难找到好的个股。但是要利用这种好处需要专门的技术,包括盘后基于日线行情的分析提取,更重要的是实盘时的监控。对一只个股来说,整个交易日之内价位合适的操作窗口可能只有几分钟而已。如果做不到对所有个股的监控和及时的反应,就很难达到预期操作目标。上面这些设计,都是为了强化实盘时的监控和反应速度。在不同的排序方式、过滤方式之间进行切换基本不需要时间。另外,自定义颜色也是一个很大的帮助,像图里显示的那样,让颜色的深浅来反映指标值的大小,这个后面细说。
以上所有这些,下级列表的内容,以及过滤、排序、显示方式,都用动态配置数据来控制,下面是动态配置数据和其中一个过滤函数的定义。
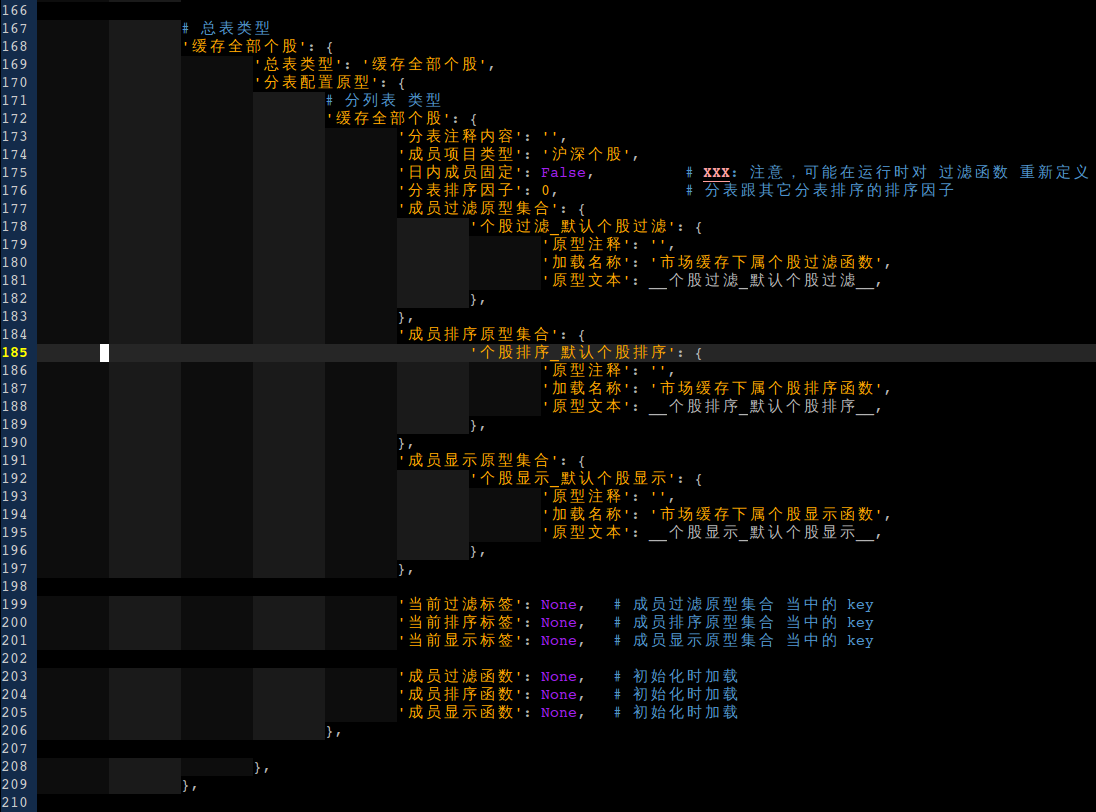
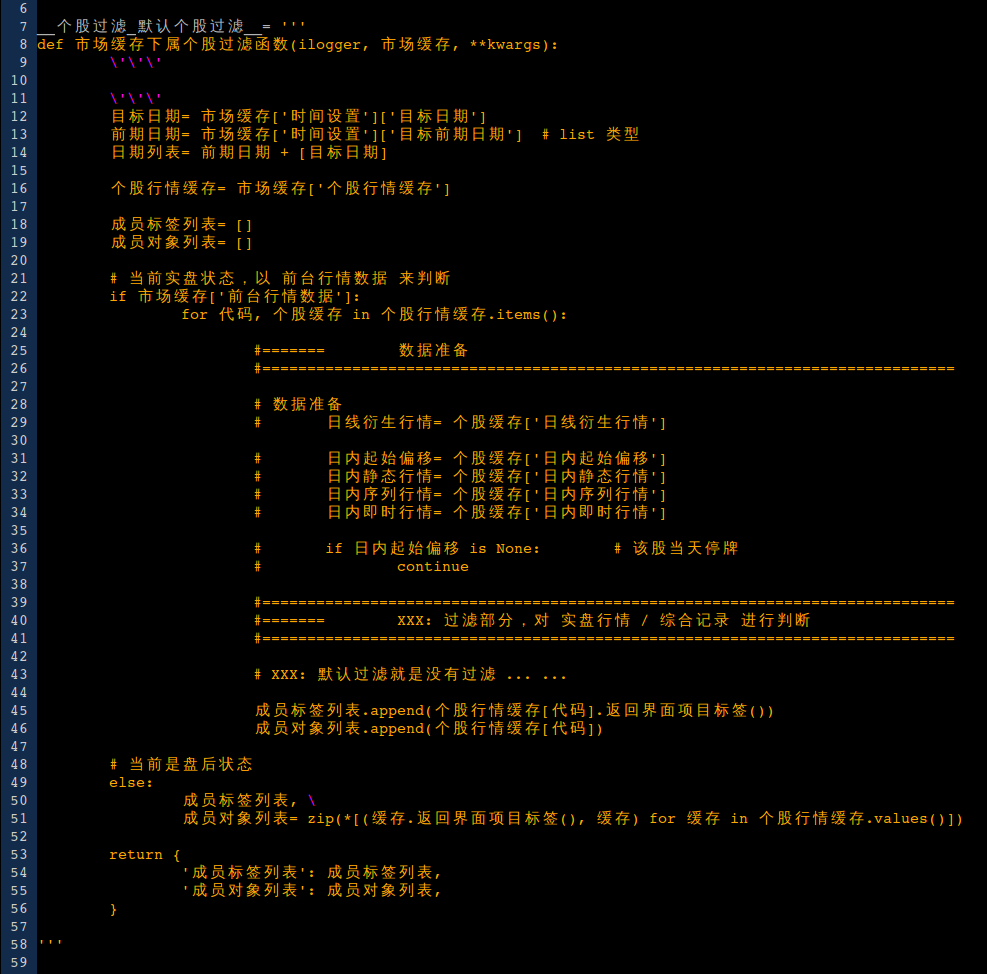
注意这些函数都是定义成文本的,因为它们需要在运行的时候动态加载。如果预设的 过滤、排序、显示 方式还是不能满足需求,可以在运行时通过修改这些文本来更改函数定义(通过底部辅助窗口执行),然后动态加载新的定义,结果会立即在 市场综合界面 里反映出来。
---- 回到前面的话题,在 市场综合界面 里,对于不同类型的条目还有专门的操作,比如对个股,可以在底部窗口显示它的 F10 信息,也可以绘制它的最新图形,也可以发出交易指令。这些操作都透过自定义按键来做。
---- 总之,市场综合界面 是最重要的一个界面。除了实盘时显示当天需要关注的个股以外,也可以在盘后运行,把目标日期设成历史日期,作为人工交易的操盘练习,或者作为交易模式的比较直观的验证。
---- 最后,是底部的辅助窗口,这个窗口对应多个缓存,每个缓存显示不同内容,缓存之间也是通过自定义按键切换:
*. 运行记录缓存,相当于 stdout,显示 分析交易系统 运行时的 logging 输出。
*. 全能输入缓存,用来在运行时输入 python 代码,然后动态加载执行。除了上面说的修改函数定义之外,还可以执行其它操作,比如输入比较复杂的预设交易指令,设置自动执行的条件参数,等等。代码文本都是预先写好的,多数情况下只需要把参数改成想要的值。
*. 实盘记录缓存,在实盘运行时显示重要的提示信息,比如某只个股达到了交易模式的匹配条件,某只已持仓个股达到了卖出条件,等等。不同类型的信息用不同颜色显示,重要的信息会搭配声音提示。目前还没试过怎样让 python 播放音频,不过对 python 来讲应该不是问题。
*. 全局信息缓存,用来显示数据对象的各种详细信息,比如个股的 F10 信息,或者程序运行时的状态,也用自定义按键触发。
---- Vim 为何适合做其它程序的界面?因为它有几个关键特性:
*. 界面的作用就是输入跟输出。对输入来说,Vim 有自定义按键和命令。命令可以带参数,按键还可以针对界面中不同的位置做不同处理。对输出来说,Vim 里有标签页、窗口,一个窗口可以对应多个 Vim 缓冲区,一个 Vim 缓冲区还可以对应多个后台数据缓存。总之,窗口不必开很多,但显示内容可以很丰富。
*. 可以根据内容的文法自定义内容的显示颜色,对 gvim 来说,可用的颜色数量丰富(与 html 相同)。抛开后台自定义的交易模式不谈,单这一点就是极大的好处。前面说过,对股票交易来说,全盘的监控、分析提取,以及条件符合时及时操作是关键。有了界面颜色的帮助,不需要专业训练的眼睛就可以在一大堆数据中迅速辨认出最值得关注的目标。文法匹配的定义可以很细致,比如说,同样是角度,结构顶角和趋势升角的含义就是不同的,对时间长度来说,波段长度和趋势长度含义也不同,它们都有不同的颜色定义。相比之下,一般的股软只是上涨用红色,下跌用绿色而已。
*. Vim 可以用 Python 语言进行扩展。而对于 Python 来讲,基本上想要什么功能都有。可以通过网络特性跟局域网内的系统前台交换数据,接收前台的实时行情并且发送交易指令,可以用 matplotlib 绘图,可以调用图片浏览器查看,还可以装一个 Selenium 接口,通过 Selenium 控制网络浏览器来玩微操盘,或者把 Vim 里编辑的内容通过一个自定义按键发上博客(这两个只是设想,没做)。当然 matplotlib 速度有点问题,以后可能会用 pyqt 来做一个绘图引擎,真正做到动态实时绘图,而且可以在图形上直接进行操作。
---- 以上就是 Vim 作为 UI 可以做到的事情。实际上,我已经把 分析交易系统 整个都改写成一个 Vim 插件了(原本是独立进程,通过 IPC 与 Vim 界面传递数据)。这样就节省掉了在进程间传递数据的种种麻烦,也因为如此,Vim 能做的事情更加广泛。比如在运行时,可以显示系统内部任何一个数据结构当前的值,因为整个系统已经成了一个 Vim 插件,它所有的部分 Vim 都看得到。这样用下来,并没有发现什么问题,效果很好。
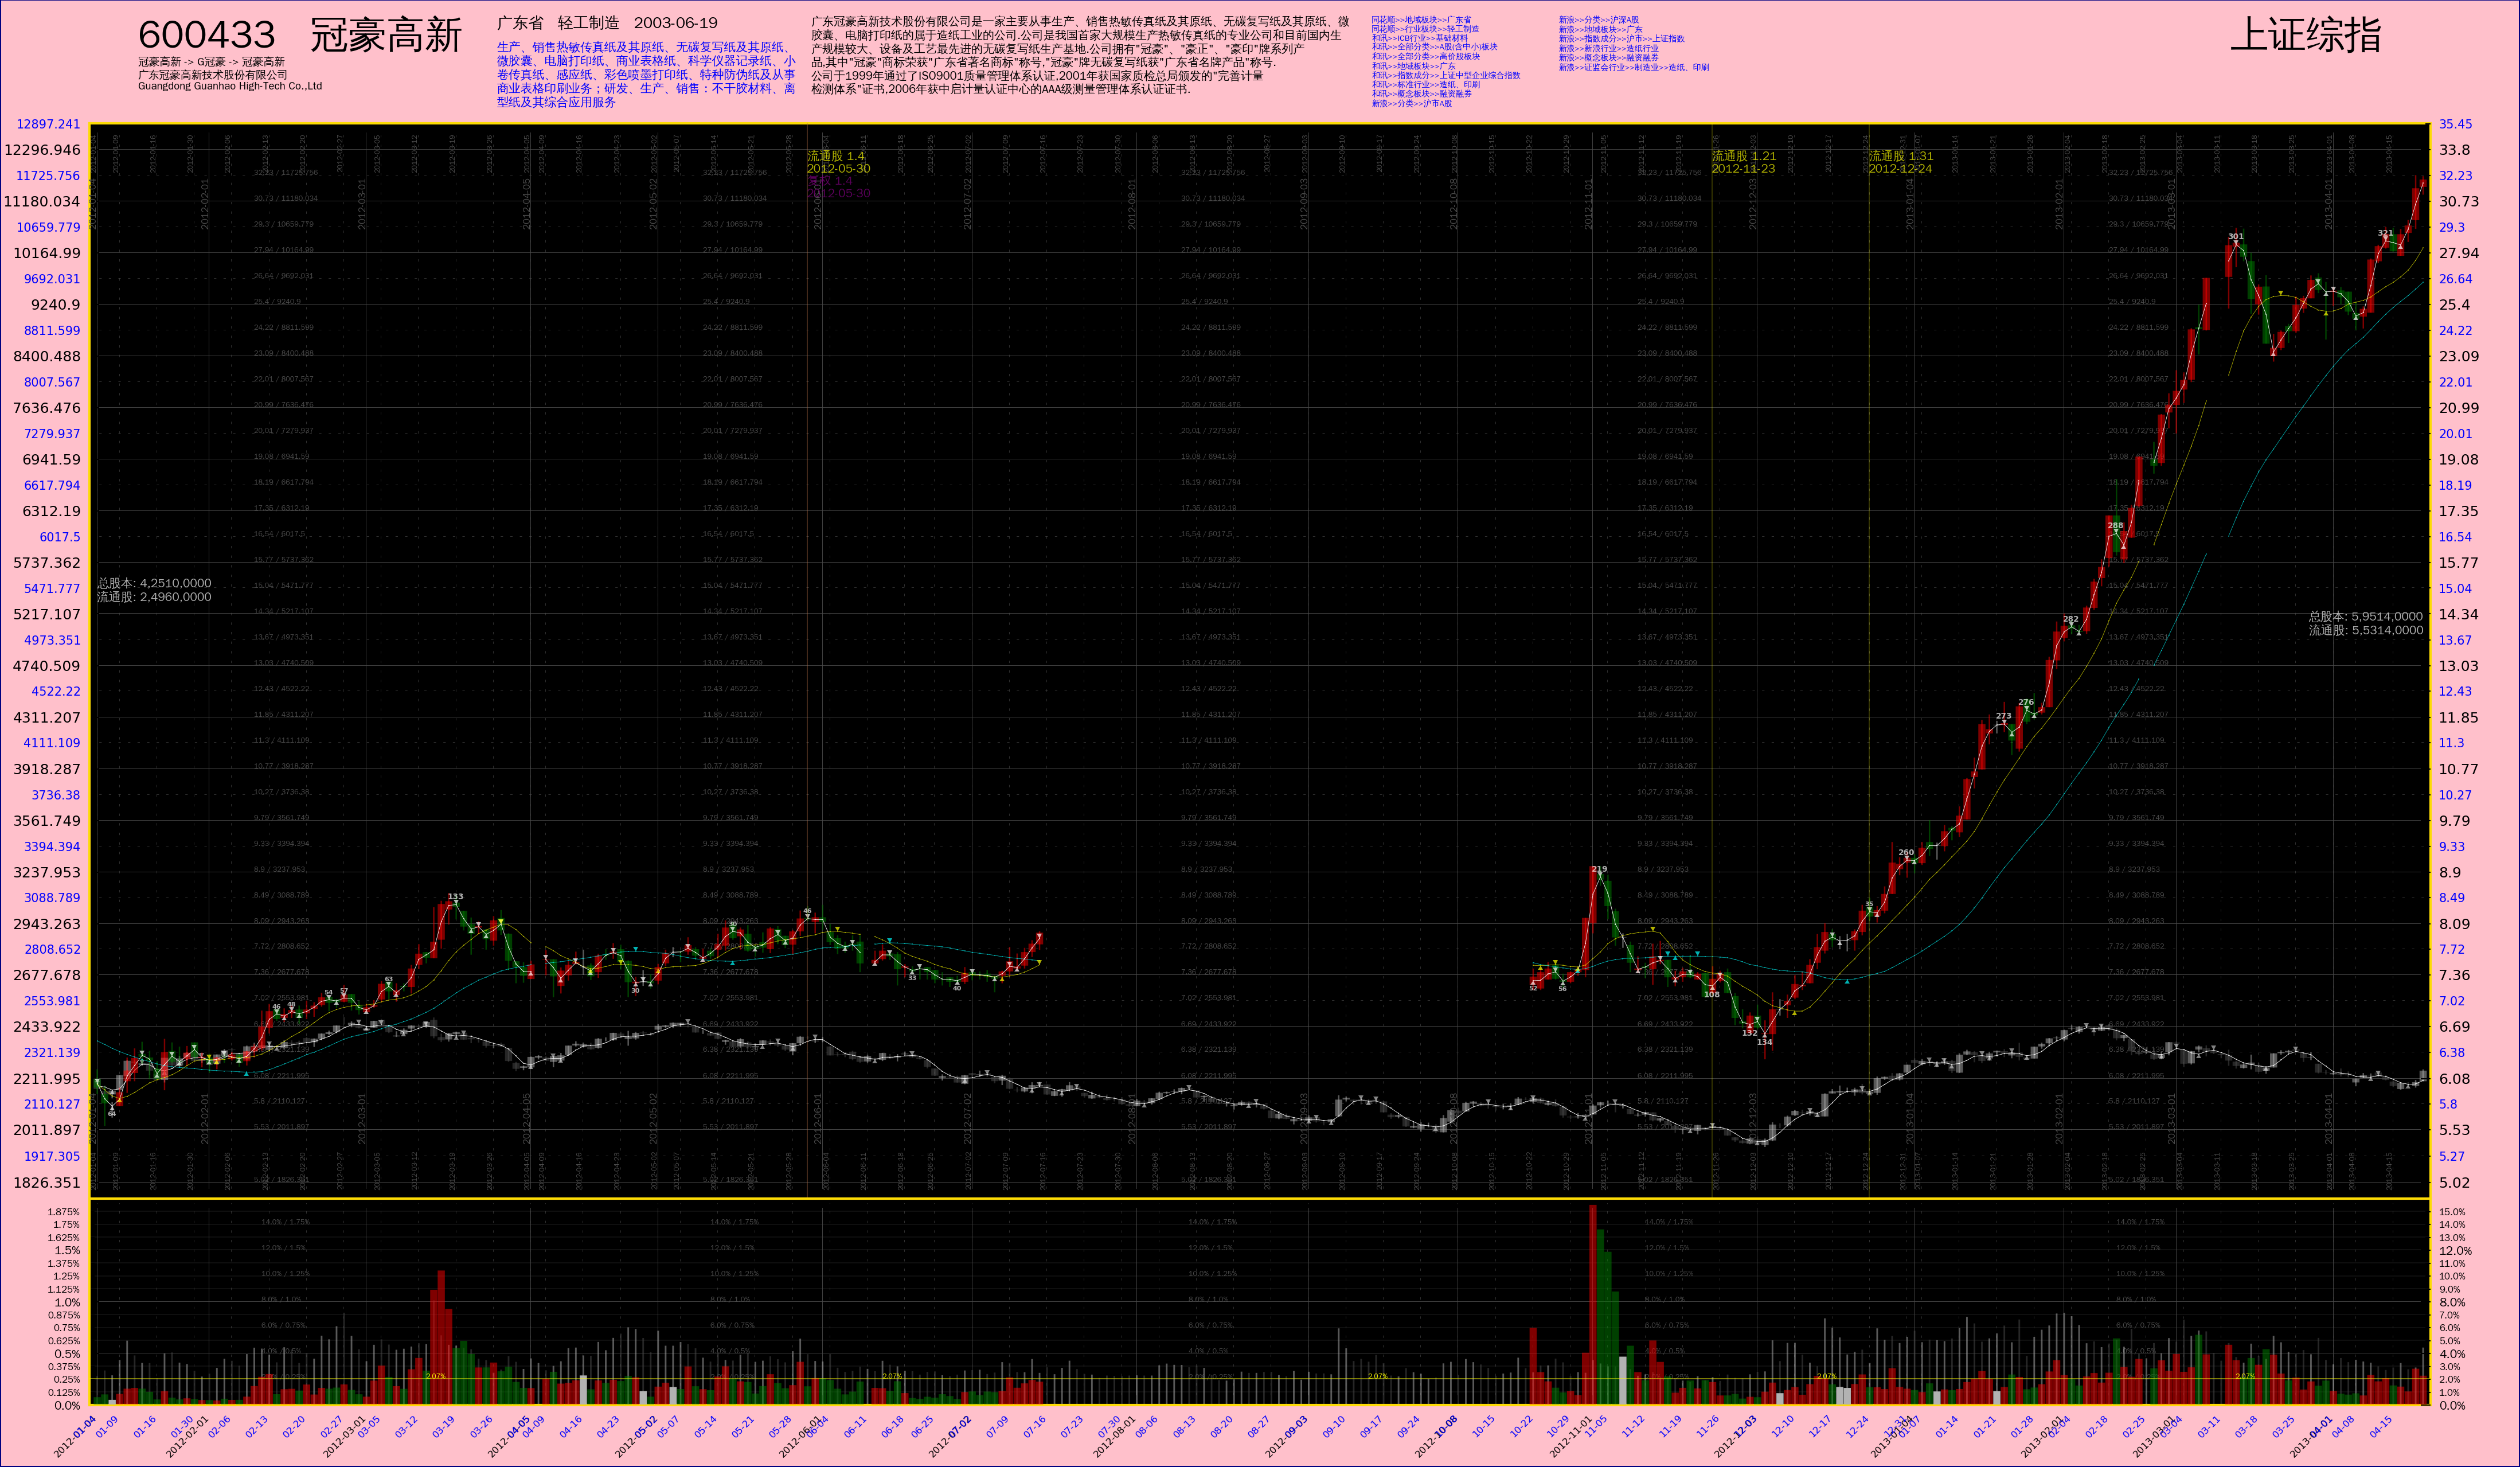
冠豪高新 幕后人物的经验之谈
---- 微博上偶然看见的,据说前一阵子的 冠豪高新 背后是个叫 林广茂 的人,而股价上演那样疯狂的行情是因为受到了政策加持,被定为 “融资融券” 的标的。因为自己一直专注技术,对 内幕、主力 之类的信息并不关心,看见了才知原来如此。虽然这家公司名字里有个 “高新”,但这就像我把我家的厕所评为五星级豪华厕所一样,实际上它只是个生产打印纸的企业。
---- 其实这些都无所谓。理工科出身,从技术入手,在目前的投资起步阶段,还是坚持 “价格涵盖一切” 的思路。技术之外当然有东西,还有很多,但是得先把技术弄透了再说。我更感兴趣的是下面这段据说是林的经验之谈,@中国对冲基金 整理的。虽说是二手的,也没关系。对这种大而化之的东西,读起来也是相由心生,我思故我在。别人究竟讲的什么不重要,重要的是你读到了什么,只要感觉能够融会就好。

---- 按照我的理解,他所说的投资方法的发展分以下几个阶段。
1. 对 “术” 的掌握。文里说的这个 “术”,在我看来就是基本功。每个领域里都有这样的基本功,对服装设计师来说就是纳针脚、画图样,对画家来说就是构图、笔法,对写手来说就是遣词造句。在投资分析里面,就是知道面对一个市场情势时从哪些角度去分析它,趋势怎样?微观怎样?区间怎样?能量怎样?几个量一有,心中就有了底,而不会像一个外行一样,面对图形时脑中纷繁复杂,千头万绪,把头一转开又是一片空白,什么也不剩下。
2. 掌握了 “术” 以后,再把它 “拆分开”。这个说法有点绕,或者可以说 “把厚书再读薄”,或者 “见山又是山,见水又是水”。讲具体点,是指去繁就简,抓住实质。投资分析的指标有成百上千种,实际用的时候要所偏重。不光是偏重最能反映实质的那些,可能更重要的是偏重你最熟悉、用起来最顺手的那些。
---- 过了这个阶段,就已经解决赚不赚钱的问题了。接下来就是发展路线问题。投资到了一定阶段会遇到瓶颈,原有的投资方法不能支撑更大的资金规模,收益率会下降。往下怎么发展,文中给出两条路。第一是 “求快”,也就是仍然坚持原来的分析和交易手段,把大资金拆成小资金操作,加快交易频度,通过追踪更多的机会来支撑更多的资金。第二种,文中叫做 “取势”,其实也就是往中长线发展。操作目标仍然相对集中,通过加大操作周期,博取更高的单次收益来支撑更大资金量。
---- 至于文中最后说的 “钟摆” 什么的,我能明白什么意思,但没法体会了。毕竟现在这个段位差太远了。
---- 网上另有关于主角事迹的报道,从这些报道看,主角自己显然是选择了文中所说的第二条路。报道中说主角曾经连续两年多追踪一个期货品种,结果 卟啦卟啦卟啦 。。。你们都知道的。
---- 而像我这样的要是以后也真到了这个阶段,自然会选第一条路,我还是要依赖我的 Vim 跟 Python :)
趋势线
---- 有句话怎么说来着,“只有趋势才是你的朋友”。
---- 对任意一点可以辨认它所处的趋势。算法保证如果 A 点和 B 点的趋势起点都在 O,那么 A、B 之间任意一点的趋势起点也在 O 点。
用 Python / Matplotlib 画出来的股票 K线图 (四)
---- 前一篇在这: 用 Python / Matplotlib 画出来的股票 K线图 (三)
---- 日线与分时对比行情:

---- 下面是绘图脚本与绘图数据合在一起的压缩文件。注意:
1. 是 py3 脚本,matplotlib 已经支持 py3。绝大部分都是中文写的,不想被英文虐出翔了。
2. 是 Linux 下写的,需要在 Linux 下执行。先解压,然后到生成的目录下执行:
python3 绘图.py
就可以了。会生成一个 绘图.log 文件和一个图片文件放在相同目录下。
<补记>:已经证实经过很小的改动就可以在 windows 下运行,输出中文字内容的大小样式有区别,其它一样,得益于 python 和 matplotlib 的跨平台特性。但是我不知道具体改哪些。
---- 解压后的文件结构:
日线分时对比行情/
├Public/
│├Public.py
│└__init__.py
├子图定义/
│├__init__.py
│├公司信息子图.py
│├分时价格子图.py
│├分时手数子图.py
│├实盘价格子图.py
│├实盘手数子图.py
│├日线价格子图.py
│└日线换手子图.py
├绘图.py
└绘图数据.pickle
---- 关于授权:除了特别说明的以外,本博客里的代码都用 “干啥随你便” 协议进行授权。
Unless otherwise noted, all code pieces in this blog are licensed under the "DWYW(Do What the f Whatever You Want)" agreement. Good luck.
---- Download
尼玛的 冠豪高新
---- 有时看看某些 A 股的走势,你会觉得如此变态,如此不可理喻。人生充满机会,成功只要放手一搏,煞笔也能赚钱,不赚的都是煞笔,都尼玛这样了不富还有天理吗啊啊啊啊啊啊啊啊 ~
---- 可是明知精彩每天都在上演,我这种闷骚又有完美主义强迫症的苦逼却还在埋头调试交易模式,这简直跟坐怀不乱差不多。我觉得我有看破红尘的潜质,只差有人来点化了。
---- 一个美股交易员朋友说,虽然美股是 T+0 规则而且没有涨跌停限制,但美股的波动远没有 A 股这么变态。
---- 南辕北辙,欲速不达。投资与投机,股市与陷阱,公有与私有,中国梦与箩筐套鸟,摸石头过河与脱裤子放屁,都是羊头与狗肉而已。
用 Python / Matplotlib 画出来的股票 K线图 (三)
---- 前一篇在这: 用 Python / Matplotlib 画出来的股票 K线图 (二)
---- 后一篇在这: 用 Python / Matplotlib 画出来的股票 K线图 (四)
---- 就像上回说的,新内容加进来。除此之外,与上一版代码相比最大的改动就是内部重构过,子图全部定义成 class。图中一共包含 5 个子图,从上到下依次是: 基本信息(就是那些文字)、历史价格、历史换手率、价格、换手率。通过输入的绘图数据进行控制,任何一个子图都可以关闭,关闭子图可以节省绘图时间和存储空间。本来还有一个财务信息子图要加进去,但是现在想暂时告一段落,先弄点其它的。
---- 作为输入的 Python pickle file 在 这里。
---- 最后是脚本,仍然是 Python 2 的:
# -*- coding: utf-8 -*-
import os
import sys
import pickle
import math
import datetime
import itertools
import matplotlib
matplotlib.use("WXAgg", warn=True) # 这个要紧跟在 import matplotlib 之后,而且必须安装了 wxpython 2.8 才行。
import matplotlib.pyplot as pyplot
import matplotlib.font_manager as font_manager
import numpy
from matplotlib.ticker import NullLocator, FixedLocator, MultipleLocator, FuncFormatter, NullFormatter
from matplotlib.patches import Ellipse
__font_properties__= font_manager.FontProperties(fname='/usr/share/fonts/truetype/wqy/wqy-zenhei.ttc')
__color_lightsalmon__= '#ffa07a'
__color_pink__= '#ffc0cb'
__color_navy__= '#000080'
__color_gold__= '#FDDB05'
__color_gray30__= '0.3'
__color_gray70__= '0.7'
__color_lightblue__= 'lightblue'
__shrink__= 1.0 / 4
__expbase__= 1.1
class SubPlot_BasicInfo:
'''
公司的基本信息
Note: this is not "real" subplot, no Axes object contained.
'''
def __init__(self, pdata, parent, name):
self._name= name
self._pdata= pdata
self._cominfo= self._pdata[u'公司信息']
self._parent= parent
self._Axes= None
self._xsize, \
self._ysize= self._compute_size()
def _compute_size(self):
return (300.0, 1.8)
def get_size(self):
return (self._xsize, self._ysize)
def build_axes(self, figobj, rect):
axes= figobj.add_axes(rect)
axes.set_frame_on(False)
self._Axes= axes
self.set_xticks()
self.set_yticks()
def set_xticks(self):
axes= self._Axes
xaxis= axes.get_xaxis()
# 设定 X 轴坐标的范围
#==================================================================================================================================================
axes.set_xlim(0, self._xsize)
xaxis.set_major_locator(NullLocator())
for mal in axes.get_xticklabels(minor=False):
mal.set_visible(False)
for mil in axes.get_xticklabels(minor=True):
mil.set_visible(False)
def set_yticks(self):
axes= self._Axes
yaxis= axes.get_yaxis()
# 设定 X 轴坐标的范围
#==================================================================================================================================================
axes.set_ylim(0, self._ysize)
yaxis.set_major_locator(NullLocator())
for mal in axes.get_yticklabels(minor=False):
mal.set_visible(False)
for mil in axes.get_yticklabels(minor=True):
mil.set_visible(False)
def plot(self):
self.plot_codesymbol(xbase=0.0, ybase=self._ysize)
self.plot_codesymbol_2(xbase=self._xsize, ybase=self._ysize)
self.plot_companyname(xbase=0.0, ybase=self._ysize-0.8)
self.plot_companylocation(xbase=48.0, ybase=self._ysize)
self.plot_mainbusiness(xbase=48.0, ybase=self._ysize)
self.plot_description(xbase=90.0, ybase=self._ysize)
self.plot_sortinginfo(xbase=165.0, ybase=self._ysize)
def plot_codesymbol(self, xbase, ybase):
'''
交易代码、公司简称
'''
txtstr= self._cominfo[u'代码'] + u' ' + self._cominfo[u'简称']
label= self._Axes.text(xbase, ybase, txtstr, fontproperties=__font_properties__, verticalalignment='top', horizontalalignment='left')
label.set_fontsize(16.0)
def plot_codesymbol_2(self, xbase, ybase):
txtstr= self._cominfo[u'简称二']
label= self._Axes.text(xbase, ybase, txtstr, fontproperties=__font_properties__, verticalalignment='top', horizontalalignment='right')
label.set_fontsize(16.0)
def plot_companyname(self, xbase, ybase):
'''
曾用名、全名、英文名
'''
txtstr= self._cominfo[u'基本情况'][u'曾用名']
txtlist= txtstr.split('->')
if len(txtlist) > 15:
txtstr= ' -> '.join(txtlist[:5]) + ' ->\n' + ' -> '.join(txtlist[5:10]) + ' ->\n' + ' -> '.join(txtlist[10:15]) + ' ->\n' + ' -> '.join(txtlist[15:]) + '\n'
elif len(txtlist) > 10:
txtstr= ' -> '.join(txtlist[:5]) + ' ->\n' + ' -> '.join(txtlist[5:10]) + ' ->\n' + ' -> '.join(txtlist[10:]) + '\n'
elif len(txtlist) > 5:
txtstr= ' -> '.join(txtlist[:5]) + ' ->\n' + ' -> '.join(txtlist[5:]) + '\n'
else:
txtstr= ' -> '.join(txtlist) + '\n'
txtstr += self._cominfo[u'基本情况'][u'公司名称'] + '\n'
txtstr += self._cominfo[u'基本情况'][u'英文名称']
label= self._Axes.text(xbase, ybase, txtstr, fontproperties=__font_properties__, verticalalignment='top', horizontalalignment='left')
label.set_fontsize(4.5)
def plot_companylocation(self, xbase, ybase):
'''
地域、所属行业、上市日期
'''
txtstr= self._cominfo[u'公司概况'][u'区域'] + ' ' + self._cominfo[u'公司概况'][u'所属行业'] + ' ' + self._cominfo[u'发行相关'][u'上市日期']
label= self._Axes.text(xbase, ybase, txtstr, fontproperties=__font_properties__, verticalalignment='top', horizontalalignment='left')
label.set_fontsize(6.5)
def plot_mainbusiness(self, xbase, ybase):
'''
主营业务
'''
# 查找表: (<文字长度>, <每行字数>, <字体大小>, <Y轴偏移量>)
lookups= (
(20, 10, 12.0, 0.5),
(45, 15, 8.2, 0.5),
(80, 20, 6.2, 0.5),
(125, 25, 5.0, 0.5),
(180, 30, 4.1, 0.5),
(245, 35, 3.5, 0.4),
(999999, 37, 3.4, 0.4)
)
txtstr= self._cominfo[u'基本情况'][u'主营业务']
length= len(txtstr)
for sizelimit, linelimit, fontsize, yshift in lookups:
if length <= sizelimit:
txtstr= '\n'.join([txtstr[linelimit*idx : linelimit*(idx+1)] for idx in range(length//linelimit + 1)])
fsize= fontsize
ycoord= ybase - yshift
break
label= self._Axes.text(xbase, ycoord, txtstr, fontproperties=__font_properties__, verticalalignment='top', horizontalalignment='left', color='blue')
label.set_fontsize(fsize)
def plot_description(self, xbase, ybase):
'''
公司简介
'''
# 查找表: (<文字长度>, <每行字数>, <字体大小>)
lookups= (
(150, 30, 7.0),
(240, 40, 5.6),
(329, 47, 4.8),
(432, 54, 4.2),
(576, 64, 3.5),
(670, 67, 3.4),
(792, 72, 3.1),
(960, 80, 2.8),
(1222, 94, 2.4),
(1428, 102, 2.26),
(1620, 108, 2.12),
(1938, 114, 2.00),
(999999, 130, 1.75)
)
txtstr= self._cominfo[u'公司概况'][u'公司简介'] # 26 ~ 2600 字符
length= len(txtstr)
for sizelimit, linelimit, fontsize in lookups:
if length <= sizelimit:
txtstr= '\n'.join([txtstr[linelimit*idx : linelimit*(idx+1)] for idx in range(length//linelimit + 1)])
fsize= fontsize
break
label= self._Axes.text(xbase, ybase, txtstr, fontproperties=__font_properties__, verticalalignment='top', horizontalalignment='left')
label.set_fontsize(fsize)
def plot_sortinginfo(self, xbase, ybase):
'''
行业板块信息
'''
infolist= self._cominfo[u'行业板块']
for idx in range(len(infolist)//10 + 1):
txtstr= '\n'.join(infolist[10*idx : 10*(idx+1)])
if not txtstr:
break
xcoord= xbase + 25.0*idx
label= self._Axes.text(xcoord, ybase, txtstr, fontproperties=__font_properties__, verticalalignment='top', horizontalalignment='left', color='blue')
label.set_fontsize(3.4)
class SubPlot_Financial:
'''
换手率子图
'''
pass
class SubPlot_PriceBase:
'''
'''
def __init__(self, pdata, parent, xparams, name):
'''
'''
self._name= name # 派生类自己设置
self._pdata= pdata
self._parent= parent
self._expbase= __expbase__
self._xparams= xparams
self._shrink= __shrink__ if name == 'pricefs' else 1.0
# 绘图数据
quotes= pdata[u'行情']
if name == 'pricefs':
self._dates= quotes[u'日期']
self._open= quotes[u'开盘']
self._close= quotes[u'收盘']
self._high= quotes[u'最高']
self._low= quotes[u'最低']
if u'简化' in quotes: self._simple= quotes[u'简化']
# if u'换手率' in quotes: self._torate= quotes[u'换手率']
# if u'成交量' in quotes: self._volume= quotes[u'成交量']
# if u'成交额' in quotes: self._turnover= quotes[u'成交额']
if u'3日均' in quotes: self._average3= quotes[u'3日均']
if u'5日均' in quotes: self._average5= quotes[u'5日均']
if u'10日均' in quotes: self._average10= quotes[u'10日均']
if u'30日均' in quotes: self._average30= quotes[u'30日均']
if u'60日均' in quotes: self._average60= quotes[u'60日均']
if u'开盘二' in quotes:
self._open_2= quotes[u'开盘二']
self._close_2= quotes[u'收盘二']
self._high_2= quotes[u'最高二']
self._low_2= quotes[u'最低二']
if u'简化二' in quotes: self._simple_2= quotes[u'简化二']
# if u'换手率二' in quotes: self._torate_2= quotes[u'换手率二']
# if u'成交量二' in quotes: self._volume_2= quotes[u'成交量二']
# if u'成交额二' in quotes: self._turnover_2= quotes[u'成交额二']
if u'3日均二' in quotes: self._average3_2= quotes[u'3日均二']
if u'5日均二' in quotes: self._average5_2= quotes[u'5日均二']
if u'10日均二' in quotes: self._average10_2= quotes[u'10日均二']
if u'30日均二' in quotes: self._average30_2= quotes[u'30日均二']
if u'60日均二' in quotes: self._average60_2= quotes[u'60日均二']
else:
sidx, eidx= pdata[u'任务描述'][u'起始偏移'], pdata[u'任务描述'][u'结束偏移']
self._dates= quotes[u'日期'][sidx:eidx]
self._open= quotes[u'开盘'][sidx:eidx]
self._close= quotes[u'收盘'][sidx:eidx]
self._high= quotes[u'最高'][sidx:eidx]
self._low= quotes[u'最低'][sidx:eidx]
if u'简化' in quotes: self._simple= quotes[u'简化'][sidx:eidx]
# if u'换手率' in quotes: self._torate= quotes[u'换手率'][sidx:eidx]
# if u'成交量' in quotes: self._volume= quotes[u'成交量'][sidx:eidx]
# if u'成交额' in quotes: self._turnover= quotes[u'成交额'][sidx:eidx]
if u'3日均' in quotes: self._average3= quotes[u'3日均'][sidx:eidx]
if u'5日均' in quotes: self._average5= quotes[u'5日均'][sidx:eidx]
if u'10日均' in quotes: self._average10= quotes[u'10日均'][sidx:eidx]
if u'30日均' in quotes: self._average30= quotes[u'30日均'][sidx:eidx]
if u'60日均' in quotes: self._average60= quotes[u'60日均'][sidx:eidx]
if u'开盘二' in quotes:
self._open_2= quotes[u'开盘二'][sidx:eidx]
self._close_2= quotes[u'收盘二'][sidx:eidx]
self._high_2= quotes[u'最高二'][sidx:eidx]
self._low_2= quotes[u'最低二'][sidx:eidx]
if u'简化二' in quotes: self._simple_2= quotes[u'简化二'][sidx:eidx]
# if u'换手率二' in quotes: self._torate_2= quotes[u'换手率二'][sidx:eidx]
# if u'成交量二' in quotes: self._volume_2= quotes[u'成交量二'][sidx:eidx]
# if u'成交额二' in quotes: self._turnover_2= quotes[u'成交额二'][sidx:eidx]
if u'3日均二' in quotes: self._average3_2= quotes[u'3日均二'][sidx:eidx]
if u'5日均二' in quotes: self._average5_2= quotes[u'5日均二'][sidx:eidx]
if u'10日均二' in quotes: self._average10_2= quotes[u'10日均二'][sidx:eidx]
if u'30日均二' in quotes: self._average30_2= quotes[u'30日均二'][sidx:eidx]
if u'60日均二' in quotes: self._average60_2= quotes[u'60日均二'][sidx:eidx]
self._length= len(self._dates) # XXX: 由派生类设定
# 衍生数据
#==============================================================================================================
self._xindex= numpy.arange(self._length) # X 轴上的 index,一个辅助数据
self._zipoc= zip(self._open, self._close)
self._up= numpy.array( [ True if po < pc and po is not None else False for po, pc in self._zipoc] ) # 标示出该天股价日内上涨的一个序列
self._down= numpy.array( [ True if po > pc and po is not None else False for po, pc in self._zipoc] ) # 标示出该天股价日内下跌的一个序列
self._side= numpy.array( [ True if po == pc and po is not None else False for po, pc in self._zipoc] ) # 标示出该天股价日内走平的一个序列
if u'开盘二' in quotes:
self._zipoc_2= zip(self._open_2, self._close_2)
self._up_2= numpy.array( [ True if po < pc and po is not None else False for po, pc in self._zipoc_2] ) # 标示出该天股价日内上涨的一个序列
self._down_2= numpy.array( [ True if po > pc and po is not None else False for po, pc in self._zipoc_2] ) # 标示出该天股价日内下跌的一个序列
self._side_2= numpy.array( [ True if po == pc and po is not None else False for po, pc in self._zipoc_2] ) # 标示出该天股价日内走平的一个序列
self._Axes= None
self._AxisX= None
self._AxisY= None
self._xsize= 0.0
self._ysize= 0.0
self._yhighlim= 0 # Y 轴最大坐标
self._ylowlim= 0 # Y 轴最小坐标
if u'开盘二' in self._pdata[u'行情']:
self._Axes_2= None # 如果有第二个行情数据,就建立另一个 Axes 对象
self._AxisX_2= None
self._AxisY_2= None
self._yhighlim_2= 0 # Y 轴最大坐标
self._ylowlim_2= 0 # Y 轴最小坐标
self._compute_size()
self._ytickset= self._compute_ytickset() # 需放在前一句后面
def _compute_size(self):
'''
根据绘图数据 pdata 计算出本子图的尺寸,修改数据成员
'''
quotes= self._pdata[u'行情']
popen= self._open[0] # int 类型
phigh= max( [ph for ph in self._high if ph is not None] ) # 最高价
plow= min( [pl for pl in self._low if pl is not None] ) # 最低价
# Y 轴范围
if self._name == 'pricefs':
yhighlim= phigh * 1.2 # K线子图 Y 轴最大坐标
ylowlim= plow / 1.2 # K线子图 Y 轴最小坐标
else:
yhighlim= phigh * 1.1 # K线子图 Y 轴最大坐标
ylowlim= plow / 1.1 # K线子图 Y 轴最小坐标
self._yhighlim= yhighlim
self._ylowlim= ylowlim
if u'开盘二' in quotes:
popen_2= self._open_2[0] # 同上
phigh_2= max( [ph for ph in self._high_2 if ph is not None] ) # 第二个行情的最高价
phigh= max(phigh, int(phigh_2 * popen / float(popen_2))) # 以第一个行情为基准修正出的总最高价
plow_2= min( [pl for pl in self._low_2 if pl is not None] ) # 最低价
plow= min(plow, int(plow_2 * popen / float(popen_2))) # 以第一个行情为基准修正出的总最低价
if self._name == 'pricefs':
yhighlim= phigh * 1.2 # K线子图 Y 轴最大坐标
ylowlim= plow / 1.2 # K线子图 Y 轴最小坐标
else:
yhighlim= phigh * 1.1 # K线子图 Y 轴最大坐标
ylowlim= plow / 1.1 # K线子图 Y 轴最小坐标
ylowlim_2= ylowlim * popen_2 / float(popen)
yhighlim_2= yhighlim * popen_2 / float(popen)
self._yhighlim= yhighlim
self._ylowlim= ylowlim
self._yhighlim_2= yhighlim_2
self._ylowlim_2= ylowlim_2
# XXX: 价格在 Y 轴上的 “份数”。注意,虽然最高与最低价是以第一个行情为基准修正出来的,但其中包含的倍数因子对结果无影响,即:
# log(base, num1) - log(base, num2) ==
# log(base, num1/num2) ==
# log(base, k*num1/k*num2) ==
# log(base, k*num1) - log(base, k*num2)
# ,这是对数运算的性质。
xmargin= self._xparams['xmargin']
self._xsize= (self._length + xmargin*2) * self._shrink # int, 所有数据的长度,就是天数
self._ysize= (math.log(yhighlim, self._expbase) - math.log(ylowlim, self._expbase)) * self._shrink # float
def get_size(self):
return (self._xsize, self._ysize)
def get_ylimits(self):
return (self._yhighlim, self._ylowlim)
def build_axes(self, figobj, rect):
'''
初始化 self._Axes 对象
'''
# 添加 Axes 对象
#==================================================================================================================================================
if self._name == 'price' and 'torate' in self._parent._subplots:
sharex= self._parent._subplots['torate'].get_axes()
axes= figobj.add_axes(rect, axis_bgcolor='black', sharex=sharex)
elif self._name == 'pricefs' and 'toratefs' in self._parent._subplots:
sharex= self._parent._subplots['toratefs'].get_axes()
axes= figobj.add_axes(rect, axis_bgcolor='black', sharex=sharex)
else:
axes= figobj.add_axes(rect, axis_bgcolor='black')
axes.set_axisbelow(True) # 网格线放在底层
# axes.set_zorder(1) # XXX: 不顶用
# axes.patch.set_visible(False) # hide the 'canvas'
axes.set_yscale('log', basey=self._expbase) # 使用对数坐标
# 改变坐标线的颜色
#==================================================================================================================================================
for child in axes.get_children():
if isinstance(child, matplotlib.spines.Spine):
child.set_color(__color_gold__)
# 得到 X 轴 和 Y 轴 的两个 Axis 对象
#==================================================================================================================================================
xaxis= axes.get_xaxis()
yaxis= axes.get_yaxis()
# 设置两个坐标轴上的网格线
#==================================================================================================================================================
xaxis.grid(True, 'major', color='0.3', linestyle='solid', linewidth=0.2)
xaxis.grid(True, 'minor', color='0.3', linestyle='dotted', linewidth=0.1)
if self._name == 'pricefs': # 如果是小图,就不设辅助网格线
yaxis.grid(True, 'major', color='0.3', linestyle='solid', linewidth=0.1)
else:
yaxis.grid(True, 'major', color='0.3', linestyle='solid', linewidth=0.2)
yaxis.grid(True, 'minor', color='0.3', linestyle='dotted', linewidth=0.1)
yaxis.set_label_position('left')
self._Axes= axes
self._AxisX= xaxis
self._AxisY= yaxis
if u'开盘二' in self._pdata[u'行情']:
# 添加 Axes 对象。注意,设置 axes_2 而不是 axes 的网格线,从而不会跑到 axes 边框上边的做法不顶用。
#==================================================================================================================================================
axes_2= axes.twinx() # twinx is problematic, no use no more.
# XXX: 下面这三行把第一个 axes 放在上面,这样不会被第二个 axes 的图形遮盖。用 zorder 不顶用。
axes.figure.axes[-2:]= [axes_2, axes] # XXX:
axes.set_frame_on(False) # 如果不做此设定,axes_2 的内容会看不见
axes_2.set_frame_on(True)
axes_2.set_axis_bgcolor('black')
axes_2.set_axisbelow(True) # 网格线放在底层
axes_2.set_yscale('log', basey=self._expbase) # 使用对数坐标
# 改变坐标线的颜色
#==================================================================================================================================================
for child in axes_2.get_children():
if isinstance(child, matplotlib.spines.Spine):
child.set_color(__color_gold__)
# 得到 X 轴 和 Y 轴 的两个 Axis 对象
#==================================================================================================================================================
xaxis_2= axes_2.get_xaxis()
yaxis_2= axes_2.get_yaxis()
# 设置两个坐标轴上的网格线
#==================================================================================================================================================
# xaxis_2.grid(True, 'major', color='0.3', linestyle='solid', linewidth=0.2)
# xaxis_2.grid(True, 'minor', color='0.3', linestyle='dotted', linewidth=0.1)
# if self._name == 'pricefs': # 如果是小图,就不设辅助网格线
# yaxis_2.grid(True, 'major', color='0.3', linestyle='solid', linewidth=0.1)
# else:
# yaxis_2.grid(True, 'major', color='0.3', linestyle='solid', linewidth=0.2)
# yaxis_2.grid(True, 'minor', color='0.3', linestyle='dotted', linewidth=0.1)
yaxis_2.set_label_position('right')
self._Axes_2= axes_2
self._AxisX_2= xaxis_2
self._AxisY_2= yaxis_2
def set_xticks(self):
xMajorLocator= self._xparams['xMajorLocator']
xMinorLocator= self._xparams['xMinorLocator']
axes= self._Axes
xaxis= self._AxisX
# 设定 X 轴坐标的范围
#==================================================================================================================================================
xmargin= self._xparams['xmargin']
axes.set_xlim(-xmargin, self._length + xmargin)
# 先设置 label 位置,再将 X 轴上的坐标设为不可见。因为与 成交量子图 共用 X 轴
#==================================================================================================================================================
# 设定 X 轴的 Locator 和 Formatter
xaxis.set_major_locator(xMajorLocator)
# xaxis.set_major_formatter(xMajorFormatter)
xaxis.set_minor_locator(xMinorLocator)
# xaxis.set_minor_formatter(xMinorFormatter)
# 将 X 轴上的坐标设为不可见。
for mal in axes.get_xticklabels(minor=False):
mal.set_visible(False)
for mil in axes.get_xticklabels(minor=True):
mil.set_visible(False)
def set_xticks_2(self):
quotes= self._pdata[u'行情']
axes= self._Axes_2
xaxis= self._AxisX_2
xMajorLocator= self._xparams['xMajorLocator']
xMinorLocator= self._xparams['xMinorLocator']
# 设定 X 轴坐标的范围
#==================================================================================================================================================
xmargin= self._xparams['xmargin']
axes.set_xlim(-xmargin, self._length + xmargin)
# 先设置 label 位置,再将 X 轴上的坐标设为不可见。因为与 成交量子图 共用 X 轴
#==================================================================================================================================================
# 设定 X 轴的 Locator 和 Formatter
xaxis.set_major_locator(xMajorLocator)
# xaxis.set_major_formatter(xMajorFormatter)
xaxis.set_minor_locator(xMinorLocator)
# xaxis.set_minor_formatter(xMinorFormatter)
# 将 X 轴上的坐标设为不可见。
for mal in axes.get_xticklabels(minor=False):
mal.set_visible(False)
for mil in axes.get_xticklabels(minor=True):
mil.set_visible(False)
def _compute_ytickset(self):
'''
计算 Y 轴坐标点的位置,包括第二个行情
'''
quotes= self._pdata[u'行情']
expbase= self._expbase
ytickset= {}
yhighlim= self._yhighlim
ylowlim= self._ylowlim
if u'开盘二' in quotes:
yhighlim_2= self._yhighlim_2
ylowlim_2= self._ylowlim_2
if self._name == 'price' and 'pricefs' in self._parent._subplots:
tsetfs= self._parent._subplots['pricefs'].get_ytickset()
majors= tsetfs['major']
while majors[-1] < yhighlim: majors.append(majors[-1] * expbase)
while majors[0] > ylowlim: majors.insert(0, majors[0] / expbase)
minors= tsetfs['minor']
while minors[-1] < yhighlim: minors.append(minors[-1] * expbase)
while minors[0] > ylowlim: minors.insert(0, minors[0] / expbase)
ytickset['major']= [loc for loc in majors if loc > ylowlim and loc < yhighlim]
ytickset['minor']= [loc for loc in minors if loc > ylowlim and loc < yhighlim]
else:
# 主要坐标点
#----------------------------------------------------------------------------
majors= [ylowlim]
while majors[-1] < yhighlim: majors.append(majors[-1] * 1.1)
# 辅助坐标点
#----------------------------------------------------------------------------
minors= [ylowlim * 1.1**0.5]
while minors[-1] < yhighlim: minors.append(minors[-1] * 1.1)
ytickset['major']= [loc for loc in majors if loc > ylowlim and loc < yhighlim] # 注意,第一项(ylowlim)被排除掉了
ytickset['minor']= [loc for loc in minors if loc > ylowlim and loc < yhighlim]
if u'开盘二' in quotes:
popen= self._open[0] # int 类型
popen_2= self._open_2[0] # 同上
ytickset['major_2']= [loc * popen_2 / popen for loc in ytickset['major']]
ytickset['minor_2']= [loc * popen_2 / popen for loc in ytickset['minor']]
return ytickset
def get_ytickset(self):
return self._ytickset
def set_yticks(self):
'''
设置第一只行情的 Y 轴坐标,包括坐标值在图中间的显示
'''
axes= self._Axes
ylowlim= self._ylowlim
yhighlim= self._yhighlim
yaxis= self._AxisY
majorticks= self._ytickset['major']
minorticks= self._ytickset['minor']
# 设定 Y 轴坐标的范围
#==================================================================================================================================================
axes.set_ylim(ylowlim, yhighlim)
# 设定 Y 轴上的坐标
#==================================================================================================================================================
# 主要坐标点
#----------------------------------------------------------------------------
yMajorLocator= FixedLocator(numpy.array(majorticks))
# 确定 Y 轴的 MajorFormatter
def y_major_formatter(num, pos=None):
return str(round(num/1000.0, 2))
yMajorFormatter= FuncFormatter(y_major_formatter)
# 设定 X 轴的 Locator 和 Formatter
yaxis.set_major_locator(yMajorLocator)
yaxis.set_major_formatter(yMajorFormatter)
# 设定 Y 轴主要坐标点与辅助坐标点的样式
fsize= 4 if self._name == 'pricefs' else 6
for mal in axes.get_yticklabels(minor=False):
mal.set_fontsize(fsize)
# 辅助坐标点
#----------------------------------------------------------------------------
yMinorLocator= FixedLocator(numpy.array(minorticks))
# 确定 Y 轴的 MinorFormatter
def y_minor_formatter(num, pos=None):
return str(round(num/1000.0, 2))
yMinorFormatter= FuncFormatter(y_minor_formatter)
# 设定 X 轴的 Locator 和 Formatter
yaxis.set_minor_locator(yMinorLocator)
yaxis.set_minor_formatter(yMinorFormatter)
# 设定 Y 轴辅助坐标点的样式
if self._name == 'pricefs':
for mil in axes.get_yticklabels(minor=True):
mil.set_visible(False)
else:
for mil in axes.get_yticklabels(minor=True):
mil.set_fontsize(5)
mil.set_color('blue')
def set_yticks_2(self):
'''
子图右侧的 Y 轴坐标
'''
axes= self._Axes_2
yaxis= self._AxisY_2
yhighlim_2= self._yhighlim_2
ylowlim_2= self._ylowlim_2
majorticks_2= self._ytickset['major_2']
minorticks_2= self._ytickset['minor_2']
# 设定 Y 轴坐标的范围
#==================================================================================================================================================
axes.set_ylim(ylowlim_2, yhighlim_2)
# 设定 Y 轴上的坐标
#==================================================================================================================================================
# 主要坐标点
#----------------------------------------------------------------------------
yMajorLocator= FixedLocator(numpy.array(majorticks_2))
# 确定 Y 轴的 MajorFormatter
def y_major_formatter(num, pos=None):
return str(round(num/1000.0, 2))
yMajorFormatter= FuncFormatter(y_major_formatter)
# 设定 X 轴的 Locator 和 Formatter
yaxis.set_major_locator(yMajorLocator)
yaxis.set_major_formatter(yMajorFormatter)
# 设定 Y 轴主要坐标点与辅助坐标点的样式
fsize= 4 if self._name == 'pricefs' else 6
for mal in axes.get_yticklabels(minor=False):
mal.set_fontsize(fsize)
# 辅助坐标点
#----------------------------------------------------------------------------
yMinorLocator= FixedLocator(numpy.array(minorticks_2)) # XXX minor ticks 已经在上面一并设置,这里不需要了。
# 确定 Y 轴的 MinorFormatter
def y_minor_formatter(num, pos=None):
return str(round(num/1000.0, 2))
yMinorFormatter= FuncFormatter(y_minor_formatter)
# 设定 X 轴的 Locator 和 Formatter
yaxis.set_minor_locator(yMinorLocator)
yaxis.set_minor_formatter(yMinorFormatter)
# 设定 Y 轴主要坐标点与辅助坐标点的样式
if self._name == 'pricefs':
for mil in axes.get_yticklabels(minor=True):
mil.set_visible(False)
else:
for mil in axes.get_yticklabels(minor=True):
mil.set_fontsize(5)
mil.set_color('blue')
def plot(self):
'''
由派生类自己定义
'''
pass
def plot_candlestick(self):
'''
绘制 K 线
'''
axes= self._Axes
xindex= self._xindex
up= self._up
down= self._down
side= self._side
# 绘制 K 线部分
#==================================================================================================================================================
# 对开收盘价进行视觉修正
for idx, poc in enumerate(self._zipoc):
if poc[0] == poc[1] and None not in poc:
variant= int(round((poc[1]+1000)/2000.0, 0))
self._open[idx]= poc[0] - variant # 稍微偏离一点,使得在图线上不致于完全看不到
self._close[idx]= poc[1] + variant
rarray_open= numpy.array(self._open)
rarray_close= numpy.array(self._close)
rarray_high= numpy.array(self._high)
rarray_low= numpy.array(self._low)
# XXX: 如果 up, down, side 里有一个全部为 False 组成,那么 vlines() 会报错。
# XXX: 可以使用 alpha 参数调节透明度
if True in up:
axes.vlines(xindex[up], rarray_low[up], rarray_high[up], edgecolor='red', linewidth=0.6, label='_nolegend_', alpha=0.5)
axes.vlines(xindex[up], rarray_open[up], rarray_close[up], edgecolor='red', linewidth=3.0, label='_nolegend_', alpha=0.5)
if True in down:
axes.vlines(xindex[down], rarray_low[down], rarray_high[down], edgecolor='green', linewidth=0.6, label='_nolegend_', alpha=0.5)
axes.vlines(xindex[down], rarray_open[down], rarray_close[down], edgecolor='green', linewidth=3.0, label='_nolegend_', alpha=0.5)
if True in side:
axes.vlines(xindex[side], rarray_low[side], rarray_high[side], edgecolor='0.7', linewidth=0.6, label='_nolegend_', alpha=0.5)
axes.vlines(xindex[side], rarray_open[side], rarray_close[side], edgecolor='0.7', linewidth=3.0, label='_nolegend_', alpha=0.5)
def plot_simplified(self):
'''
绘制简化行情
'''
xindex= self._xindex
axes= self._Axes
rarray_simple= numpy.array(self._simple)
axes.plot(xindex, rarray_simple, 'o-', color='white', linewidth=0.3, label='simple', \
markersize=0.3, markeredgecolor='white', markeredgewidth=0.1, alpha=0.3) # 简化行情
def plot_average(self):
'''
绘制均线
'''
# 绘制均线部分
#==================================================================================================================================================
quotes= self._pdata[u'行情']
xindex= self._xindex
axes= self._Axes
if self._name == 'pricefs':
widthw= 0.1
widthn= 0.07
mksize= 0.07
mkwidth= 0.1
alpha= 1.0
else:
widthw= 0.2
widthn= 0.1
mksize= 0.3
mkwidth= 0.1
alpha= 1.0
if u'3日均' in quotes:
rarray_3dayave= numpy.array(self._average3)
axes.plot(xindex, rarray_3dayave, 'o-', color='white', linewidth=widthw, label='avg_3', \
markersize=mksize, markeredgecolor='white', markeredgewidth=mkwidth, alpha=alpha) # 3日均线
if u'5日均' in quotes:
rarray_5dayave= numpy.array(self._average5)
axes.plot(xindex, rarray_5dayave, 'o-', color='white', linewidth=widthn, label='avg_5', \
markersize=mksize, markeredgecolor='white', markeredgewidth=mkwidth, alpha=alpha) # 5日均线
if u'10日均' in quotes:
rarray_10dayave= numpy.array(self._average10)
axes.plot(xindex, rarray_10dayave, 'o-', color='yellow', linewidth=widthn, label='avg_10', \
markersize=mksize, markeredgecolor='yellow', markeredgewidth=mkwidth, alpha=alpha) # 10日均线
if u'30日均' in quotes:
rarray_30dayave= numpy.array(self._average30)
axes.plot(xindex, rarray_30dayave, 'o-', color='cyan', linewidth=widthn, label='avg_30', \
markersize=mksize, markeredgecolor='cyan', markeredgewidth=mkwidth, alpha=alpha) # 30日均线
if u'60日均' in quotes:
rarray_60dayave= numpy.array(self._average60)
axes.plot(xindex, rarray_60dayave, 'o-', color='magenta', linewidth=widthn, label='avg_60', \
markersize=mksize, markeredgecolor='magenta', markeredgewidth=mkwidth, alpha=alpha) # 60日均线
def plot_adjustnotes(self):
'''
绘制复权提示
'''
quotes= self._pdata[u'行情']
firstday= self._dates[0]
lastday= self._dates[-1]
ylowlim= self._ylowlim
yhighlim= self._yhighlim
axes= self._Axes
# 使用 annotate() 进行标注。不用了,留作纪念。
#===========================================================================================================================
# adjdict= dict(quotes[u'相对复权']) # key 是 date string,value 是相对复权因子(float 类型)
# el= Ellipse((2, -1), 0.5, 0.5)
# for idx, dstr in enumerate(self._dates):
# if dstr in adjdict:
# axes.plot([idx, idx], [ylowlim, yhighlim], '-', color='purple', linewidth=0.1)
# axes.annotate(u'复权\n' + str(adjdict[dstr]),
# fontproperties=__font_properties__,
# xy=(idx, yhighlim/1.1), xycoords='data',
# xytext=(10, 5), textcoords='offset points', size=5, verticalalignment="center",
# bbox=dict(boxstyle="round", facecolor='white', edgecolor='purple'),
# arrowprops=dict(arrowstyle="wedge,tail_width=1.",
# facecolor='white', edgecolor='purple',
# patchA=None,
# patchB=el,
# relpos=(0.2, 0.8),
# connectionstyle="arc3,rad=-0.1"),
# alpha=0.5
# )
adjrecs= [rec for rec in quotes[u'相对复权'] if rec[0] >= firstday and rec[0] <= lastday]
if self._name == 'pricefs':
fsize= 3.0
ycoord= yhighlim/1.3
alpha= 1.0
else:
fsize= 5.0
ycoord= yhighlim/1.12
alpha= 1.0
for dstr, afac in adjrecs:
idx= self._dates.index(dstr)
axes.plot([idx, idx], [ylowlim, yhighlim], '-', color='purple', linewidth=0.1)
label= axes.text( \
idx, ycoord, \
u'复权 ' + str(afac) + u'\n' + dstr, \
fontproperties=__font_properties__, \
horizontalalignment='left', \
verticalalignment='top', \
color='purple', \
alpha=alpha
)
label.set_fontsize(fsize)
def plot_capchangenotes(self):
'''
绘制流通股本变更提示
注意两个问题:
1. 流通股本变更提示中的日期可能不是交易日期
2. 流通股本变更提示涵盖个股的所有历史,有些内容可能在绘图目标区间以外
'''
pdata= self._pdata
axes= self._Axes
ylowlim= self._ylowlim
yhighlim= self._yhighlim
firstday= self._dates[0]
lastday= self._dates[-1]
# 把目标区间之外的记录滤掉
changerecs= [rec for rec in pdata[u'公司信息'][u'流通股变更'] if rec[u'变更日期'] >= firstday and rec[u'变更日期'] <= lastday]
# 使用 annotate() 进行标注。不用了,留作纪念。
#===========================================================================================================================
# el= Ellipse((2, -1), 0.5, 0.5)
# for datestr, chrate in changerecs:
# dstr= [ds for ds in self._dates if ds >= datestr][0]
# idx= self._dates.index(dstr)
# axes.plot([idx, idx], [ylowlim, yhighlim], '-', color='yellow', linewidth=0.1)
# axes.annotate(u'流通股\n' + str(chrate),
# fontproperties=__font_properties__,
# xy=(idx, yhighlim/1.1), xycoords='data',
# xytext=(10, 5), textcoords='offset points', size=5, verticalalignment="center",
# bbox=dict(boxstyle="round", facecolor='white', edgecolor='yellow'),
# arrowprops=dict(arrowstyle="wedge,tail_width=1.",
# facecolor='white', edgecolor='yellow',
# patchA=None,
# patchB=el,
# relpos=(0.2, 0.8),
# connectionstyle="arc3,rad=-0.1"),
# alpha=0.5
# )
if self._name == 'pricefs':
fsize= 3.0
ycoord= yhighlim/1.1
alpha= 1.0
else:
fsize= 5.0
ycoord= yhighlim/1.05
alpha= 0.8
for record in changerecs:
datestr= record[u'变更日期']
chrate= record[u'变更比']
dstr= [ds for ds in self._dates if ds >= datestr][0]
idx= self._dates.index(dstr)
axes.plot([idx, idx], [ylowlim, yhighlim], '-', color='yellow', linewidth=0.1)
label= axes.text( \
idx, ycoord, \
u'流通股 ' + str(chrate) + u'\n' + datestr, \
fontproperties=__font_properties__, \
horizontalalignment='left', \
verticalalignment='top', \
color='yellow', \
alpha=alpha
)
label.set_fontsize(fsize)
def plot_candlestick_2(self):
'''
绘制第二条 K 线
'''
xindex= self._xindex
axes= self._Axes_2
up= self._up_2
down= self._down_2
side= self._side_2
# 对开收盘价进行视觉修正
for idx, poc in enumerate( self._zipoc_2 ):
if poc[0] == poc[1] and None not in poc:
self._open_2[idx]= poc[0] - 5 # 稍微偏离一点,使得在图线上不致于完全看不到
self._close_2[idx]= poc[1] + 5
rarray_open= numpy.array(self._open_2)
rarray_close= numpy.array(self._close_2)
rarray_high= numpy.array(self._high_2)
rarray_low= numpy.array(self._low_2)
# XXX: 如果 up, down, side 里有一个全部为 False 组成,那么 vlines() 会报错。
# XXX: 可以使用 alpha 参数调节透明度
if True in up:
axes.vlines(xindex[up], rarray_low[up], rarray_high[up], edgecolor='0.7', linewidth=0.6, label='_nolegend_', alpha=0.5)
axes.vlines(xindex[up], rarray_open[up], rarray_close[up], edgecolor='0.7', linewidth=3.0, label='_nolegend_', alpha=0.5)
if True in down:
axes.vlines(xindex[down], rarray_low[down], rarray_high[down], edgecolor='0.3', linewidth=0.6, label='_nolegend_', alpha=0.5)
axes.vlines(xindex[down], rarray_open[down], rarray_close[down], edgecolor='0.3', linewidth=3.0, label='_nolegend_', alpha=0.5)
if True in side:
axes.vlines(xindex[side], rarray_low[side], rarray_high[side], edgecolor='1.0', linewidth=0.6, label='_nolegend_', alpha=1.0)
axes.vlines(xindex[side], rarray_open[side], rarray_close[side], edgecolor='1.0', linewidth=3.0, label='_nolegend_', alpha=1.0)
def plot_capitalinfo(self):
'''
绘制行情首日和尾日的股本信息
'''
def find_biggestblank(didx):
'''
找出 X 轴某个位置图中最大的空隙
'''
pstart= self._open[0]
ptarget= self._open[didx]
compseq= [yhighlim, ptarget, ylowlim]
if u'开盘二' in quotes:
pstart_2= self._open_2[0]
ptarget_2= self._open_2[didx]
padjust= int(ptarget_2 * pstart / float(pstart_2))
compseq.append(padjust)
compseq.sort(reverse=True) # 图中的三个或四个关键点,高到底排序
diff, hi, low= max([(math.log(compseq[idx]/float(compseq[idx+1]), expbase), compseq[idx], compseq[idx+1]) for idx in range(len(compseq)-1)])
# XXX: for debugging
# print(compseq)
# print([diff, hi, low])
return (hi*low)**0.5 # 相乘再开平方,在 log 坐标系里看起来就是在中间位置。
def repr_int(intnum):
'''
123456789 --> '1,2345,6789'
'''
if type(intnum) not in (int, long): return str(intnum)
if intnum == 0: return '0'
if intnum < 0:
intnum= -intnum
isminus= True
else:
isminus= False
intstr= str(intnum)
intstr= '0'*((4-len(intstr)%4)%4) + intstr
intlist= [intstr[i:i+4] for i in range(0, len(intstr), 4)]
intlist[0]= intlist[0].lstrip('0')
return ('-' + ','.join(intlist)) if isminus else ','.join(intlist)
pdata= self._pdata
quotes= pdata[u'行情']
ylowlim= self._ylowlim
yhighlim= self._yhighlim
length= self._length
expbase= self._expbase
capinfo= pdata[u'公司信息'][u'股本变更记录']
axes= self._Axes
firstday, lastday= self._dates[0], self._dates[-1]
fsize= 5.0 if self._name == 'price' else 3.0
# 首日总股本与流通股信息
#====================================================================================================================================
chunk= [rec for rec in capinfo if rec[u'变更日期'] <= firstday]
if chunk:
allshares= repr_int(chunk[-1][u'总股本'])
circulating= repr_int(chunk[-1][u'流通股'])
else:
allshares= 'None'
circulating= 'None'
infostr= u'总股本: ' + allshares + '\n' + u'流通股: ' + circulating
label= axes.text(0, find_biggestblank(didx=0), infostr, fontproperties=__font_properties__, color='0.7')
label.set_fontsize(fsize)
# label.set_zorder(0) # XXX: 放在底层
# 尾日总股本与流通股信息
#====================================================================================================================================
chunk= [rec for rec in capinfo if rec[u'变更日期'] <= lastday]
if chunk:
allshares= repr_int(chunk[-1][u'总股本'])
circulating= repr_int(chunk[-1][u'流通股'])
else:
allshares= 'None'
circulating= 'None'
infostr= u'总股本: ' + allshares + '\n' + u'流通股: ' + circulating
label= axes.text(length-1, find_biggestblank(didx=length-1), infostr, fontproperties=__font_properties__, horizontalalignment='right', color='0.7')
label.set_fontsize(fsize)
# label.set_zorder(0) # XXX: 放在底层
def plot_usernotes(self):
'''
'''
pdata= self._pdata
quotes= pdata[u'行情']
sidx= self._pdata[u'任务描述'][u'起始偏移']
eidx= self._pdata[u'任务描述'][u'结束偏移']
axes= self._Axes
usernotes= pdata[u'用户标记']
alldates= quotes[u'日期'][sidx:eidx]
lowprices= quotes[u'最低'][sidx:eidx]
expbase= self._expbase
# 绘制短线买点标记
for note in usernotes:
if note[u'类型'] == u'筛选结果':
dstr= note[u'日期']
# 日期不在绘图区间范围内,忽略
if dstr not in alldates:
continue
# 决定箭头的颜色
result= note[u'结果']
color= 'magenta' if result == u'上涨' else 'cyan' if result == u'下跌' else 'white'
# 箭头的起始位置
idx= alldates.index(dstr)
xpos= idx
ypos= lowprices[idx] / expbase
# 箭头的长度
dx= 0.0
dy= ypos * (expbase-1) * 0.9
# 头端的长度
head_length= dy * 0.2
# 绘制箭头
arrow_params={'length_includes_head':True, 'shape':'full', 'head_starts_at_zero':False}
axes.arrow(xpos, ypos, dx, dy, facecolor=color, edgecolor=color, linewidth=0.7, head_width=0.6, head_length=head_length, **arrow_params)
def plot_vlines(self):
xindex= self._xindex
up= self._up
down= self._down
side= self._side
axes= self._Axes
lwidth= 2.4 * self._shrink
# 绘制 K 线部分
#==================================================================================================================================================
rarray_high= numpy.array(self._high)
rarray_low= numpy.array(self._low)
# XXX: 如果 up, down, side 里有一个全部为 False 组成,那么 vlines() 会报错。
# XXX: 可以使用 alpha 参数调节透明度
if True in up:
axes.vlines(xindex[up], rarray_low[up], rarray_high[up], edgecolor='red', linewidth=lwidth, label='_nolegend_', alpha=0.5)
if True in down:
axes.vlines(xindex[down], rarray_low[down], rarray_high[down], edgecolor='green', linewidth=lwidth, label='_nolegend_', alpha=0.5)
if True in side:
axes.vlines(xindex[side], rarray_low[side], rarray_high[side], edgecolor='0.7', linewidth=lwidth, label='_nolegend_', alpha=0.5)
def plot_vlines_2(self):
xindex= self._xindex
axes= self._Axes_2
up= self._up_2
down= self._down_2
side= self._side_2
lwidth= 2.4 * self._shrink
rarray_high= numpy.array(self._high_2)
rarray_low= numpy.array(self._low_2)
# XXX: 如果 up, down, side 里有一个全部为 False 组成,那么 vlines() 会报错。
# XXX: 可以使用 alpha 参数调节透明度
if True in up:
axes.vlines(xindex[up], rarray_low[up], rarray_high[up], edgecolor='0.7', linewidth=lwidth, label='_nolegend_', alpha=0.5)
if True in down:
axes.vlines(xindex[down], rarray_low[down], rarray_high[down], edgecolor='0.3', linewidth=lwidth, label='_nolegend_', alpha=0.5)
if True in side:
axes.vlines(xindex[side], rarray_low[side], rarray_high[side], edgecolor='1.0', linewidth=lwidth, label='_nolegend_', alpha=1.0)
def plot_datenotes(self):
'''
内部的日期注释,由派生类定义
'''
pass
def plot_pricenotes(self):
'''
内部的价格注释,由派生类定义
'''
pass
class SubPlot_PriceFullSpan(SubPlot_PriceBase):
'''
'''
def plot(self):
'''
绘图
'''
pdata= self._pdata
# if u'简化' in pdata:
# self.plot_simplified()
# else:
# self.plot_candlestick()
self.plot_vlines()
self.plot_average()
if u'相对复权' in pdata[u'行情']:
self.plot_adjustnotes()
if u'流通股变更' in pdata[u'公司信息']:
self.plot_capchangenotes()
if u'股本变更记录' in pdata[u'公司信息']:
self.plot_capitalinfo()
self.set_xticks()
self.set_yticks()
if u'开盘二' in pdata[u'行情']:
self.plot_vlines_2()
self.set_xticks_2()
self.set_yticks_2()
self.plot_datenotes()
if 'price' in self._parent._subplots:
self.plot_windowspan()
def plot_datenotes(self):
'''
日期在图中间的显示
'''
ylowlim= self._ylowlim
axes= self._Axes
sdindex= self._xparams['sdindex']
mdindex= self._xparams['mdindex']
# 每季度第一个交易日
for ix in sdindex:
newlab= axes.text(ix - (1/self._shrink), ylowlim*1.03, self._dates[ix])
newlab.set_font_properties(__font_properties__)
newlab.set_color('0.3')
newlab.set_fontsize(4)
newlab.set_rotation('45')
# newlab.set_rotation('vertical')
# newlab.set_horizontalalignment('left')
# newlab.set_verticalalignment('bottom')
# newlab.set_verticalalignment('center')
newlab.set_zorder(0) # XXX: 放在底层
# 每月第一个交易日
for ix in mdindex:
newlab= axes.text(ix - (0.8/self._shrink), ylowlim * 1.03, self._dates[ix])
newlab.set_font_properties(__font_properties__)
newlab.set_color('0.3')
newlab.set_fontsize(3)
newlab.set_rotation('45')
# newlab.set_rotation('vertical')
# newlab.set_horizontalalignment('left')
# newlab.set_verticalalignment('top') # 不行
# newlab.set_verticalalignment('center')
# newlab.set_verticalalignment('bottom')
newlab.set_zorder(0) # XXX: 放在底层
def plot_windowspan(self):
axes= self._Axes
jobstat= self._pdata[u'任务描述']
sindex, eindex= jobstat[u'起始偏移'], jobstat[u'结束偏移']
hibdry, lobdry= self._parent._subplots['price'].get_ylimits()
xcoord= sindex - 1
width= eindex - sindex + 1
ycoord= lobdry
height= hibdry - lobdry
window= matplotlib.patches.Rectangle((xcoord, ycoord), width, height, fill=False, edgecolor=__color_lightblue__, linewidth=0.3, alpha=0.7)
window.set_zorder(-1) # 放在底层
axes.add_patch(window)
class SubPlot_Price(SubPlot_PriceBase):
'''
'''
def plot(self):
'''
绘图
'''
pdata= self._pdata
# if u'简化' in pdata:
# self.plot_simplified()
# else:
# self.plot_candlestick()
self.plot_candlestick()
self.plot_average()
if u'相对复权' in pdata[u'行情']:
self.plot_adjustnotes()
if u'流通股变更' in pdata[u'公司信息']:
self.plot_capchangenotes()
if u'股本变更记录' in pdata[u'公司信息']:
self.plot_capitalinfo()
if u'用户标记' in pdata:
self.plot_usernotes()
self.set_xticks()
self.set_yticks()
if u'开盘二' in pdata[u'行情']:
self.plot_candlestick_2()
self.set_xticks_2()
self.set_yticks_2()
self.plot_pricenotes()
self.plot_datenotes()
def plot_datenotes(self):
'''
日期在图中间的显示
'''
ylowlim= self._ylowlim
yhighlim= self._yhighlim
axes= self._Axes
mdindex= self._xparams['mdindex']
wdindex= self._xparams['wdindex']
# 每月第一个交易日
for iy in [ylowlim*1.1, yhighlim/1.21]:
for ix in mdindex:
newlab= axes.text(ix-1, iy, self._dates[ix])
newlab.set_font_properties(__font_properties__)
newlab.set_color('0.3')
newlab.set_fontsize(4)
newlab.set_rotation('vertical')
# newlab.set_horizontalalignment('left')
# newlab.set_verticalalignment('bottom')
# newlab.set_verticalalignment('center')
newlab.set_zorder(0) # XXX: 放在底层
# 每周第一个交易日,根据这个可以推算出全部确切的日期。
# for iy in minorticks[0:-1:6]:
for iy in [ylowlim*1.01, yhighlim/1.09]:
for ix in wdindex:
newlab= axes.text(ix-0.8, iy, self._dates[ix])
newlab.set_font_properties(__font_properties__)
newlab.set_color('0.3')
newlab.set_fontsize(3)
newlab.set_rotation('vertical')
# newlab.set_horizontalalignment('left')
# newlab.set_verticalalignment('top') # 不行
# newlab.set_verticalalignment('center')
# newlab.set_verticalalignment('bottom')
newlab.set_zorder(0) # XXX: 放在底层
def plot_pricenotes(self):
# 价格数值在图中间的显示
#==================================================================================================================================================
quotes= self._pdata[u'行情']
axes= self._Axes
majorticks= self._ytickset['major']
minorticks= self._ytickset['minor']
mdindex= self._xparams['mdindex']
def price_note(num):
return str(round(num/1000.0, 2))
if u'开盘二' in quotes:
majorticks_2= self._ytickset['major_2']
minorticks_2= self._ytickset['minor_2']
for iy, iy2 in zip(sorted(majorticks[:-1] + minorticks[1:-1]), sorted(majorticks_2[:-1] + minorticks_2[1:-1])):
for ix in mdindex[1:-1:3]:
newlab= axes.text(ix+6, iy*1.001, price_note(iy) + ' / ' + price_note(iy2))
newlab.set_font_properties(__font_properties__)
newlab.set_color('0.3')
newlab.set_fontsize(3)
newlab.set_zorder(0) # XXX: 放在底层
else:
for iy in sorted(majorticks[:-1] + minorticks[1:-1]):
for ix in mdindex[1:-1:3]:
newlab= axes.text(ix+9, iy*1.001, price_note(iy))
newlab.set_font_properties(__font_properties__)
newlab.set_color('0.3')
newlab.set_fontsize(3)
newlab.set_zorder(0) # XXX: 放在底层
class SubPlot_TORateBase:
'''
换手率子图
'''
def __init__(self, pdata, parent, xparams, name):
self._name= name
self._pdata= pdata
self._parent= parent
self._xparams= xparams
self._shrink= __shrink__ if name == 'toratefs' else 1.0
self._tostep= 0 # 每一格代表的换手率数值
self._yrange= 0
self._xsize= 0 # int
self._ysize= 0 # int
self._Axes= None
self._AxisX= None
self._AxisY= None
if u'换手率二' in pdata[u'行情']:
self._Axes_2= None
self._AxisX_2= None
self._AxisY_2= None
self._tostep_2= 0
# 绘图数据
quotes= pdata[u'行情']
if name == 'toratefs':
self._dates= quotes[u'日期']
self._open= quotes[u'开盘']
self._close= quotes[u'收盘']
self._high= quotes[u'最高']
self._low= quotes[u'最低']
if u'简化' in quotes: self._simple= quotes[u'简化']
if u'换手率' in quotes: self._torate= quotes[u'换手率']
if u'成交量' in quotes: self._volume= quotes[u'成交量']
if u'成交额' in quotes: self._turnover= quotes[u'成交额']
if u'开盘二' in quotes:
self._open_2= quotes[u'开盘二']
self._close_2= quotes[u'收盘二']
self._high_2= quotes[u'最高二']
self._low_2= quotes[u'最低二']
if u'简化二' in quotes: self._simple_2= quotes[u'简化二']
if u'换手率二' in quotes: self._torate_2= quotes[u'换手率二']
if u'成交量二' in quotes: self._volume_2= quotes[u'成交量二']
if u'成交额二' in quotes: self._turnover_2= quotes[u'成交额二']
else:
sidx, eidx= pdata[u'任务描述'][u'起始偏移'], pdata[u'任务描述'][u'结束偏移']
self._dates= quotes[u'日期'][sidx:eidx]
self._open= quotes[u'开盘'][sidx:eidx]
self._close= quotes[u'收盘'][sidx:eidx]
self._high= quotes[u'最高'][sidx:eidx]
self._low= quotes[u'最低'][sidx:eidx]
if u'简化' in quotes: self._simple= quotes[u'简化'][sidx:eidx]
if u'换手率' in quotes: self._torate= quotes[u'换手率'][sidx:eidx]
if u'成交量' in quotes: self._volume= quotes[u'成交量'][sidx:eidx]
if u'成交额' in quotes: self._turnover= quotes[u'成交额'][sidx:eidx]
if u'开盘二' in quotes:
self._open_2= quotes[u'开盘二'][sidx:eidx]
self._close_2= quotes[u'收盘二'][sidx:eidx]
self._high_2= quotes[u'最高二'][sidx:eidx]
self._low_2= quotes[u'最低二'][sidx:eidx]
if u'简化二' in quotes: self._simple_2= quotes[u'简化二'][sidx:eidx]
if u'换手率二' in quotes: self._torate_2= quotes[u'换手率二'][sidx:eidx]
if u'成交量二' in quotes: self._volume_2= quotes[u'成交量二'][sidx:eidx]
if u'成交额二' in quotes: self._turnover_2= quotes[u'成交额二'][sidx:eidx]
# 衍生数据
#==============================================================================================================
self._length= len(self._dates)
self._xindex= numpy.arange(self._length) # X 轴上的 index,一个辅助数据
self._zipoc= zip(self._open, self._close)
self._up= numpy.array( [ True if po < pc and po is not None else False for po, pc in self._zipoc] ) # 标示出该天股价日内上涨的一个序列
self._down= numpy.array( [ True if po > pc and po is not None else False for po, pc in self._zipoc] ) # 标示出该天股价日内下跌的一个序列
self._side= numpy.array( [ True if po == pc and po is not None else False for po, pc in self._zipoc] ) # 标示出该天股价日内走平的一个序列
if u'开盘二' in quotes:
self._zipoc_2= zip(self._open_2, self._close_2)
self._up_2= numpy.array( [ True if po < pc and po is not None else False for po, pc in self._zipoc_2] ) # 标示出该天股价日内上涨的一个序列
self._down_2= numpy.array( [ True if po > pc and po is not None else False for po, pc in self._zipoc_2] ) # 标示出该天股价日内下跌的一个序列
self._side_2= numpy.array( [ True if po == pc and po is not None else False for po, pc in self._zipoc_2] ) # 标示出该天股价日内走平的一个序列
self._compute_size()
def _compute_size(self):
'''
根据 pdata 计算自身尺寸
'''
def _compute_step(maxto):
'''
maxto 是 换手率 最大值。返回每格单位(最小 500, 代表 0.5%)以及格数
'''
for i in range(9):
if maxto > (4 * 500 * (2**i)): # 换手率最大是 100000, 代表 100%
continue
else:
tostep= 500 * (2**i)
tosize= int(round((maxto + tostep/2.0 - 1) / float(tostep), 0))
break
return (tostep, tosize)
quotes= self._pdata[u'行情']
xmargin= self._xparams['xmargin']
self._xsize= (self._length + xmargin*2) * self._shrink
maxto= max(self._torate)
self._tostep, self._yrange= _compute_step(maxto=maxto)
if u'换手率二' in quotes:
maxto_2= max(self._torate_2)
self._tostep_2, yrange_2= _compute_step(maxto=maxto_2)
self._yrange= max(self._yrange, yrange_2) # 成交量部分在 Y 轴所占的 “份数”
self._ysize= self._yrange * self._shrink
def get_size(self):
return (self._xsize, self._ysize)
def build_axes(self, figobj, rect):
# 第一只:添加 Axes 对象
#==================================================================================================================================================
axes= figobj.add_axes(rect, axis_bgcolor='black')
axes.set_axis_bgcolor('black')
axes.set_axisbelow(True) # 网格线放在底层
# 第一只:改变坐标线的颜色
#==================================================================================================================================================
for child in axes.get_children():
if isinstance(child, matplotlib.spines.Spine):
child.set_color(__color_gold__)
# child.set_zorder(3) # XXX: 放在上层,好像没什么用。
# 得到 X 轴 和 Y 轴 的两个 Axis 对象
#==================================================================================================================================================
xaxis= axes.get_xaxis()
yaxis= axes.get_yaxis()
# 设置两个坐标轴上的 grid
#==================================================================================================================================================
xaxis.grid(True, 'major', color='0.3', linestyle='solid', linewidth=0.2)
xaxis.grid(True, 'minor', color='0.3', linestyle='dotted', linewidth=0.1)
yaxis.grid(True, 'major', color='0.3', linestyle='solid', linewidth=0.2)
yaxis.grid(True, 'minor', color='0.3', linestyle='solid', linewidth=0.1)
self._Axes= axes
self._AxisX= xaxis
self._AxisY= yaxis
if u'换手率二' in self._pdata[u'行情']:
# 添加 Axes 对象
#==================================================================================================================================================
axes_2= axes.twinx()
# XXX: 下面这三行把第一个 axes 放在上面,这样不会被第二个 axes 的图形遮盖。用 zorder 不顶用。
axes.figure.axes[-2:]= [axes_2, axes] # XXX: 把第一个 axes 放在上面,用 zorder 不顶用。
axes.set_frame_on(False) # 如果不做此设定,axes_2 的内容会看不见
axes_2.set_frame_on(True)
axes_2.set_axis_bgcolor('black')
axes_2.set_axisbelow(True) # 网格线放在底层
# 改变坐标线的颜色
#==================================================================================================================================================
for child in axes_2.get_children():
if isinstance(child, matplotlib.spines.Spine):
child.set_color(__color_gold__)
# 得到 X 轴 和 Y 轴 的两个 Axis 对象
#==================================================================================================================================================
xaxis_2= axes_2.get_xaxis()
yaxis_2= axes_2.get_yaxis()
# 设置网格线
#==================================================================================================================================================
# xaxis_2.grid(True, 'major', color='0.3', linestyle='solid', linewidth=0.2)
# xaxis_2.grid(True, 'minor', color='0.3', linestyle='dotted', linewidth=0.1)
# yaxis_2.grid(True, 'major', color='0.3', linestyle='solid', linewidth=0.2)
# yaxis_2.grid(True, 'minor', color='0.3', linestyle='dotted', linewidth=0.1)
self._Axes_2= axes_2
self._AxisX_2= xaxis_2
self._AxisY_2= yaxis_2
def get_axes(self):
return self._Axes
def plot(self):
'''
绘制换手率图形
'''
self.plot_torate()
self.set_xticks()
self.set_yticks()
if u'换手率二' in self._pdata[u'行情']:
self.plot_torate_2()
self.set_xticks_2()
self.set_yticks_2()
def plot_torate(self):
'''
绘制换手率
'''
xindex= self._xindex
stopset= self._xparams['mdindex'] if self._name == 'torate' else self._xparams['sdindex']
axes= self._Axes
up= self._up
down= self._down
side= self._side
rarray_to= numpy.array(self._torate)
tozeros= numpy.zeros(self._length) # 辅助数据
lwidth= 3.0 if self._name == 'torate' else 2.4 * self._shrink
# XXX: 如果 up/down/side 各项全部为 False,那么 vlines() 会报错。
if True in up:
axes.vlines(xindex[up], tozeros[up], rarray_to[up], edgecolor='red', linewidth=lwidth, label='_nolegend_', alpha=0.5)
if True in down:
axes.vlines(xindex[down], tozeros[down], rarray_to[down], edgecolor='green', linewidth=lwidth, label='_nolegend_', alpha=0.5)
if True in side:
axes.vlines(xindex[side], tozeros[side], rarray_to[side], edgecolor='0.7', linewidth=lwidth, label='_nolegend_', alpha=0.5)
# 绘制平均换手率(直线)
toeffect= [num for num in self._torate if num is not None]
toaverage= sum(toeffect) / float(len(toeffect))
axes.plot([-1, self._length], [toaverage, toaverage], '-', color='yellow', linewidth=0.2, alpha=0.7)
# 换手率数值在图中间的显示
#==================================================================================================================================================
for ix in stopset[2:-1:3]:
newlab= axes.text(ix+8, toaverage, str(round(toaverage/1000.0, 2)) + '%')
newlab.set_font_properties(__font_properties__)
newlab.set_color('yellow')
newlab.set_fontsize(3)
# newlab.set_zorder(0) # XXX: 放在底层
# newlab.set_verticalalignment('center')
def plot_torate_2(self):
'''
绘制第二条换手率柱状图
'''
quotes= self._pdata[u'行情']
xindex= self._xindex
axes= self._Axes_2
up= self._up_2
down= self._down_2
side= self._side_2
rarray_to= numpy.array(self._torate_2)
tozeros= numpy.zeros(self._length) # 辅助数据
lwidth, alpha= (0.7, 0.5) if self._name == 'torate' else (0.3, 0.7)
# XXX: 如果 up/down/side 各项全部为 False,那么 vlines() 会报错。
if True in up:
axes.vlines(xindex[up], tozeros[up], rarray_to[up], edgecolor='0.7', linewidth=lwidth, label='_nolegend_', alpha=alpha)
if True in down:
axes.vlines(xindex[down], tozeros[down], rarray_to[down], edgecolor='0.3', linewidth=lwidth, label='_nolegend_', alpha=alpha)
if True in side:
axes.vlines(xindex[side], tozeros[side], rarray_to[side], edgecolor='0.7', linewidth=lwidth, label='_nolegend_', alpha=1.0)
def set_xticks(self):
'''
X 轴坐标
'''
length= self._length
xmargin= self._xparams['xmargin']
axes= self._Axes
xaxis= self._AxisX
# xaxis.set_tick_params(which='both', direction='out') # XXX: 坐标点设到外面去,也可以用 Axes.tick_params(),好像 matplotlib 1.0.1 才有
# 设定 X 轴坐标的范围
#==================================================================================================================================================
axes.set_xlim(-xmargin, length + xmargin)
xMajorLocator= self._xparams['xMajorLocator']
xMinorLocator= self._xparams['xMinorLocator']
xMajorFormatter= self._xparams['xMajorFormatter']
xMinorFormatter= self._xparams['xMinorFormatter']
# 设定 X 轴的 Locator 和 Formatter
xaxis.set_major_locator(xMajorLocator)
xaxis.set_minor_locator(xMinorLocator)
if self._name == 'torate':
xaxis.set_major_formatter(xMajorFormatter)
xaxis.set_minor_formatter(xMinorFormatter)
# 设定 X 轴主要坐标点与辅助坐标点的样式
for mal in axes.get_xticklabels(minor=False):
mal.set_fontsize(4)
mal.set_horizontalalignment('right')
mal.set_rotation('45')
for mil in axes.get_xticklabels(minor=True):
mil.set_fontsize(4)
mil.set_color('blue')
mil.set_horizontalalignment('right')
mil.set_rotation('45')
else:
# 设为不可见
for mal in axes.get_xticklabels(minor=False):
mal.set_visible(False)
for mil in axes.get_xticklabels(minor=True):
mil.set_visible(False)
def set_xticks_2(self):
length= self._length
xmargin= self._xparams['xmargin']
axes= self._Axes_2
xaxis= self._AxisX_2
# xaxis.set_tick_params(which='both', direction='out') # XXX: 坐标点设到外面去,也可以用 Axes.tick_params(),好像 matplotlib 1.0.1 才有
# 设定 X 轴坐标的范围
#==================================================================================================================================================
axes.set_xlim(-xmargin, length + xmargin)
xMajorLocator= self._xparams['xMajorLocator']
xMinorLocator= self._xparams['xMinorLocator']
# 设定 X 轴的 Locator 和 Formatter
xaxis.set_major_locator(xMajorLocator)
xaxis.set_minor_locator(xMinorLocator)
# 设为不可见
for mal in axes.get_xticklabels(minor=False):
mal.set_visible(False)
for mil in axes.get_xticklabels(minor=True):
mil.set_visible(False)
def set_yticks(self):
'''
设置 Y 轴坐标
'''
axes= self._Axes
yaxis= self._AxisY
tostep= self._tostep
yrange= self._yrange
stopset= self._xparams['mdindex'] if self._name == 'torate' else self._xparams['sdindex']
# 设定换手率 Y 轴坐标的范围
#==================================================================================================================================================
axes.set_ylim(0, tostep*yrange)
# 主要坐标点
#==================================================================================================================================================
majorticks= [tostep*i for i in range(yrange)]
yMajorLocator= FixedLocator(numpy.array(majorticks))
# 确定 Y 轴的 MajorFormatter
def y_major_formatter(num, pos=None):
return str(round(num/1000.0, 2)) + '%'
yMajorFormatter= FuncFormatter(y_major_formatter)
# 确定 Y 轴的 MinorFormatter
yMinorFormatter= NullFormatter()
# 第一只:设定 X 轴的 Locator 和 Formatter
yaxis.set_major_locator(yMajorLocator)
yaxis.set_major_formatter(yMajorFormatter)
# 设定 Y 轴主要坐标点的样式
for mal in axes.get_yticklabels(minor=False):
mal.set_font_properties(__font_properties__)
mal.set_fontsize(5) # 这个必须放在前一句后面,否则作用会被覆盖
# 辅助坐标点
#==================================================================================================================================================
if self._name == 'torate':
minorticks= list( itertools.chain.from_iterable( mi for mi in [[ma + (tostep/4.0)*i for i in range(1, 4)] for ma in majorticks] ) )
yMinorLocator= FixedLocator(numpy.array(minorticks))
yaxis.set_minor_locator(yMinorLocator)
def y_minor_formatter(num, pos=None):
return str(round(num/1000.0, 3)) + '%'
yMinorFormatter= FuncFormatter(y_minor_formatter)
yaxis.set_minor_formatter(yMinorFormatter)
# 设定 Y 轴主要坐标点的样式
for mil in axes.get_yticklabels(minor=True):
mil.set_font_properties(__font_properties__)
mil.set_fontsize(4) # 这个必须放在前一句后面,否则作用会被覆盖
else:
# minorticks= list( itertools.chain.from_iterable( mi for mi in [[ma + (tostep/4.0)*i for i in range(1, 4)] for ma in majorticks] ) )
minorticks= list( [ma + (tostep/2.0) for ma in majorticks] )
yMinorLocator= FixedLocator(numpy.array(minorticks))
yaxis.set_minor_locator(yMinorLocator)
# 设定 Y 轴主要坐标点的样式
for mil in axes.get_yticklabels(minor=True):
mil.set_visible(False)
# 换手率数值在图中间的显示
#==================================================================================================================================================
for iy in range(int(tostep/2.0), tostep*yrange, int(tostep/2.0)):
for ix in stopset[1:-1:3]:
newlab= axes.text(ix+8, iy, y_major_formatter(iy))
newlab.set_font_properties(__font_properties__)
newlab.set_color('0.3')
newlab.set_fontsize(3)
newlab.set_zorder(0) # XXX: 放在底层
# newlab.set_verticalalignment('center')
def set_yticks_2(self):
'''
设置 Y 轴坐标
'''
axes= self._Axes_2
yaxis= self._AxisY_2
tostep= self._tostep_2
yrange= self._yrange # 与 1 是一样的
# 设定换手率 Y 轴坐标的范围
#==================================================================================================================================================
axes.set_ylim(0, tostep*yrange)
# 主要坐标点
#==================================================================================================================================================
majorticks= [tostep*i for i in range(yrange)]
yMajorLocator= FixedLocator(numpy.array(majorticks))
# 确定 Y 轴的 MajorFormatter
def y_major_formatter(num, pos=None):
return str(round(num/1000.0, 2)) + '%'
yMajorFormatter= FuncFormatter(y_major_formatter)
# 确定 Y 轴的 MinorFormatter
yMinorFormatter= NullFormatter()
# 第一只:设定 X 轴的 Locator 和 Formatter
yaxis.set_major_locator(yMajorLocator)
yaxis.set_major_formatter(yMajorFormatter)
# 设定 Y 轴主要坐标点的样式
for mal in axes.get_yticklabels(minor=False):
mal.set_font_properties(__font_properties__)
mal.set_fontsize(5) # 这个必须放在前一句后面,否则作用会被覆盖
# 辅助坐标点
#==================================================================================================================================================
if self._name == 'torate':
minorticks= list( itertools.chain.from_iterable( mi for mi in [[ma + (tostep/4.0)*i for i in range(1, 4)] for ma in majorticks] ) )
yMinorLocator= FixedLocator(numpy.array(minorticks))
def y_minor_formatter(num, pos=None):
return str(round(num/1000.0, 3)) + '%'
yMinorFormatter= FuncFormatter(y_minor_formatter)
yaxis.set_minor_locator(yMinorLocator)
yaxis.set_minor_formatter(yMinorFormatter)
# 设定 Y 轴主要坐标点的样式
for mil in axes.get_yticklabels(minor=True):
mil.set_font_properties(__font_properties__)
mil.set_fontsize(4) # 这个必须放在前一句后面,否则作用会被覆盖
else:
minorticks= list( [ma + (tostep/2.0) for ma in majorticks] )
yMinorLocator= FixedLocator(numpy.array(minorticks))
yaxis.set_minor_locator(yMinorLocator)
# 设定 Y 轴主要坐标点的样式
for mil in axes.get_yticklabels(minor=True):
mil.set_visible(False)
class SubPlot_TORate(SubPlot_TORateBase):
pass
class SubPlot_TORateFullSpan(SubPlot_TORateBase):
pass
class MyFigure:
'''
'''
def __init__(self, pdata):
self._pdata= pdata # 绘图数据
self._figfacecolor= __color_pink__
self._figedgecolor= __color_navy__
self._figdpi= 300
self._figlinewidth= 1.0
self._xfactor= 10.0 / 230.0 # x size * x factor = x length
self._yfactor= 0.3 # y size * y factor = y length
jobstat= pdata[u'任务描述']
self._xsize_left= 12.0 # left blank
self._xsize_right= 12.0 # right blank
self._ysize_top= 0.3 # top blank
self._ysize_bottom= 1.2 # bottom blank
self._ysize_gap1= 0.2
self._ysize_gap2= 0.3 if (jobstat[u'历史价格子图'] or jobstat[u'历史换手率子图'] or jobstat[u'财务指标子图']) else 0.0
# 建立 X 轴参数
#===============================================================================================================
if jobstat[u'价格子图'] or jobstat[u'换手率子图']:
xparams= {'xmargin': 1}
xparams.update(self._compute_xparams()) # 与 X 轴坐标点相关的数据结构
if jobstat[u'历史价格子图'] or jobstat[u'历史换手率子图'] or jobstat[u'财务指标子图']:
xparams_fs= {'xmargin': 3}
xparams_fs.update(self._compute_xparams_fullspan())
# 建立子图对象
#===============================================================================================================
self._subplots= {}
if jobstat[u'公司信息子图']:
name= 'basic'
self._subplots[name]= SubPlot_BasicInfo(pdata=pdata, parent=self, name=name)
if jobstat[u'历史价格子图']: # XXX: 这个要放在 价格子图 前面,因为后者可能会用到它的 Y 轴坐标点位置
name= 'pricefs'
self._subplots[name]= SubPlot_PriceFullSpan(pdata=pdata, parent=self, xparams=xparams_fs, name=name)
if jobstat[u'价格子图']:
name= 'price'
self._subplots[name]= SubPlot_Price(pdata=pdata, parent=self, xparams=xparams, name=name)
if jobstat[u'财务指标子图']:
name= 'financial'
self._subplots[name]= SubPlot_Financial(pdata=pdata, parent=self, xparams=xparams_fs, name=name)
if jobstat[u'换手率子图']:
name= 'torate'
self._subplots[name]= SubPlot_TORate(pdata=pdata, parent=self, xparams=xparams, name=name)
if jobstat[u'历史换手率子图']:
name= 'toratefs'
self._subplots[name]= SubPlot_TORateFullSpan(pdata=pdata, parent=self, xparams=xparams_fs, name=name)
# 根据子图对象的尺寸计算自身的尺寸
#===============================================================================================================
self._xsize, \
self._ysize= self._compute_size()
self._xlength= self._xsize * self._xfactor
self._ylength= self._ysize * self._yfactor
# 根据计算出的尺寸建立 Figure 对象
#===============================================================================================================
self._Fig= pyplot.figure(figsize=(self._xlength, self._ylength), dpi=self._figdpi, facecolor=self._figfacecolor, \
edgecolor=self._figedgecolor, linewidth=self._figlinewidth) # Figure 对象
# 用新建立的 Figure 对象交给子图对象,完成子图对象的初始化
#===============================================================================================================
rects= self._compute_rect()
if 'basic' in self._subplots:
self._subplots['basic'].build_axes(figobj=self._Fig, rect=rects['basic'])
# XXX: 这个要放在 price 前面,因为后者要用到它的 Axes 对象
if 'torate' in self._subplots:
self._subplots['torate'].build_axes(figobj=self._Fig, rect=rects['torate'])
if 'price' in self._subplots:
self._subplots['price'].build_axes(figobj=self._Fig, rect=rects['price'])
# XXX: 这个要放在 pricefs 前面
if 'toratefs' in self._subplots:
self._subplots['toratefs'].build_axes(figobj=self._Fig, rect=rects['toratefs'])
if 'pricefs' in self._subplots:
self._subplots['pricefs'].build_axes(figobj=self._Fig, rect=rects['pricefs'])
def _compute_size(self):
'''
根据子图的尺寸计算自身尺寸
'''
pdata= self._pdata
jobstat= pdata[u'任务描述']
x_left, x_right= self._xsize_left, self._xsize_right
y_top, y_bottom= self._ysize_top, self._ysize_bottom
y_gap1= self._ysize_gap1
y_gap2= self._ysize_gap2
x_basic, y_basic= self._subplots['basic'].get_size() if 'basic' in self._subplots else (0.0, 0.0)
x_price, y_price= self._subplots['price'].get_size() if 'price' in self._subplots else (0.0, 0.0)
x_pricefs, y_pricefs= self._subplots['pricefs'].get_size() if 'pricefs' in self._subplots else (0.0, 0.0)
x_torate, y_torate= self._subplots['torate'].get_size() if 'torate' in self._subplots else (0.0, 0.0)
x_toratefs, y_toratefs= self._subplots['toratefs'].get_size() if 'toratefs' in self._subplots else (0.0, 0.0)
x_financial, y_financial= self._subplots['financial'].get_size() if 'financial' in self._subplots else (0.0, 0.0)
x_all= x_left + max(x_price, x_basic, x_pricefs) + x_right
y_all= y_top + y_basic + y_gap1 + y_pricefs + y_toratefs + y_financial + y_gap2 + y_price + y_torate + y_bottom
return (x_all, y_all)
def get_sizeset(self):
sizeset= {
'x': self._xsize,
'y': self._ysize,
'top': self._ysize_top,
'bottom': self._ysize_bottom,
'left': self._xsize_left,
'right': self._xsize_right
}
return sizeset
def _compute_rect(self):
'''
'''
pdata= self._pdata
jobstat= pdata[u'任务描述']
x_left= self._xsize_left
x_right= self._xsize_right
y_top= self._ysize_top
y_bottom= self._ysize_bottom
x_all= self._xsize
y_all= self._ysize
y_gap1= self._ysize_gap1 # basic 与 financial 之间的空隙
y_gap2= self._ysize_gap2 # toratefs 与 price 之间的空隙
x_basic, y_basic= self._subplots['basic'].get_size() if 'basic' in self._subplots else (0.0, 0.0)
x_price, y_price= self._subplots['price'].get_size() if 'price' in self._subplots else (0.0, 0.0)
x_pricefs, y_pricefs= self._subplots['pricefs'].get_size() if 'pricefs' in self._subplots else (0.0, 0.0)
x_torate, y_torate= self._subplots['torate'].get_size() if 'torate' in self._subplots else (0.0, 0.0)
x_toratefs, y_toratefs= self._subplots['toratefs'].get_size() if 'toratefs' in self._subplots else (0.0, 0.0)
x_financial, y_financial= self._subplots['financial'].get_size() if 'financial' in self._subplots else (0.0, 0.0)
rects= {}
if 'basic' in self._subplots:
rect= ((x_left + (x_all-x_left-x_right-x_basic)/2) / x_all, (y_all - y_top - y_basic)/y_all, x_basic/x_all, y_basic/y_all) # K线图部分
rects['basic']= rect
if 'price' in self._subplots:
rect= ((x_left + (x_all-x_left-x_right-x_price)/2) / x_all, (y_bottom + y_torate)/y_all, x_price/x_all, y_price/y_all) # K线图部分
rects['price']= rect
if 'torate' in self._subplots:
rect= ((x_left + (x_all-x_left-x_right-x_torate)/2)/x_all, y_bottom/y_all, x_torate/x_all, y_torate/y_all) # 成交量部分
rects['torate']= rect
if 'pricefs' in self._subplots:
rect= ((x_left + (x_all-x_left-x_right-x_pricefs)/2)/x_all, (y_all - y_top - y_basic - y_gap1 - y_pricefs)/y_all, x_pricefs/x_all, y_pricefs/y_all)
rects['pricefs']= rect
if 'toratefs' in self._subplots:
rect= ((x_left + (x_all-x_left-x_right-x_toratefs)/2)/x_all, (y_bottom + y_torate + y_price + y_gap2)/y_all, x_toratefs/x_all, y_toratefs/y_all)
rects['toratefs']= rect
return rects
def _compute_xparams(self):
'''
主要坐标点是每月第一个交易日,辅助坐标点是每周第一个交易日
'''
quotes= self._pdata[u'行情']
sidx= self._pdata[u'任务描述'][u'起始偏移']
eidx= self._pdata[u'任务描述'][u'结束偏移']
# 设定 X 轴上的坐标
#==================================================================================================================================================
datelist= [ datetime.date(int(ys), int(ms), int(ds)) for ys, ms, ds in [ dstr.split('-') for dstr in quotes[u'日期'][sidx:eidx] ] ]
# 确定 X 轴的 MajorLocator
mdindex= [] # 每个月第一个交易日在所有日期列表中的 index
allyears= set([d.year for d in datelist]) # 所有的交易年份
for yr in sorted(allyears):
allmonths= set([d.month for d in datelist if d.year == yr]) # 当年所有的交易月份
for mon in sorted(allmonths):
monthday= min([dt for dt in datelist if dt.year==yr and dt.month==mon]) # 当月的第一个交易日
mdindex.append(datelist.index(monthday))
xMajorLocator= FixedLocator(numpy.array(mdindex))
# 确定 X 轴的 MinorLocator
wdindex= {} # value: 每周第一个交易日在所有日期列表中的 index; key: 当周的序号 week number(当周是第几周)
for d in datelist:
isoyear, weekno= d.isocalendar()[0:2]
dmark= isoyear*100 + weekno
if dmark not in wdindex:
wdindex[dmark]= datelist.index(d)
wdindex= sorted(wdindex.values())
xMinorLocator= FixedLocator(numpy.array(wdindex))
# 确定 X 轴的 MajorFormatter 和 MinorFormatter
def x_major_formatter(idx, pos=None):
return datelist[idx].strftime('%Y-%m-%d')
def x_minor_formatter(idx, pos=None):
return datelist[idx].strftime('%m-%d')
xMajorFormatter= FuncFormatter(x_major_formatter)
xMinorFormatter= FuncFormatter(x_minor_formatter)
return {'xMajorLocator': xMajorLocator,
'xMinorLocator': xMinorLocator,
'xMajorFormatter': xMajorFormatter,
'xMinorFormatter': xMinorFormatter,
'mdindex': mdindex,
'wdindex': wdindex
}
def _compute_xparams_fullspan(self):
'''
主要坐标点是每季第一个交易日,辅助坐标点是每月第一个交易日。是给宏观子图用的。
'''
quotes= self._pdata[u'行情']
datelist= [ datetime.date(int(ys), int(ms), int(ds)) for ys, ms, ds in [ dstr.split('-') for dstr in quotes[u'日期'] ] ]
# 确定 X 轴的 MinorLocator
mdindex= [] # 每个月第一个交易日在所有日期列表中的 index
sdindex= [] # 每季度第一个交易日在所有日期列表中的 index
ydindex= [] # 每年第一个交易日在所有日期列表中的 index
allyears= set([d.year for d in datelist]) # 所有的交易年份
for yr in sorted(allyears):
allmonths= set([d.month for d in datelist if d.year == yr]) # 当年所有的交易月份
for mon in sorted(allmonths):
monthday= min([dt for dt in datelist if dt.year==yr and dt.month==mon]) # 当月的第一个交易日
idx= datelist.index(monthday)
if mon in (1, 4, 7, 10):
sdindex.append(idx)
if mon == 1:
ydindex.append(idx)
else:
mdindex.append(idx)
xMajorLocator= FixedLocator(numpy.array(sdindex))
xMinorLocator= FixedLocator(numpy.array(mdindex))
# 确定 X 轴的 MajorFormatter 和 MinorFormatter
def x_major_formatter(idx, pos=None):
return datelist[idx].strftime('%Y-%m-%d')
def x_minor_formatter(idx, pos=None):
return datelist[idx].strftime('%m-%d')
xMajorFormatter= FuncFormatter(x_major_formatter)
xMinorFormatter= FuncFormatter(x_minor_formatter)
return {'xMajorLocator': xMajorLocator,
'xMinorLocator': xMinorLocator,
'xMajorFormatter': xMajorFormatter,
'xMinorFormatter': xMinorFormatter,
'sdindex': sdindex,
'mdindex': mdindex,
'ydindex': ydindex
}
def plot(self):
'''
'''
# self.plot_title()
# 调用子图对象的绘图函数
if 'basic' in self._subplots:
self._subplots['basic'].plot()
if 'price' in self._subplots:
self._subplots['price'].plot()
if 'torate' in self._subplots:
self._subplots['torate'].plot()
if 'pricefs' in self._subplots:
self._subplots['pricefs'].plot()
if 'toratefs' in self._subplots:
self._subplots['toratefs'].plot()
def plot_title(self):
'''
绘制整个 Figure 的标题
'''
info= self._pdata[u'公司信息']
figobj= self._Fig
# 整个 figure 的标题
subtitle= (info[u'代码'] + ' ' if u'代码' in info else '') + info[u'简称']
subtitle_2= (info[u'代码二'] + ' ' if u'代码二' in info else '') + info[u'简称二']
figobj.suptitle(subtitle + ' / ' + subtitle_2, fontsize=12, fontproperties=__font_properties__)
def savefig(self, figpath):
'''
保存图片
'''
self._Fig.savefig(figpath, dpi=self._figdpi, facecolor=self._figfacecolor, edgecolor=self._figedgecolor, linewidth=self._figlinewidth)
if __name__ == '__main__':
# pfile 指明存放绘图数据的 pickle file,figpath 指定图片需存放的路径
pfile= sys.argv[1]
figpath= sys.argv[2]
# 绘图数据 pdata
fileobj= open(name=pfile, mode='rb')
pdata= pickle.load(fileobj)
fileobj.close()
os.remove(pfile)
myfig= MyFigure(pdata=pdata)
myfig.plot()
myfig.savefig(figpath=figpath)
Python + 股票: 个股资讯表

---- 以上是 Vim 在全屏模式下的截图。全屏模式下 Vim 没有了程序标签栏,并且覆盖了 OS 的系统任务栏。用来切换全屏模式的按键定义:
nnoremap <S-F10> :silent !wmctrl -r :ACTIVE: -b toggle,fullscreen<CR>
需要外部命令 wmctrl 可用。感谢 闲耘,是从他的 vimrc 里抄来的。
---- 基本搞定了个股资讯表。内容包括新闻动态、重大事项、公司公告。
---- 表的结构:<代码> <日期> <时间> <类型> <来源> <序号> <内容> <属性>。下面一条查询语句:
SELECT t1.代码, t1.日期, t1.时间, t1.类型, t1.来源, t1.序号, t1.内容, t1.属性 FROM 个股资讯 AS t1
JOIN (
	SELECT 代码, 类型, MAX(日期) AS 最大日期 FROM 个股资讯 GROUP BY 类型, 代码
) AS t2
ON t1.代码=t2.代码 AND t1.类型=t2.类型 AND t1.日期=t2.最大日期;
耗时 20 多秒,读出 12000 多条记录。不知道是否设计有问题,怎么会这么慢。眼下没时间深究,先这样吧。
---- Plotting 模块改用多进程也基本搞定,结果比预想的还要好。我的电脑是双核的,所以在主进程之外又建立两个工作进程来执行绘图任务。粗略统计,与单进程相比的速度提升在 120% ~ 130% 之间,现在绘制一幅图形大概只需要 3 到 4 秒。
---- 但是遇到一个神秘 bug,好久才搞定。好像必须给进程对象的建立留有足够的时间,否则进程跑起来会出问题。目前在程序里加了一个延时语句 sleep(0.3),看上去是好了。因为程序结构比较复杂,没心思去重现它了,能用就行,也先这样吧。
---- 接下来要把图形再优化一下,新的内容加进去。差不多了以后开始建日线统计表。
用 Python / Matplotlib 画出来的股票 K线图 (二)
---- 最新的在这里: 用 Python / Matplotlib 画出来的股票 K线图 (四)
---- 下一篇在这里: 用 Python / Matplotlib 画出来的股票 K线图 (三)
---- 上一版的改进,双股同列 + 无数细小改进,如下图。dpi= 300。明的一条是个股走势,暗的是同期的指数走势。这大概是近期最强的一只。
---- 要想培养对走势的感觉,采用固定比例尺的图形是必须的。一般股票软件里的图形都为显示方便而做了变形处理,用处不大。
---- 图形感觉差不多了,告一段落。接下来的目标是 股本结构、历史分配、行业板块、股东研究 这些信息,还包括个股资讯。实时的数据仍然暂时不碰。
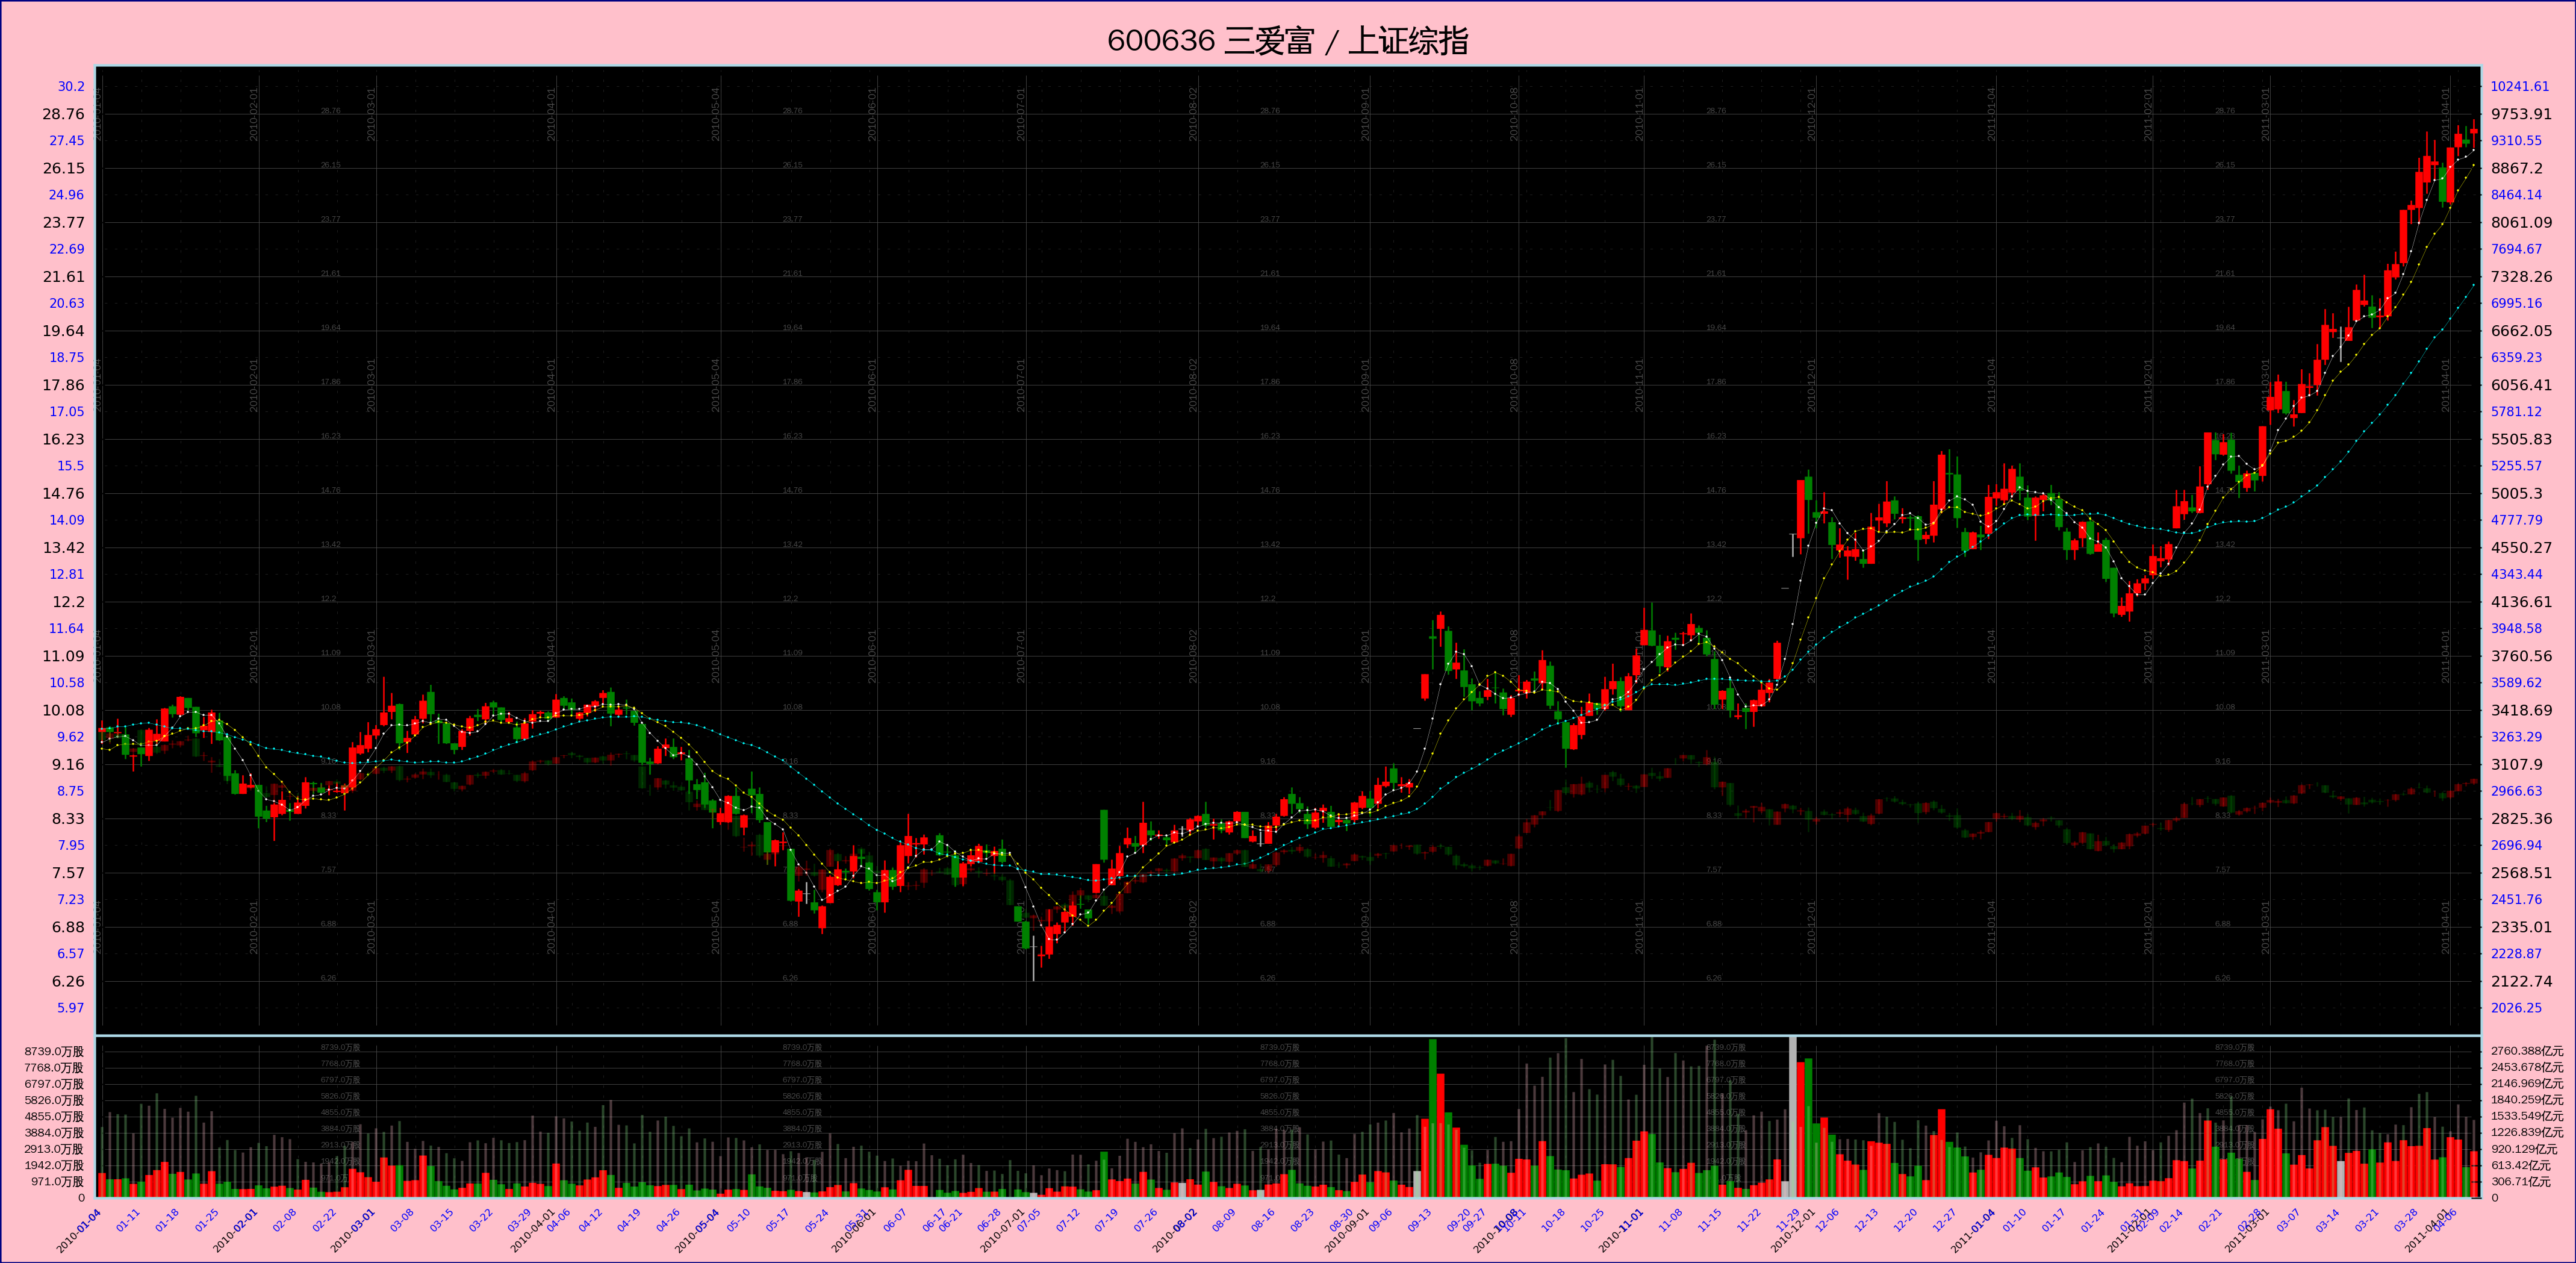
---- 源码贴出来。因为 Matplotlib 还不支持 Python3, 所以单写了一个 Python2 脚本。注意绘图数据是用 pickle file 传递的。
[补记:我决定放弃线性坐标了。这个脚本只支持对数坐标。]
# -*- coding: utf-8 -*-

import os
import sys
import pickle
import math
import datetime
import matplotlib

matplotlib.use("WXAgg", warn=True)	# 这个要紧跟在 import matplotlib 之后,而且必须安装了 wxpython 2.8 才行。

import matplotlib.pyplot as pyplot
import matplotlib.font_manager as font_manager

import numpy
from matplotlib.ticker import FixedLocator, MultipleLocator, FuncFormatter, NullFormatter


__font_properties__=font_manager.FontProperties(fname='/usr/share/fonts/truetype/wqy/wqy-zenhei.ttc')
__color_lightsalmon__= '#ffa07a'
__color_pink__= '#ffc0cb'
__color_navy__= '#000080'


def Plot(pfile, figpath):
	'''
	pfile 指明存放绘图数据的 pickle file,figpath 指定图片需存放的路径
	'''

	fileobj= open(name=pfile, mode='rb')
	pdata= pickle.load(fileobj)
	fileobj.close()
	os.remove(pfile)

	#	计算图片的尺寸(单位英寸)
	#	注意:Python2 里面, "1 / 10" 结果是 0, 必须写成 "1.0 / 10" 才会得到 0.1
	#==================================================================================================================================================
	length= len(pdata[u'日期'])		# 所有数据的长度,就是天数

	open_price_pri= pdata[u'开盘'][0]	# int 类型
	open_price_sec= pdata[u'开盘二'][0]	# 同上

	highest_price_pri= max( [phigh for phigh in pdata[u'最高'] if phigh != None] )		# 第一个行情的最高价
	highest_price_sec= max( [phigh for phigh in pdata[u'最高二'] if phigh != None] )	# 第二个行情的最高价
	highest_price= max(highest_price_pri, highest_price_sec*open_price_pri/open_price_sec)	# 以第一个行情为基准修正出的总最高价

	lowest_price_pri= min( [plow for plow in pdata[u'最低'] if plow != None] )	# 最低价
	lowest_price_sec= min( [plow for plow in pdata[u'最低二'] if plow != None] )	# 最低价
	lowest_price= min(lowest_price_pri, lowest_price_sec*open_price_pri/open_price_sec)	# 以第一个行情为基准修正出的总最低价


	yhighlim_price= int(highest_price * 1.1)	# K线子图 Y 轴最大坐标
	ylowlim_price=  int(lowest_price / 1.1)		# K线子图 Y 轴最小坐标


	xfactor= 10.0/230.0	# 一条 K 线的宽度在 X 轴上所占距离(英寸)
	yfactor= 0.3	# Y 轴上每一个距离单位的长度(英寸),这个单位距离是线性坐标和对数坐标通用的

	expbase= 1.1	# 底数,取得小一点,比较接近 1。股价 3 元到 4 元之间有大约 3 个单位距离

	# XXX: 价格在 Y 轴上的 “份数”。注意,虽然最高与最低价是以第一个行情为基准修正出来的,但其中包含的倍数因子对结果无影响,即:
	#	log(base, num1) - log(base, num2) ==
	#	log(base, num1/num2) ==
	#	log(base, k*num1/k*num2) ==
	#	log(base, k*num1) - log(base, k*num2)
	# ,这是对数运算的性质。
	ymulti_price= math.log(yhighlim_price, expbase)	- math.log(ylowlim_price, expbase)

	ymulti_vol= 3.0		# 成交量部分在 Y 轴所占的 “份数”
	ymulti_top= 1.2		# 顶部空白区域在 Y 轴所占的 “份数”
	ymulti_bot= 1.2		# 底部空白区域在 Y 轴所占的 “份数”

	xmulti_left= 12.0	# 左侧空白区域所占的 “份数”
	xmulti_right= 12.0	# 右侧空白区域所占的 “份数”

	xmulti_all= length + xmulti_left + xmulti_right
	xlen_fig= xmulti_all * xfactor		# 整个 Figure 的宽度
	ymulti_all= ymulti_price + ymulti_vol + ymulti_top + ymulti_bot
	ylen_fig= ymulti_all * yfactor		# 整个 Figure 的高度

	rect_1= (xmulti_left/xmulti_all, (ymulti_bot+ymulti_vol)/ymulti_all, length/xmulti_all, ymulti_price/ymulti_all)	# K线图部分
	rect_2= (xmulti_left/xmulti_all, ymulti_bot/ymulti_all, length/xmulti_all, ymulti_vol/ymulti_all)	# 成交量部分


	#	建立 Figure 对象
	#==================================================================================================================================================
	figfacecolor= __color_pink__
	figedgecolor= __color_navy__
	figdpi= 300
	figlinewidth= 1.0

	figobj= pyplot.figure(figsize=(xlen_fig, ylen_fig), dpi=figdpi, facecolor=figfacecolor, edgecolor=figedgecolor, linewidth=figlinewidth)	# Figure 对象

	# 整个 figure 的标题
	title_pri= (pdata[u'代码'] + ' ' if u'代码' in pdata else '') + pdata[u'简称']
	title_sec= (pdata[u'代码二'] + '   ' if u'代码二' in pdata else '') + pdata[u'简称二']

	figobj.suptitle(title_pri + ' / ' + title_sec, fontsize=12, fontproperties=__font_properties__)


	#==================================================================================================================================================
	#==================================================================================================================================================
	#=======
	#=======	XXX: 第一只:成交量部分
	#=======
	#==================================================================================================================================================
	#==================================================================================================================================================

	#	第一只:添加 Axes 对象
	#==================================================================================================================================================
	axes_2= figobj.add_axes(rect_2, axis_bgcolor='black')
	axes_2.set_axisbelow(True)	# 网格线放在底层

	#	第一只:改变坐标线的颜色
	#==================================================================================================================================================
	for child in axes_2.get_children():
		if isinstance(child, matplotlib.spines.Spine):
			child.set_color('lightblue')

	#	第一只:得到 X 轴 和 Y 轴 的两个 Axis 对象
	#==================================================================================================================================================
	xaxis_2= axes_2.get_xaxis()
	yaxis_2= axes_2.get_yaxis()

	#	第一只:设置两个坐标轴上的 grid
	#==================================================================================================================================================
	xaxis_2.grid(True, 'major', color='0.3', linestyle='solid', linewidth=0.2)
	xaxis_2.grid(True, 'minor', color='0.3', linestyle='dotted', linewidth=0.1)

	yaxis_2.grid(True, 'major', color='0.3', linestyle='solid', linewidth=0.2)
	yaxis_2.grid(True, 'minor', color='0.3', linestyle='dotted', linewidth=0.1)


	#==================================================================================================================================================
	#=======	第一只:成交量绘图
	#==================================================================================================================================================
	xindex= numpy.arange(length)	# X 轴上的 index,一个辅助数据

	zipoc= zip(pdata[u'开盘'], pdata[u'收盘'])
	up=   numpy.array( [ True if po < pc and po != None else False for po, pc in zipoc] )		# 标示出该天股价日内上涨的一个序列
	down= numpy.array( [ True if po > pc and po != None else False for po, pc in zipoc] )		# 标示出该天股价日内下跌的一个序列
	side= numpy.array( [ True if po == pc and po != None else False for po, pc in zipoc] )		# 标示出该天股价日内走平的一个序列


	if u'成交额' in pdata:
		volume= pdata[u'成交额']
	else:
		volume= pdata[u'成交量']

	rarray_vol= numpy.array(volume)
	volzeros= numpy.zeros(length)	# 辅助数据

	# XXX: 如果 up/down/side 各项全部为 False,那么 vlines() 会报错。
	if True in up:
		axes_2.vlines(xindex[up], volzeros[up], rarray_vol[up], edgecolor='red', linewidth=3.0, label='_nolegend_')
	if True in down:
		axes_2.vlines(xindex[down], volzeros[down], rarray_vol[down], edgecolor='green', linewidth=3.0, label='_nolegend_')
	if True in side:
		axes_2.vlines(xindex[side], volzeros[side], rarray_vol[side], edgecolor='0.7', linewidth=3.0, label='_nolegend_')


	#	第一只:设定 X 轴坐标的范围
	#==================================================================================================================================================
	axes_2.set_xlim(-1, length)


	#	第一只:设定 X 轴上的坐标
	#==================================================================================================================================================
	datelist= [ datetime.date(int(ys), int(ms), int(ds)) for ys, ms, ds in [ dstr.split('-') for dstr in pdata[u'日期'] ] ]

	# 确定 X 轴的 MajorLocator
	mdindex= []	# 每个月第一个交易日在所有日期列表中的 index
	years= set([d.year for d in datelist])	# 所有的交易年份

	for y in sorted(years):
		months= set([d.month for d in datelist if d.year == y])		# 当年所有的交易月份
		for m in sorted(months):
			monthday= min([dt for dt in datelist if dt.year==y and dt.month==m])	# 当月的第一个交易日
			mdindex.append(datelist.index(monthday))

	xMajorLocator= FixedLocator(numpy.array(mdindex))

	# 第一只:确定 X 轴的 MinorLocator
	wdindex= {}	# value: 每周第一个交易日在所有日期列表中的 index; key: 当周的序号 week number(当周是第几周)

	for d in datelist:
		isoyear, weekno= d.isocalendar()[0:2]
		dmark= isoyear*100 + weekno
		if dmark not in wdindex:
			wdindex[dmark]= datelist.index(d)

	xMinorLocator= FixedLocator(numpy.array( sorted(wdindex.values()) ))

	# 第一只:确定 X 轴的 MajorFormatter 和 MinorFormatter
	def x_major_formatter_2(idx, pos=None):
		return datelist[idx].strftime('%Y-%m-%d')

	def x_minor_formatter_2(idx, pos=None):
		return datelist[idx].strftime('%m-%d')

	xMajorFormatter= FuncFormatter(x_major_formatter_2)
	xMinorFormatter= FuncFormatter(x_minor_formatter_2)

	# 第一只:设定 X 轴的 Locator 和 Formatter
	xaxis_2.set_major_locator(xMajorLocator)
	xaxis_2.set_major_formatter(xMajorFormatter)

	xaxis_2.set_minor_locator(xMinorLocator)
	xaxis_2.set_minor_formatter(xMinorFormatter)

	# 第一只:设定 X 轴主要坐标点与辅助坐标点的样式
	for malabel in axes_2.get_xticklabels(minor=False):
		malabel.set_fontsize(4)
		malabel.set_horizontalalignment('right')
		malabel.set_rotation('45')

	for milabel in axes_2.get_xticklabels(minor=True):
		milabel.set_fontsize(4)
		milabel.set_color('blue')
		milabel.set_horizontalalignment('right')
		milabel.set_rotation('45')


	#	第一只:设定成交量 Y 轴坐标的范围
	#==================================================================================================================================================
	maxvol= max(volume)	# 注意是 int 类型
	axes_2.set_ylim(0, maxvol)


	#	第一只:设定成交量 Y 轴上的坐标
	#==================================================================================================================================================
	vollen= len(str(maxvol))

	volstep_pri= int(round(maxvol/10.0+5000, -4))

	yMajorLocator_2= MultipleLocator(volstep_pri)


	# 第一只:确定 Y 轴的 MajorFormatter
	dimsuffix= u'元' if u'成交额' in pdata else u'股'
	def y_major_formatter_2(num, pos=None):
		if num >= 10**8:	# 大于 1 亿
			return (str(round(num/10.0**8, 2)) + u'亿' + dimsuffix) if num != 0 else '0'
		else:
			return (str(num/10.0**4) + u'万' + dimsuffix) if num != 0 else '0'

	#	def y_major_formatter_2(num, pos=None):
	#		return int(num)
	yMajorFormatter_2= FuncFormatter(y_major_formatter_2)

	# 确定 Y 轴的 MinorFormatter
	#	def y_minor_formatter_2(num, pos=None):
	#		return int(num)
	#	yMinorFormatter_2= FuncFormatter(y_minor_formatter_2)
	yMinorFormatter_2= NullFormatter()

	# 第一只:设定 X 轴的 Locator 和 Formatter
	yaxis_2.set_major_locator(yMajorLocator_2)
	yaxis_2.set_major_formatter(yMajorFormatter_2)

	#	yaxis_2.set_minor_locator(yMinorLocator_2)
	yaxis_2.set_minor_formatter(yMinorFormatter_2)

	# 第一只:设定 Y 轴主要坐标点与辅助坐标点的样式
	for malab in axes_2.get_yticklabels(minor=False):
		malab.set_font_properties(__font_properties__)
		malab.set_fontsize(4.5)	# 这个必须放在前一句后面,否则作用会被覆盖


	#	第一只:成交量数值在图中间的显示
	#==================================================================================================================================================
	for iy in range(volstep_pri, maxvol, volstep_pri):
		for ix in mdindex[1:-1:3]:
			newlab= axes_2.text(ix+8, iy, y_major_formatter_2(iy))
			newlab.set_font_properties(__font_properties__)
			newlab.set_color('0.3')
			newlab.set_fontsize(3)
			newlab.set_zorder(0)		# XXX: 放在底层
			#	newlab.set_verticalalignment('center')


	#==================================================================================================================================================
	#==================================================================================================================================================
	#=======
	#=======	XXX: 第二条成交量图线
	#=======
	#==================================================================================================================================================
	#==================================================================================================================================================

	#	添加 Axes 对象
	#==================================================================================================================================================
	axes_2_sec= axes_2.twinx()
	#	axes_2_sec.set_axisbelow(True)	# 网格线放在底层

	axes_2_sec.set_axisbelow(True)	# 网格线放在底层

	#	改变坐标线的颜色
	#==================================================================================================================================================
	#	for child in axes_2_sec.get_children():
	#		if isinstance(child, matplotlib.spines.Spine):
	#			child.set_color('lightblue')

	#	得到 X 轴 和 Y 轴 的两个 Axis 对象
	#==================================================================================================================================================
	xaxis_2_sec= axes_2_sec.get_xaxis()
	yaxis_2_sec= axes_2_sec.get_yaxis()

	#	设置两个坐标轴上的 grid
	#==================================================================================================================================================
	#	xaxis_2_sec.grid(True, 'major', color='0.3', linestyle='solid', linewidth=0.2)
	#	xaxis_2_sec.grid(True, 'minor', color='0.3', linestyle='dotted', linewidth=0.1)

	#	yaxis_2_sec.grid(True, 'major', color='0.3', linestyle='solid', linewidth=0.2)
	#	yaxis_2_sec.grid(True, 'minor', color='0.3', linestyle='dotted', linewidth=0.1)


	#==================================================================================================================================================
	#=======	绘图
	#==================================================================================================================================================

	if u'成交额二' in pdata:
		volume_sec= pdata[u'成交额二']
	else:
		volume_sec= pdata[u'成交量二']

	zipoc_sec= zip(pdata[u'开盘二'], pdata[u'收盘二'])
	up_sec=   numpy.array( [ True if po < pc and po != None else False for po, pc in zipoc_sec] )		# 标示出该天股价日内上涨的一个序列
	down_sec= numpy.array( [ True if po > pc and po != None else False for po, pc in zipoc_sec] )		# 标示出该天股价日内下跌的一个序列
	side_sec= numpy.array( [ True if po == pc and po != None else False for po, pc in zipoc_sec] )		# 标示出该天股价日内走平的一个序列

	rarray_vol_sec= numpy.array(volume_sec)
	volzeros_sec= numpy.zeros(length)	# 辅助数据

	# XXX: 如果 up_sec/down_sec/side_sec 各项全部为 False,那么 vlines() 会报错。
	if True in up_sec:
		axes_2_sec.vlines(xindex[up_sec], volzeros_sec[up_sec], rarray_vol_sec[up_sec], edgecolor='pink', linewidth=1.0, label='_nolegend_', alpha=0.3)
	if True in down_sec:
		axes_2_sec.vlines(xindex[down_sec], volzeros_sec[down_sec], rarray_vol_sec[down_sec], edgecolor='lightgreen', linewidth=1.0, label='_nolegend_', alpha=0.3)
	if True in side_sec:
		axes_2_sec.vlines(xindex[side_sec], volzeros_sec[side_sec], rarray_vol_sec[side_sec], edgecolor='0.7', linewidth=1.0, label='_nolegend_', alpha=0.3)


	#	设定 X 轴坐标的范围
	#==================================================================================================================================================
	#	XXX: 不用了,与 axes_2 共用。


	#	设定 Y 轴坐标的范围
	#==================================================================================================================================================
	maxvol_sec= max(volume_sec)	# 注意是 int 类型
	axes_2_sec.set_ylim(0, maxvol_sec)


	#	设定 Y 轴上的坐标
	#==================================================================================================================================================

	volstep_sec= volstep_pri*maxvol_sec/float(maxvol)
	yMajorLocator_2_sec= MultipleLocator(volstep_sec)

	# 确定 Y 轴的 MajorFormatter
	dimsuffix_sec= u'元' if u'成交额二' in pdata else u'股'
	def y_major_formatter_2_sec(num, pos=None):
		if num >= 10**8:	# 大于 1 亿
			print(('num= ' + str(num) + ', result= ' + str(round(num/10.0**8, 3)) + u'亿' + dimsuffix_sec).encode('utf8'))

			return (str(round(num/10.0**8, 3)) + u'亿' + dimsuffix_sec) if num != 0 else '0'
		else:
			return (str(round(num/10.0**4, 2)) + u'万' + dimsuffix_sec) if num != 0 else '0'

	#	def y_major_formatter_2_sec(num, pos=None):
	#		return int(num)
	yMajorFormatter_2_sec= FuncFormatter(y_major_formatter_2_sec)

	# 确定 Y 轴的 MinorFormatter
	#	def y_minor_formatter_2(num, pos=None):
	#		return int(num)
	#	yMinorFormatter_2_sec= FuncFormatter(y_minor_formatter_2)
	yMinorFormatter_2_sec= NullFormatter()

	# 设定 X 轴的 Locator 和 Formatter
	yaxis_2_sec.set_major_locator(yMajorLocator_2_sec)
	yaxis_2_sec.set_major_formatter(yMajorFormatter_2_sec)

	#	yaxis_2_sec.set_minor_locator(yMinorLocator_2_sec)
	yaxis_2_sec.set_minor_formatter(yMinorFormatter_2_sec)

	# 设定 Y 轴主要坐标点与辅助坐标点的样式
	for malab in axes_2_sec.get_yticklabels(minor=False):
		malab.set_font_properties(__font_properties__)
		malab.set_fontsize(4.5)	# 这个必须放在前一句后面,否则作用会被覆盖


	#==================================================================================================================================================
	#==================================================================================================================================================
	#=======
	#=======	XXX: K 线图部分
	#=======
	#==================================================================================================================================================
	#==================================================================================================================================================

	#	添加 Axes 对象
	#==================================================================================================================================================
	axes_1= figobj.add_axes(rect_1, axis_bgcolor='black', sharex=axes_2)
	axes_1.set_axisbelow(True)	# 网格线放在底层

	axes_1.set_yscale('log', basey=expbase)		# 使用对数坐标

	#	改变坐标线的颜色
	#==================================================================================================================================================
	for child in axes_1.get_children():
		if isinstance(child, matplotlib.spines.Spine):
			child.set_color('lightblue')

	#	得到 X 轴 和 Y 轴 的两个 Axis 对象
	#==================================================================================================================================================
	xaxis_1= axes_1.get_xaxis()
	yaxis_1= axes_1.get_yaxis()

	#	设置两个坐标轴上的 grid
	#==================================================================================================================================================
	xaxis_1.grid(True, 'major', color='0.3', linestyle='solid', linewidth=0.2)
	xaxis_1.grid(True, 'minor', color='0.3', linestyle='dotted', linewidth=0.1)

	yaxis_1.grid(True, 'major', color='0.3', linestyle='solid', linewidth=0.2)
	yaxis_1.grid(True, 'minor', color='0.3', linestyle='dotted', linewidth=0.1)


	#==================================================================================================================================================
	#=======	绘图
	#==================================================================================================================================================

	#	绘制 K 线部分
	#==================================================================================================================================================

	#	对开收盘价进行视觉修正
	for idx, poc in enumerate( zip(pdata[u'开盘'], pdata[u'收盘']) ):
		if poc[0] == poc[1] and None not in poc:
			variant= round((poc[1]+1000)/2000, 0)
			pdata[u'开盘'][idx]= poc[0] - variant		# 稍微偏离一点,使得在图线上不致于完全看不到
			pdata[u'收盘'][idx]= poc[1] + variant

	rarray_open= numpy.array(pdata[u'开盘'])
	rarray_close= numpy.array(pdata[u'收盘'])
	rarray_high= numpy.array(pdata[u'最高'])
	rarray_low= numpy.array(pdata[u'最低'])

	# XXX: 如果 up, down, side 里有一个全部为 False 组成,那么 vlines() 会报错。
	# XXX: 可以使用 alpha 参数调节透明度
	if True in up:
		axes_1.vlines(xindex[up], rarray_low[up], rarray_high[up], edgecolor='red', linewidth=0.6, label='_nolegend_')
		axes_1.vlines(xindex[up], rarray_open[up], rarray_close[up], edgecolor='red', linewidth=3.0, label='_nolegend_')

	if True in down:
		axes_1.vlines(xindex[down], rarray_low[down], rarray_high[down], edgecolor='green', linewidth=0.6, label='_nolegend_')
		axes_1.vlines(xindex[down], rarray_open[down], rarray_close[down], edgecolor='green', linewidth=3.0, label='_nolegend_')

	if True in side:
		axes_1.vlines(xindex[side], rarray_low[side], rarray_high[side], edgecolor='0.7', linewidth=0.6, label='_nolegend_')
		axes_1.vlines(xindex[side], rarray_open[side], rarray_close[side], edgecolor='0.7', linewidth=3.0, label='_nolegend_')

	#	绘制均线部分
	#==================================================================================================================================================
	if u'5日均' in pdata:
		rarray_5dayave= numpy.array(pdata[u'5日均'])
		axes_1.plot(xindex, rarray_5dayave, 'o-', color='white', linewidth=0.1, label='ave_5', \
			markersize=0.7, markeredgecolor='white', markeredgewidth=0.1)	# 5日均线

	if u'10日均' in pdata:
		rarray_10dayave= numpy.array(pdata[u'10日均'])
		axes_1.plot(xindex, rarray_10dayave, 'o-', color='yellow', linewidth=0.1, label='ave_10', \
			markersize=0.7, markeredgecolor='yellow', markeredgewidth=0.1)	# 10日均线

	if u'30日均' in pdata:
		rarray_30dayave= numpy.array(pdata[u'30日均'])
		axes_1.plot(xindex, rarray_30dayave, 'o-', color='cyan', linewidth=0.1, label='ave_30', \
			markersize=0.7, markeredgecolor='cyan', markeredgewidth=0.1)	# 30日均线


	#	绘制 复权提示
	#==================================================================================================================================================
	if u'复权' in pdata:
		adjdict= dict(pdata[u'复权'])

		for idx, dstr in enumerate(pdata[u'日期']):
			if dstr in adjdict:
				axes_1.plot([idx, idx], [ylowlim_price, yhighlim_price], '-', color='purple', linewidth=0.3)


	#	设定 X 轴坐标的范围
	#==================================================================================================================================================
	axes_1.set_xlim(-1, length)


	#	先设置 label 位置,再将 X 轴上的坐标设为不可见。因为与 成交量子图 共用 X 轴
	#==================================================================================================================================================

	# 设定 X 轴的 Locator 和 Formatter
	xaxis_1.set_major_locator(xMajorLocator)
	xaxis_1.set_major_formatter(xMajorFormatter)

	xaxis_1.set_minor_locator(xMinorLocator)
	xaxis_1.set_minor_formatter(xMinorFormatter)

	# 将 X 轴上的坐标设为不可见。
	for malab in axes_1.get_xticklabels(minor=False):
		malab.set_visible(False)

	for milab in axes_1.get_xticklabels(minor=True):
		milab.set_visible(False)

	# 用这一段效果也一样
	#	pyplot.setp(axes_1.get_xticklabels(minor=False), visible=False)
	#	pyplot.setp(axes_1.get_xticklabels(minor=True), visible=False)


	#	设定 Y 轴坐标的范围
	#==================================================================================================================================================
	axes_1.set_ylim(ylowlim_price, yhighlim_price)


	#	设定 Y 轴上的坐标
	#==================================================================================================================================================

	# XXX: 不用 LogLocator 了,因为不能控制坐标点的位置。

	#	主要坐标点
	#----------------------------------------------------------------------------
	yticks_major_pri= []
	for i in range(1, 999):
		newloc= ylowlim_price * (expbase**i)
		if newloc <= yhighlim_price:
			yticks_major_pri.append(newloc)
		else:
			break

	yMajorLocator_1= FixedLocator(numpy.array(yticks_major_pri))

	# 确定 Y 轴的 MajorFormatter
	def y_major_formatter_1(num, pos=None):
		return str(round(num/1000.0, 2))

	yMajorFormatter_1= FuncFormatter(y_major_formatter_1)

	# 设定 X 轴的 Locator 和 Formatter
	yaxis_1.set_major_locator(yMajorLocator_1)
	yaxis_1.set_major_formatter(yMajorFormatter_1)

	# 设定 Y 轴主要坐标点与辅助坐标点的样式
	for mal in axes_1.get_yticklabels(minor=False):
		mal.set_fontsize(6)


	#	辅助坐标点
	#----------------------------------------------------------------------------
	yticks_minor_pri= []
	mtstart= ylowlim_price * (1.0+(expbase-1.0)/2)
	for i in range(999):
		newloc= mtstart * (expbase**i)
		if newloc <= yhighlim_price:
			yticks_minor_pri.append(newloc)
		else:
			break

	yMinorLocator_1= FixedLocator(numpy.array(yticks_minor_pri))		# XXX minor ticks 已经在上面一并设置,这里不需要了。

	# 确定 Y 轴的 MinorFormatter
	def y_minor_formatter_1(num, pos=None):
		return str(round(num/1000.0, 2))

	yMinorFormatter_1= FuncFormatter(y_minor_formatter_1)

	# 设定 X 轴的 Locator 和 Formatter
	yaxis_1.set_minor_locator(yMinorLocator_1)
	yaxis_1.set_minor_formatter(yMinorFormatter_1)
	# 设定 Y 轴主要坐标点与辅助坐标点的样式
	for mal in axes_1.get_yticklabels(minor=True):
		mal.set_fontsize(5)
		mal.set_color('blue')


	#	第一只:价格数值在图中间的显示
	#==================================================================================================================================================
	for iy in yticks_major_pri:
		for ix in mdindex[1:-1:3]:
			newlab= axes_1.text(ix+8, iy*1.001, y_major_formatter_1(iy))
			newlab.set_font_properties(__font_properties__)
			newlab.set_color('0.3')
			newlab.set_fontsize(3)
			newlab.set_zorder(0)		# XXX: 放在底层
			#	newlab.set_verticalalignment('center')


	#	第一只:日期在图中间的显示
	#==================================================================================================================================================
	for iy in yticks_minor_pri[1:-1:5]:
		for ix in mdindex:
			newlab= axes_1.text(ix-1, iy, pdata[u'日期'][ix])
			newlab.set_font_properties(__font_properties__)
			newlab.set_color('0.3')
			newlab.set_fontsize(4)
			newlab.set_rotation('vertical')
			#	newlab.set_horizontalalignment('left')
			#	newlab.set_verticalalignment('bottom')
			newlab.set_zorder(0)		# XXX: 放在底层
			#	newlab.set_verticalalignment('center')


	#==================================================================================================================================================
	#==================================================================================================================================================
	#=======
	#=======	XXX: 第二条 K 线图
	#=======
	#==================================================================================================================================================
	#==================================================================================================================================================

	#	添加 Axes 对象
	#==================================================================================================================================================
	axes_1_sec= axes_1.twinx()
	#	axes_1_sec.set_axisbelow(True)	# 网格线放在底层

	axes_1_sec.set_yscale('log', basey=expbase)	# 使用对数坐标


	#	得到 X 轴 和 Y 轴 的两个 Axis 对象
	#==================================================================================================================================================
	xaxis_1_sec= axes_1_sec.get_xaxis()
	yaxis_1_sec= axes_1_sec.get_yaxis()


	#==================================================================================================================================================
	#=======	绘图
	#==================================================================================================================================================

	#	绘制 K 线部分
	#==================================================================================================================================================

	#	对开收盘价进行视觉修正
	for idx, poc in enumerate( zipoc_sec ):
		if poc[0] == poc[1] and None not in poc:
			pdata[u'开盘二'][idx]= poc[0] - 5		# 稍微偏离一点,使得在图线上不致于完全看不到
			pdata[u'收盘二'][idx]= poc[1] + 5

	rarray_open= numpy.array(pdata[u'开盘二'])
	rarray_close= numpy.array(pdata[u'收盘二'])
	rarray_high= numpy.array(pdata[u'最高二'])
	rarray_low= numpy.array(pdata[u'最低二'])

	# XXX: 如果 up_sec, down_sec, side_sec 里有一个全部为 False 组成,那么 vlines() 会报错。
	# XXX: 可以使用 alpha 参数调节透明度
	if True in up_sec:
		axes_1_sec.vlines(xindex[up_sec], rarray_low[up_sec], rarray_high[up_sec], edgecolor='red', linewidth=0.6, label='_nolegend_', alpha=0.3)
		axes_1_sec.vlines(xindex[up_sec], rarray_open[up_sec], rarray_close[up_sec], edgecolor='red', linewidth=3.0, label='_nolegend_', alpha=0.3)

	if True in down_sec:
		axes_1_sec.vlines(xindex[down_sec], rarray_low[down_sec], rarray_high[down_sec], edgecolor='green', linewidth=0.6, label='_nolegend_', alpha=0.3)
		axes_1_sec.vlines(xindex[down_sec], rarray_open[down_sec], rarray_close[down_sec], edgecolor='green', linewidth=3.0, label='_nolegend_', alpha=0.3)

	if True in side_sec:
		axes_1_sec.vlines(xindex[side_sec], rarray_low[side_sec], rarray_high[side_sec], edgecolor='0.7', linewidth=0.6, label='_nolegend_', alpha=0.3)
		axes_1_sec.vlines(xindex[side_sec], rarray_open[side_sec], rarray_close[side_sec], edgecolor='0.7', linewidth=3.0, label='_nolegend_', alpha=0.3)


	#	设定 X 轴坐标的范围
	#==================================================================================================================================================
	axes_1_sec.set_xlim(-1, length)


	#	先设置 label 位置,再将 X 轴上的坐标设为不可见。因为与 成交量子图 共用 X 轴
	#==================================================================================================================================================

	# 设定 X 轴的 Locator 和 Formatter
	xaxis_1_sec.set_major_locator(xMajorLocator)
	xaxis_1_sec.set_major_formatter(xMajorFormatter)

	xaxis_1_sec.set_minor_locator(xMinorLocator)
	xaxis_1_sec.set_minor_formatter(xMinorFormatter)

	# 将 X 轴上的坐标设为不可见。
	for malab in axes_1_sec.get_xticklabels(minor=False):
		malab.set_visible(False)

	for milab in axes_1_sec.get_xticklabels(minor=True):
		milab.set_visible(False)


	#	设定 Y 轴坐标的范围
	#==================================================================================================================================================
	axes_1_sec.set_ylim(ylowlim_price*open_price_sec/open_price_pri, yhighlim_price*open_price_sec/open_price_pri)


	#	设定 Y 轴上的坐标
	#==================================================================================================================================================

	#	主要坐标点
	#----------------------------------------------------------------------------
	yticks_major_sec= []
	ylowlim_price_sec=  ylowlim_price*open_price_sec/open_price_pri
	yhighlim_price_sec= yhighlim_price*open_price_sec/open_price_pri

	for i in range(1, 999):
		newloc= ylowlim_price_sec * (expbase**i)
		if newloc <= yhighlim_price_sec:
			yticks_major_sec.append(newloc)
		else:
			break

	yMajorLocator_1_sec= FixedLocator(numpy.array(yticks_major_sec))

	# 确定 Y 轴的 MajorFormatter
	def y_major_formatter_1_sec(num, pos=None):
		return str(round(num/1000.0, 2))

	yMajorFormatter_1_sec= FuncFormatter(y_major_formatter_1_sec)

	# 设定 X 轴的 Locator 和 Formatter
	yaxis_1_sec.set_major_locator(yMajorLocator_1_sec)
	yaxis_1_sec.set_major_formatter(yMajorFormatter_1_sec)

	# 设定 Y 轴主要坐标点与辅助坐标点的样式
	for mal in axes_1_sec.get_yticklabels(minor=False):
		mal.set_fontsize(6)


	#	辅助坐标点
	#----------------------------------------------------------------------------
	yticks_minor_sec= []
	mtstart_sec= ylowlim_price_sec * (1.0+(expbase-1.0)/2)
	for i in range(999):
		newloc= mtstart_sec * (expbase**i)
		if newloc <= yhighlim_price_sec:
			yticks_minor_sec.append(newloc)
		else:
			break

	yMinorLocator_1_sec= FixedLocator(numpy.array(yticks_minor_sec))		# XXX minor ticks 已经在上面一并设置,这里不需要了。

	# 确定 Y 轴的 MinorFormatter
	def y_minor_formatter_1_sec(num, pos=None):
		return str(round(num/1000.0, 2))

	yMinorFormatter_1_sec= FuncFormatter(y_minor_formatter_1_sec)

	# 设定 X 轴的 Locator 和 Formatter
	yaxis_1_sec.set_minor_locator(yMinorLocator_1_sec)
	yaxis_1_sec.set_minor_formatter(yMinorFormatter_1_sec)
	# 设定 Y 轴主要坐标点与辅助坐标点的样式
	for mal in axes_1_sec.get_yticklabels(minor=True):
		mal.set_fontsize(5)
		mal.set_color('blue')


	#	显示图片
	#==================================================================================================================================================
	#	pyplot.show()

	#	保存图片
	#==================================================================================================================================================
	figobj.savefig(figpath, dpi=figdpi, facecolor=figfacecolor, edgecolor=figedgecolor, linewidth=figlinewidth)


if __name__ == '__main__':
	Plot(pfile=sys.argv[1], figpath=sys.argv[2])
用来画股票 K线图 的 Python 脚本
---- <补记>:
最新的在这里: 用 Python / Matplotlib 画出来的股票 K线图 (四)
下一篇在这里: 用 Python / Matplotlib 画出来的股票 K线图 (三)
---- 花了 20 个小时左右的时间才从新浪下载完复权日线数据,把复权日线表建起来。这速度也太慢了,还有首次下载网页失败的比例居然这么高,一定有问题,印象中以前不是这么慢的,下载几千只股票的数据也只有几十个页面会首次下载失败吧。但昨天晚上更新最新数据的时候把下载任务之间的延迟扩大了一些,好像好一些,速度还可以,而且失败率不高。我开的是 5 个线程,下载页面之间的间隔是 0.2 ~ 0.3 秒。
---- 另外,把那个画 K 线图的脚本贴出来。这个脚本是通过研究 Matplotlib 官网里的示例并且借助 Google,用大概 1 周的时间改出来的。简单介绍一下:
1. 由两个子图(subplot)构成,上面一个显示价格(K 线),下面一个显示成交量。
2. K 线子图可以使用线性坐标或者对数坐标(由 Plot() 函数第三个参数控制)。使用线性坐标的时候,每个单位价格区间所占高度是固定的;使用对数坐标的时候,每个单位涨幅区间(比如 10%)所占高度是固定的。成交量子图的高度总是固定,不论成交量数值大小。
3. 对 X 轴来说,每根 K 线的宽度固定,整个图形的宽度决定于行情的天数。只要把行情数据文件作为参数传递过去就可以,图片尺寸由程序自主计算。
4. 另外,figdpi 这个变量控制图片的分辨率(解析度),可以随意调大调小。上一篇文章里贴的图使用的 dpi 值是 300。另外,X 轴和 Y 轴上的坐标点也是程序自主决定的。
---- 整个脚本还是一个 work-in-progress,目前的局限主要在于使用对数坐标时,Y 轴坐标点的确定。前一篇里所贴的那个图,可以看见价格上限在 20 块左右,如果换一只价格 90 块上下的股票,或者用来画几千点的指数行情,那 Y 轴的坐标点就会太密集。解决办法是根据取值区间来自主选择合适的 Y 轴坐标间距,但是这个目前还没有做。
---- 任何意见或建议都许多欢迎 !
---- <补记>:已经有了大幅改进的版本,在下一篇里。
# -*- coding: utf-8 -*-

import sys
import pickle
import math
import datetime
import matplotlib

matplotlib.use("WXAgg", warn=True)	# 这个要紧跟在 import matplotlib 之后,而且必须安装了 wxpython 2.8 才行。

import matplotlib.pyplot as pyplot
import numpy
from matplotlib.ticker import FixedLocator, MultipleLocator, LogLocator, FuncFormatter, NullFormatter, LogFormatter


def Plot(pfile, figpath, useexpo=True):
	'''
	pfile 指明存放绘图数据的 pickle file,figpath 指定图片需存放的路径
	'''

	fileobj= open(name=pfile, mode='rb')
	pdata= pickle.load(fileobj)
	fileobj.close()

	#	计算图片的尺寸(单位英寸)
	#	注意:Python2 里面, "1 / 10" 结果是 0, 必须写成 "1.0 / 10" 才会得到 0.1
	#==================================================================================================================================================

	length= len(pdata[u'日期'])		# 所有数据的长度,就是天数

	highest_price= max(pdata[u'最高'])	# 最高价
	lowest_price= min( [plow for plow in pdata[u'最低'] if plow != None] )	# 最低价

	yhighlim_price= round(highest_price+50, -2)	# K线子图 Y 轴最大坐标
	ylowlim_price=  round(lowest_price-50, -2)	# K线子图 Y 轴最小坐标

	xfactor= 10.0/230.0	# 一条 K 线的宽度在 X 轴上所占距离(英寸)
	yfactor= 0.3	# Y 轴上每一个距离单位的长度(英寸),这个单位距离是线性坐标和对数坐标通用的

	if useexpo:	# 要使用对数坐标
		expbase= 1.1	# 底数,取得小一点,比较接近 1。股价 3 元到 4 元之间有大约 3 个单位距离
		ymulti_price= math.log(yhighlim_price, expbase)	- math.log(ylowlim_price, expbase)	# 价格在 Y 轴上的 “份数”

	else:
		ymulti_price= (yhighlim_price - ylowlim_price) / 100	# 价格在 Y 轴上的 “份数”

	ymulti_vol= 3.0		# 成交量部分在 Y 轴所占的 “份数”
	ymulti_top= 0.2		# 顶部空白区域在 Y 轴所占的 “份数”
	ymulti_bot= 0.8		# 底部空白区域在 Y 轴所占的 “份数”

	xmulti_left= 10.0	# 左侧空白区域所占的 “份数”
	xmulti_right= 3.0	# 右侧空白区域所占的 “份数”

	xmulti_all= length + xmulti_left + xmulti_right
	xlen_fig= xmulti_all * xfactor		# 整个 Figure 的宽度
	ymulti_all= ymulti_price + ymulti_vol + ymulti_top + ymulti_bot
	ylen_fig= ymulti_all * yfactor		# 整个 Figure 的高度

	rect_1= (xmulti_left/xmulti_all, (ymulti_bot+ymulti_vol)/ymulti_all, length/xmulti_all, ymulti_price/ymulti_all)	# K线图部分
	rect_2= (xmulti_left/xmulti_all, ymulti_bot/ymulti_all, length/xmulti_all, ymulti_vol/ymulti_all)	# 成交量部分

	#	建立 Figure 对象
	#==================================================================================================================================================
	figfacecolor= 'white'
	figedgecolor= 'black'
	figdpi= 600
	figlinewidth= 1.0

	figobj= pyplot.figure(figsize=(xlen_fig, ylen_fig), dpi=figdpi, facecolor=figfacecolor, edgecolor=figedgecolor, linewidth=figlinewidth)	# Figure 对象

	#==================================================================================================================================================
	#==================================================================================================================================================
	#=======	成交量部分
	#==================================================================================================================================================
	#==================================================================================================================================================

	#	添加 Axes 对象
	#==================================================================================================================================================
	axes_2= figobj.add_axes(rect_2, axis_bgcolor='black')
	axes_2.set_axisbelow(True)	# 网格线放在底层

	#	改变坐标线的颜色
	#==================================================================================================================================================
	for child in axes_2.get_children():
		if isinstance(child, matplotlib.spines.Spine):
			child.set_color('lightblue')

	#	得到 X 轴 和 Y 轴 的两个 Axis 对象
	#==================================================================================================================================================
	xaxis_2= axes_2.get_xaxis()
	yaxis_2= axes_2.get_yaxis()

	#	设置两个坐标轴上的 grid
	#==================================================================================================================================================
	xaxis_2.grid(True, 'major', color='0.3', linestyle='solid', linewidth=0.2)
	xaxis_2.grid(True, 'minor', color='0.3', linestyle='dotted', linewidth=0.1)

	yaxis_2.grid(True, 'major', color='0.3', linestyle='solid', linewidth=0.2)
	yaxis_2.grid(True, 'minor', color='0.3', linestyle='dotted', linewidth=0.1)


	#==================================================================================================================================================
	#=======	绘图
	#==================================================================================================================================================
	xindex= numpy.arange(length)	# X 轴上的 index,一个辅助数据

	zipoc= zip(pdata[u'开盘'], pdata[u'收盘'])
	up=   numpy.array( [ True if po < pc and po != None else False for po, pc in zipoc] )		# 标示出该天股价日内上涨的一个序列
	down= numpy.array( [ True if po > pc and po != None else False for po, pc in zipoc] )		# 标示出该天股价日内下跌的一个序列
	side= numpy.array( [ True if po == pc and po != None else False for po, pc in zipoc] )		# 标示出该天股价日内走平的一个序列


	volume= pdata[u'成交量']
	rarray_vol= numpy.array(volume)
	volzeros= numpy.zeros(length)	# 辅助数据

	# XXX: 如果 up/down/side 各项全部为 False,那么 vlines() 会报错。
	if True in up:
		axes_2.vlines(xindex[up], volzeros[up], rarray_vol[up], color='red', linewidth=3.0, label='_nolegend_')
	if True in down:
		axes_2.vlines(xindex[down], volzeros[down], rarray_vol[down], color='green', linewidth=3.0, label='_nolegend_')
	if True in side:
		axes_2.vlines(xindex[side], volzeros[side], rarray_vol[side], color='0.7', linewidth=3.0, label='_nolegend_')


	#	设定 X 轴坐标的范围
	#==================================================================================================================================================
	axes_2.set_xlim(-1, length)


	#	设定 X 轴上的坐标
	#==================================================================================================================================================
	datelist= [ datetime.date(int(ys), int(ms), int(ds)) for ys, ms, ds in [ dstr.split('-') for dstr in pdata[u'日期'] ] ]

	# 确定 X 轴的 MajorLocator
	mdindex= []	# 每个月第一个交易日在所有日期列表中的 index
	years= set([d.year for d in datelist])	# 所有的交易年份

	for y in sorted(years):
		months= set([d.month for d in datelist if d.year == y])		# 当年所有的交易月份
		for m in sorted(months):
			monthday= min([dt for dt in datelist if dt.year==y and dt.month==m])	# 当月的第一个交易日
			mdindex.append(datelist.index(monthday))

	xMajorLocator= FixedLocator(numpy.array(mdindex))

	# 确定 X 轴的 MinorLocator
	wdindex= []	# 每周第一个交易日在所有日期列表中的 index
	for d in datelist:
		if d.weekday() == 0: wdindex.append(datelist.index(d))

	xMinorLocator= FixedLocator(numpy.array(wdindex))

	# 确定 X 轴的 MajorFormatter 和 MinorFormatter
	def x_major_formatter_2(idx, pos=None):
		return datelist[idx].strftime('%Y-%m-%d')

	def x_minor_formatter_2(idx, pos=None):
		return datelist[idx].strftime('%m-%d')

	xMajorFormatter= FuncFormatter(x_major_formatter_2)
	xMinorFormatter= FuncFormatter(x_minor_formatter_2)

	# 设定 X 轴的 Locator 和 Formatter
	xaxis_2.set_major_locator(xMajorLocator)
	xaxis_2.set_major_formatter(xMajorFormatter)

	xaxis_2.set_minor_locator(xMinorLocator)
	xaxis_2.set_minor_formatter(xMinorFormatter)

	# 设定 X 轴主要坐标点与辅助坐标点的样式
	for malabel in axes_2.get_xticklabels(minor=False):
		malabel.set_fontsize(3)
		malabel.set_horizontalalignment('right')
		malabel.set_rotation('30')

	for milabel in axes_2.get_xticklabels(minor=True):
		milabel.set_fontsize(2)
		milabel.set_horizontalalignment('right')
		milabel.set_rotation('30')


	#	设定 Y 轴坐标的范围
	#==================================================================================================================================================
	maxvol= max(volume)	# 注意是 int 类型
	axes_2.set_ylim(0, maxvol)


	#	设定 Y 轴上的坐标
	#==================================================================================================================================================
	vollen= len(str(maxvol))

	yMajorLocator_2= MultipleLocator(10**(vollen-1))
	yMinorLocator_2= MultipleLocator((10**(vollen-2))*5)

	# 确定 Y 轴的 MajorFormatter
	#	def y_major_formatter_2(num, pos=None):
	#		numtable= {'1':u'一', '2':u'二', '3':u'三', '4':u'四', '5':u'五', '6':u'六', '7':u'七', '8':u'八', '9':u'九', }
	#		dimtable= {3:u'百', 4:u'千', 5:u'万', 6:u'十万', 7:u'百万', 8:u'千万', 9:u'亿', 10:u'十亿', 11:u'百亿'}
	#		return numtable[str(num)[0]] + dimtable[vollen] if num != 0 else '0'

	def y_major_formatter_2(num, pos=None):
		return int(num)
	yMajorFormatter_2= FuncFormatter(y_major_formatter_2)

	# 确定 Y 轴的 MinorFormatter
	#	def y_minor_formatter_2(num, pos=None):
	#		return int(num)
	#	yMinorFormatter_2= FuncFormatter(y_minor_formatter_2)
	yMinorFormatter_2= NullFormatter()

	# 设定 X 轴的 Locator 和 Formatter
	yaxis_2.set_major_locator(yMajorLocator_2)
	yaxis_2.set_major_formatter(yMajorFormatter_2)

	yaxis_2.set_minor_locator(yMinorLocator_2)
	yaxis_2.set_minor_formatter(yMinorFormatter_2)

	# 设定 Y 轴主要坐标点与辅助坐标点的样式
	for malab in axes_2.get_yticklabels(minor=False):
		malab.set_fontsize(3)

	for milab in axes_2.get_yticklabels(minor=True):
		milab.set_fontsize(2)


	#==================================================================================================================================================
	#==================================================================================================================================================
	#=======	K 线图部分
	#==================================================================================================================================================
	#==================================================================================================================================================

	#	添加 Axes 对象
	#==================================================================================================================================================
	axes_1= figobj.add_axes(rect_1, axis_bgcolor='black', sharex=axes_2)
	axes_1.set_axisbelow(True)	# 网格线放在底层

	if useexpo:
		axes_1.set_yscale('log', basey=expbase)	# 使用对数坐标

	#	改变坐标线的颜色
	#==================================================================================================================================================
	for child in axes_1.get_children():
		if isinstance(child, matplotlib.spines.Spine):
			child.set_color('lightblue')

	#	得到 X 轴 和 Y 轴 的两个 Axis 对象
	#==================================================================================================================================================
	xaxis_1= axes_1.get_xaxis()
	yaxis_1= axes_1.get_yaxis()

	#	设置两个坐标轴上的 grid
	#==================================================================================================================================================
	xaxis_1.grid(True, 'major', color='0.3', linestyle='solid', linewidth=0.2)
	xaxis_1.grid(True, 'minor', color='0.3', linestyle='dotted', linewidth=0.1)

	yaxis_1.grid(True, 'major', color='0.3', linestyle='solid', linewidth=0.2)
	yaxis_1.grid(True, 'minor', color='0.3', linestyle='dotted', linewidth=0.1)


	#==================================================================================================================================================
	#=======	绘图
	#==================================================================================================================================================

	#	绘制 K 线部分
	#==================================================================================================================================================
	rarray_open= numpy.array(pdata[u'开盘'])
	rarray_close= numpy.array(pdata[u'收盘'])
	rarray_high= numpy.array(pdata[u'最高'])
	rarray_low= numpy.array(pdata[u'最低'])

	# XXX: 如果 up, down, side 里有一个全部为 False 组成,那么 vlines() 会报错。
	if True in up:
		axes_1.vlines(xindex[up], rarray_low[up], rarray_high[up], color='red', linewidth=0.6, label='_nolegend_')
		axes_1.vlines(xindex[up], rarray_open[up], rarray_close[up], color='red', linewidth=3.0, label='_nolegend_')
	if True in down:
		axes_1.vlines(xindex[down], rarray_low[down], rarray_high[down], color='green', linewidth=0.6, label='_nolegend_')
		axes_1.vlines(xindex[down], rarray_open[down], rarray_close[down], color='green', linewidth=3.0, label='_nolegend_')
	if True in side:
		axes_1.vlines(xindex[side], rarray_low[side], rarray_high[side], color='0.7', linewidth=0.6, label='_nolegend_')
		axes_1.vlines(xindex[side], rarray_open[side], rarray_close[side], color='0.7', linewidth=3.0, label='_nolegend_')

	#	绘制均线部分
	#==================================================================================================================================================
	rarray_1dayave= numpy.array(pdata[u'1日权均'])
	rarray_5dayave= numpy.array(pdata[u'5日均'])
	rarray_30dayave= numpy.array(pdata[u'30日均'])

	axes_1.plot(xindex, rarray_1dayave, 'o-', color='white', linewidth=0.1, markersize=0.7, markeredgecolor='white', markeredgewidth=0.1)	# 1日加权均线
	axes_1.plot(xindex, rarray_5dayave, 'o-', color='yellow', linewidth=0.1, markersize=0.7, markeredgecolor='yellow', markeredgewidth=0.1)	# 5日均线
	axes_1.plot(xindex, rarray_30dayave, 'o-', color='green', linewidth=0.1, markersize=0.7, markeredgecolor='green', markeredgewidth=0.1)	# 30日均线

	#	设定 X 轴坐标的范围
	#==================================================================================================================================================
	axes_1.set_xlim(-1, length)


	#	先设置 label 位置,再将 X 轴上的坐标设为不可见。因为与 成交量子图 共用 X 轴
	#==================================================================================================================================================

	# 设定 X 轴的 Locator 和 Formatter
	xaxis_1.set_major_locator(xMajorLocator)
	xaxis_1.set_major_formatter(xMajorFormatter)

	xaxis_1.set_minor_locator(xMinorLocator)
	xaxis_1.set_minor_formatter(xMinorFormatter)

	# 将 X 轴上的坐标设为不可见。
	for malab in axes_1.get_xticklabels(minor=False):
		malab.set_visible(False)

	for milab in axes_1.get_xticklabels(minor=True):
		milab.set_visible(False)

	# 用这一段效果也一样
	#	pyplot.setp(axes_1.get_xticklabels(minor=False), visible=False)
	#	pyplot.setp(axes_1.get_xticklabels(minor=True), visible=False)


	#	设定 Y 轴坐标的范围
	#==================================================================================================================================================
	axes_1.set_ylim(ylowlim_price, yhighlim_price)


	#	设定 Y 轴上的坐标
	#==================================================================================================================================================

	if useexpo:
		#	主要坐标点
		#-----------------------------------------------------
		yMajorLocator_1= LogLocator(base=expbase)

		yMajorFormatter_1= NullFormatter()

		# 设定 X 轴的 Locator 和 Formatter
		yaxis_1.set_major_locator(yMajorLocator_1)
		yaxis_1.set_major_formatter(yMajorFormatter_1)

		# 设定 Y 轴主要坐标点与辅助坐标点的样式
		#	for mal in axes_1.get_yticklabels(minor=False):
		#		mal.set_fontsize(3)

		#	辅助坐标点
		#-----------------------------------------------------
		minorticks= range(int(ylowlim_price), int(yhighlim_price)+1, 100)

		yMinorLocator_1= FixedLocator(numpy.array(minorticks))

		# 确定 Y 轴的 MinorFormatter
		def y_minor_formatter_1(num, pos=None):
			return str(num/100.0) + '0'

		yMinorFormatter_1= FuncFormatter(y_minor_formatter_1)

		# 设定 X 轴的 Locator 和 Formatter
		yaxis_1.set_minor_locator(yMinorLocator_1)
		yaxis_1.set_minor_formatter(yMinorFormatter_1)

		# 设定 Y 轴主要坐标点与辅助坐标点的样式
		for mil in axes_1.get_yticklabels(minor=True):
			mil.set_fontsize(3)

	else:	# 如果使用线性坐标,那么只标主要坐标点
		yMajorLocator_1= MultipleLocator(100)

		def y_major_formatter_1(num, pos=None):
			return str(num/100.0) + '0'

		yMajorFormatter_1= FuncFormatter(y_major_formatter_1)

		# 设定 Y 轴的 Locator 和 Formatter
		yaxis_1.set_major_locator(yMajorLocator_1)
		yaxis_1.set_major_formatter(yMajorFormatter_1)

		# 设定 Y 轴主要坐标点与辅助坐标点的样式
		for mal in axes_1.get_yticklabels(minor=False):
			mal.set_fontsize(3)


	#	保存图片
	#==================================================================================================================================================
	figobj.savefig(figpath, dpi=figdpi, facecolor=figfacecolor, edgecolor=figedgecolor, linewidth=figlinewidth)


if __name__ == '__main__':
	Plot(pfile=sys.argv[1], figpath=sys.argv[2], useexpo=True)