用 Python / Matplotlib 画出来的股票 K线图 (二) - Jacky Liu's Blog
用 Python / Matplotlib 画出来的股票 K线图 (二)
Jacky Liu
posted @ 2011年4月10日 05:05
in Python
with tags
python 股票 Matplotlib candlestick K线 蜡烛 stock chart
, 39985 阅读
---- 最新的在这里: 用 Python / Matplotlib 画出来的股票 K线图 (四)
---- 下一篇在这里: 用 Python / Matplotlib 画出来的股票 K线图 (三)
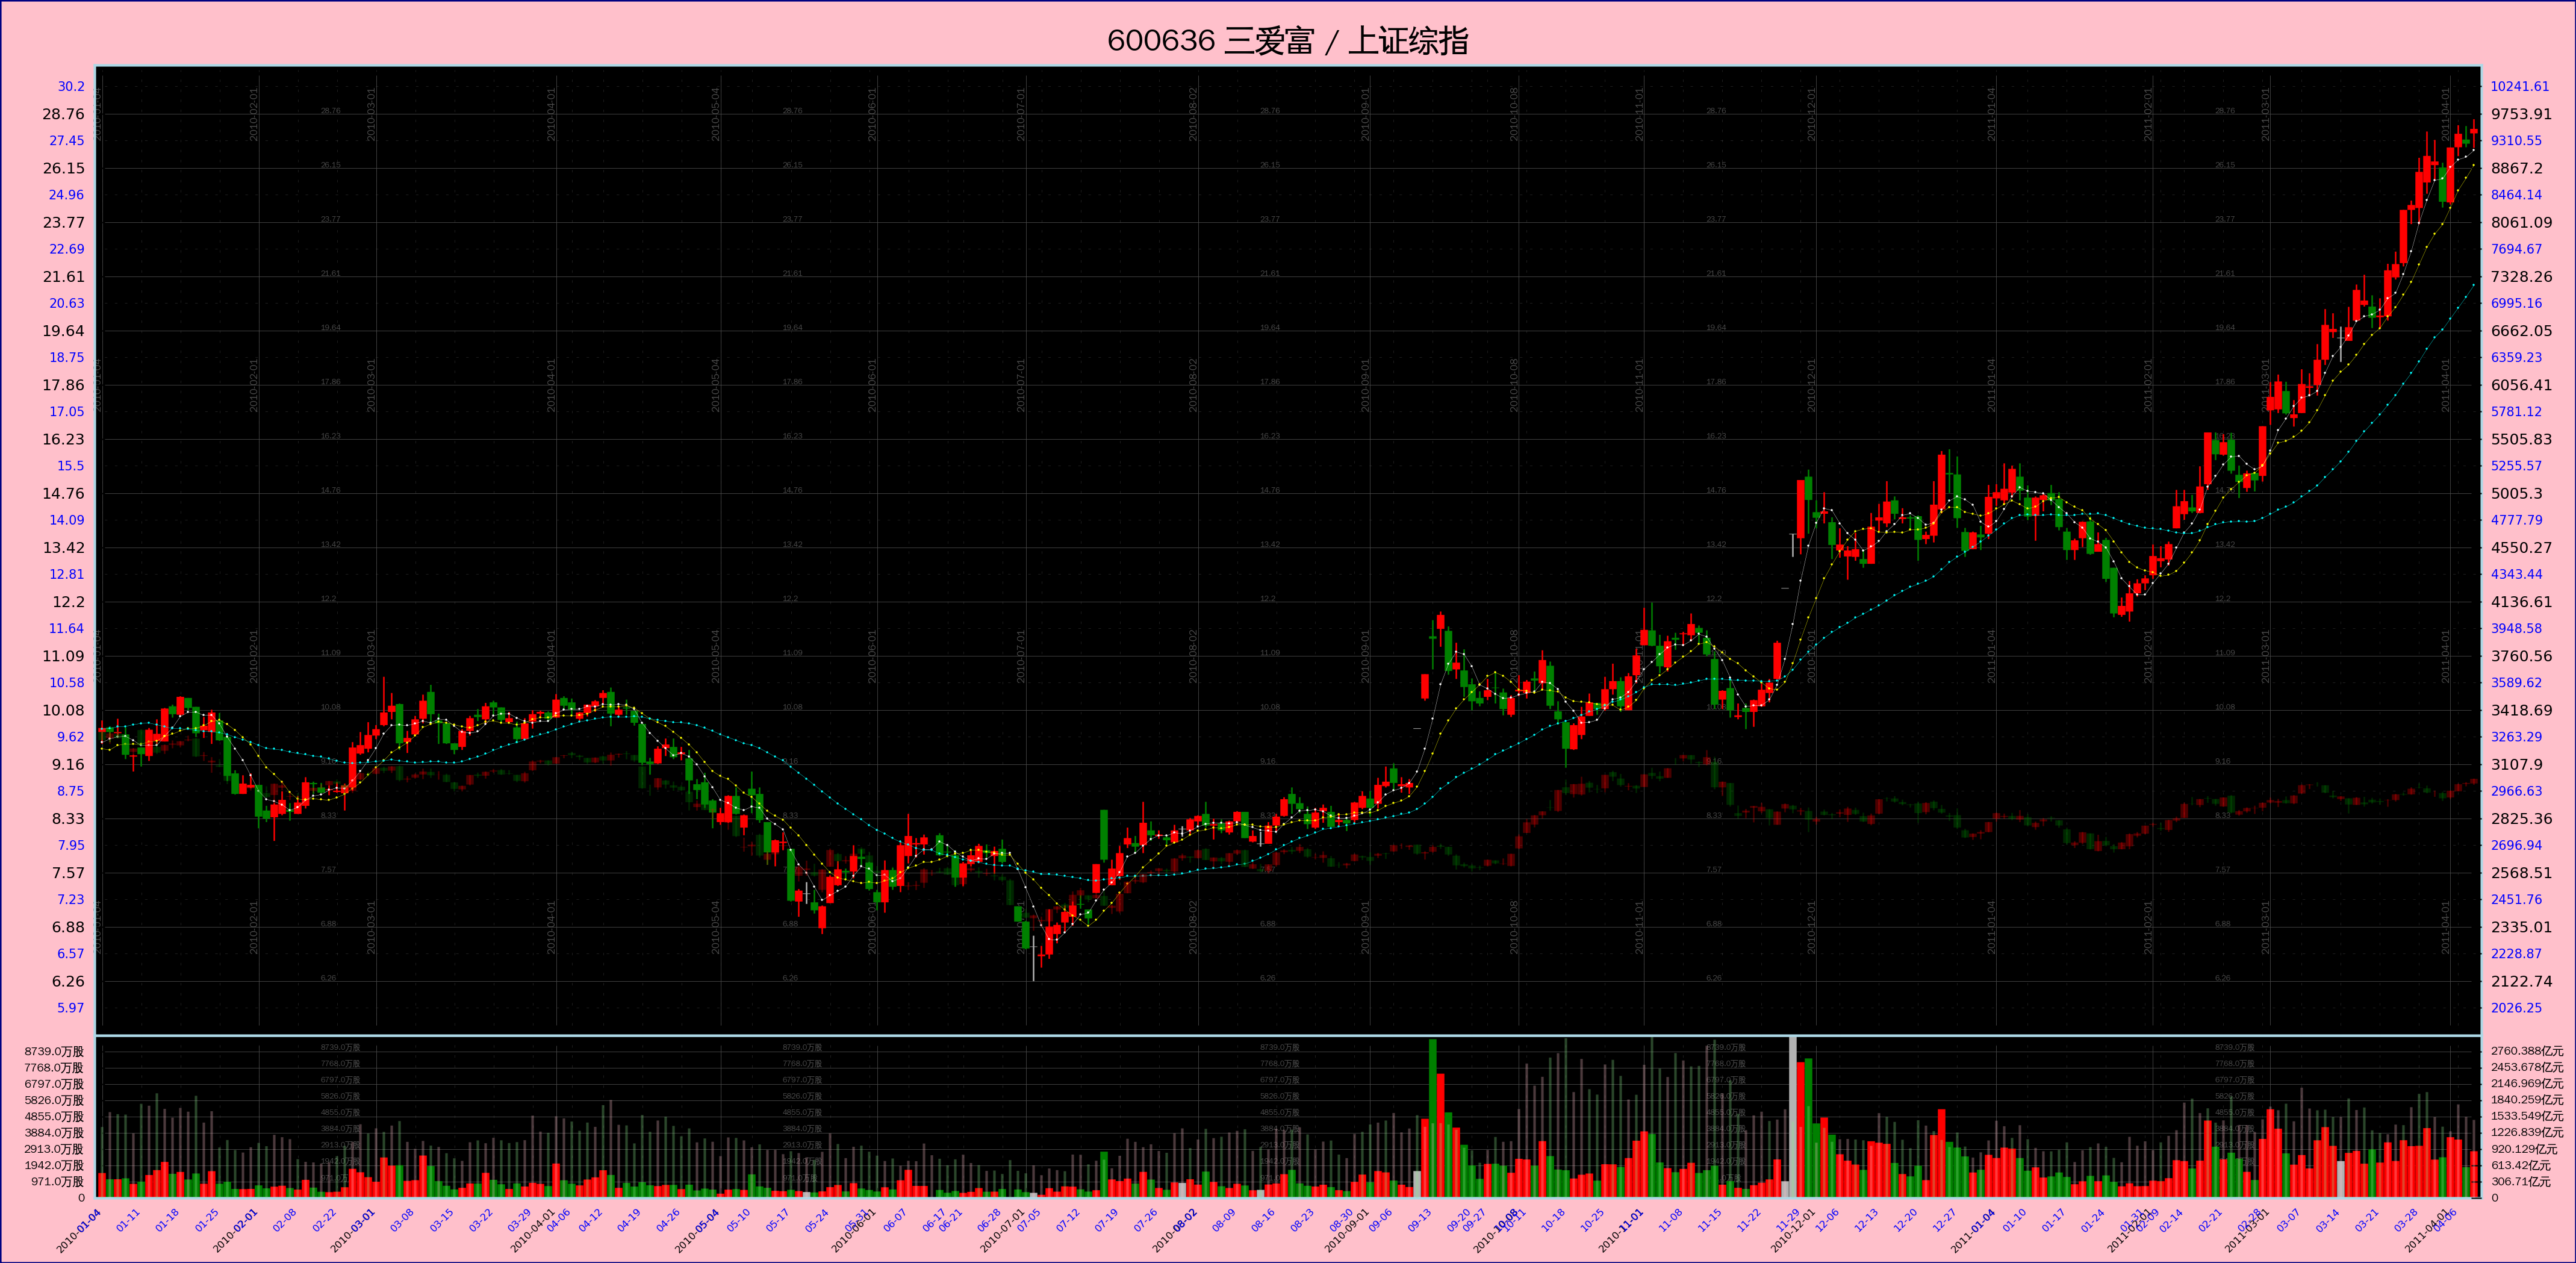
---- 上一版的改进,双股同列 + 无数细小改进,如下图。dpi= 300。明的一条是个股走势,暗的是同期的指数走势。这大概是近期最强的一只。
---- 要想培养对走势的感觉,采用固定比例尺的图形是必须的。一般股票软件里的图形都为显示方便而做了变形处理,用处不大。
---- 图形感觉差不多了,告一段落。接下来的目标是 股本结构、历史分配、行业板块、股东研究 这些信息,还包括个股资讯。实时的数据仍然暂时不碰。
---- 源码贴出来。因为 Matplotlib 还不支持 Python3, 所以单写了一个 Python2 脚本。注意绘图数据是用 pickle file 传递的。
[补记:我决定放弃线性坐标了。这个脚本只支持对数坐标。]
# -*- coding: utf-8 -*-

import os
import sys
import pickle
import math
import datetime
import matplotlib

matplotlib.use("WXAgg", warn=True)	# 这个要紧跟在 import matplotlib 之后,而且必须安装了 wxpython 2.8 才行。

import matplotlib.pyplot as pyplot
import matplotlib.font_manager as font_manager

import numpy
from matplotlib.ticker import FixedLocator, MultipleLocator, FuncFormatter, NullFormatter


__font_properties__=font_manager.FontProperties(fname='/usr/share/fonts/truetype/wqy/wqy-zenhei.ttc')
__color_lightsalmon__= '#ffa07a'
__color_pink__= '#ffc0cb'
__color_navy__= '#000080'


def Plot(pfile, figpath):
	'''
	pfile 指明存放绘图数据的 pickle file,figpath 指定图片需存放的路径
	'''

	fileobj= open(name=pfile, mode='rb')
	pdata= pickle.load(fileobj)
	fileobj.close()
	os.remove(pfile)

	#	计算图片的尺寸(单位英寸)
	#	注意:Python2 里面, "1 / 10" 结果是 0, 必须写成 "1.0 / 10" 才会得到 0.1
	#==================================================================================================================================================
	length= len(pdata[u'日期'])		# 所有数据的长度,就是天数

	open_price_pri= pdata[u'开盘'][0]	# int 类型
	open_price_sec= pdata[u'开盘二'][0]	# 同上

	highest_price_pri= max( [phigh for phigh in pdata[u'最高'] if phigh != None] )		# 第一个行情的最高价
	highest_price_sec= max( [phigh for phigh in pdata[u'最高二'] if phigh != None] )	# 第二个行情的最高价
	highest_price= max(highest_price_pri, highest_price_sec*open_price_pri/open_price_sec)	# 以第一个行情为基准修正出的总最高价

	lowest_price_pri= min( [plow for plow in pdata[u'最低'] if plow != None] )	# 最低价
	lowest_price_sec= min( [plow for plow in pdata[u'最低二'] if plow != None] )	# 最低价
	lowest_price= min(lowest_price_pri, lowest_price_sec*open_price_pri/open_price_sec)	# 以第一个行情为基准修正出的总最低价


	yhighlim_price= int(highest_price * 1.1)	# K线子图 Y 轴最大坐标
	ylowlim_price=  int(lowest_price / 1.1)		# K线子图 Y 轴最小坐标


	xfactor= 10.0/230.0	# 一条 K 线的宽度在 X 轴上所占距离(英寸)
	yfactor= 0.3	# Y 轴上每一个距离单位的长度(英寸),这个单位距离是线性坐标和对数坐标通用的

	expbase= 1.1	# 底数,取得小一点,比较接近 1。股价 3 元到 4 元之间有大约 3 个单位距离

	# XXX: 价格在 Y 轴上的 “份数”。注意,虽然最高与最低价是以第一个行情为基准修正出来的,但其中包含的倍数因子对结果无影响,即:
	#	log(base, num1) - log(base, num2) ==
	#	log(base, num1/num2) ==
	#	log(base, k*num1/k*num2) ==
	#	log(base, k*num1) - log(base, k*num2)
	# ,这是对数运算的性质。
	ymulti_price= math.log(yhighlim_price, expbase)	- math.log(ylowlim_price, expbase)

	ymulti_vol= 3.0		# 成交量部分在 Y 轴所占的 “份数”
	ymulti_top= 1.2		# 顶部空白区域在 Y 轴所占的 “份数”
	ymulti_bot= 1.2		# 底部空白区域在 Y 轴所占的 “份数”

	xmulti_left= 12.0	# 左侧空白区域所占的 “份数”
	xmulti_right= 12.0	# 右侧空白区域所占的 “份数”

	xmulti_all= length + xmulti_left + xmulti_right
	xlen_fig= xmulti_all * xfactor		# 整个 Figure 的宽度
	ymulti_all= ymulti_price + ymulti_vol + ymulti_top + ymulti_bot
	ylen_fig= ymulti_all * yfactor		# 整个 Figure 的高度

	rect_1= (xmulti_left/xmulti_all, (ymulti_bot+ymulti_vol)/ymulti_all, length/xmulti_all, ymulti_price/ymulti_all)	# K线图部分
	rect_2= (xmulti_left/xmulti_all, ymulti_bot/ymulti_all, length/xmulti_all, ymulti_vol/ymulti_all)	# 成交量部分


	#	建立 Figure 对象
	#==================================================================================================================================================
	figfacecolor= __color_pink__
	figedgecolor= __color_navy__
	figdpi= 300
	figlinewidth= 1.0

	figobj= pyplot.figure(figsize=(xlen_fig, ylen_fig), dpi=figdpi, facecolor=figfacecolor, edgecolor=figedgecolor, linewidth=figlinewidth)	# Figure 对象

	# 整个 figure 的标题
	title_pri= (pdata[u'代码'] + ' ' if u'代码' in pdata else '') + pdata[u'简称']
	title_sec= (pdata[u'代码二'] + '   ' if u'代码二' in pdata else '') + pdata[u'简称二']

	figobj.suptitle(title_pri + ' / ' + title_sec, fontsize=12, fontproperties=__font_properties__)


	#==================================================================================================================================================
	#==================================================================================================================================================
	#=======
	#=======	XXX: 第一只:成交量部分
	#=======
	#==================================================================================================================================================
	#==================================================================================================================================================

	#	第一只:添加 Axes 对象
	#==================================================================================================================================================
	axes_2= figobj.add_axes(rect_2, axis_bgcolor='black')
	axes_2.set_axisbelow(True)	# 网格线放在底层

	#	第一只:改变坐标线的颜色
	#==================================================================================================================================================
	for child in axes_2.get_children():
		if isinstance(child, matplotlib.spines.Spine):
			child.set_color('lightblue')

	#	第一只:得到 X 轴 和 Y 轴 的两个 Axis 对象
	#==================================================================================================================================================
	xaxis_2= axes_2.get_xaxis()
	yaxis_2= axes_2.get_yaxis()

	#	第一只:设置两个坐标轴上的 grid
	#==================================================================================================================================================
	xaxis_2.grid(True, 'major', color='0.3', linestyle='solid', linewidth=0.2)
	xaxis_2.grid(True, 'minor', color='0.3', linestyle='dotted', linewidth=0.1)

	yaxis_2.grid(True, 'major', color='0.3', linestyle='solid', linewidth=0.2)
	yaxis_2.grid(True, 'minor', color='0.3', linestyle='dotted', linewidth=0.1)


	#==================================================================================================================================================
	#=======	第一只:成交量绘图
	#==================================================================================================================================================
	xindex= numpy.arange(length)	# X 轴上的 index,一个辅助数据

	zipoc= zip(pdata[u'开盘'], pdata[u'收盘'])
	up=   numpy.array( [ True if po < pc and po != None else False for po, pc in zipoc] )		# 标示出该天股价日内上涨的一个序列
	down= numpy.array( [ True if po > pc and po != None else False for po, pc in zipoc] )		# 标示出该天股价日内下跌的一个序列
	side= numpy.array( [ True if po == pc and po != None else False for po, pc in zipoc] )		# 标示出该天股价日内走平的一个序列


	if u'成交额' in pdata:
		volume= pdata[u'成交额']
	else:
		volume= pdata[u'成交量']

	rarray_vol= numpy.array(volume)
	volzeros= numpy.zeros(length)	# 辅助数据

	# XXX: 如果 up/down/side 各项全部为 False,那么 vlines() 会报错。
	if True in up:
		axes_2.vlines(xindex[up], volzeros[up], rarray_vol[up], edgecolor='red', linewidth=3.0, label='_nolegend_')
	if True in down:
		axes_2.vlines(xindex[down], volzeros[down], rarray_vol[down], edgecolor='green', linewidth=3.0, label='_nolegend_')
	if True in side:
		axes_2.vlines(xindex[side], volzeros[side], rarray_vol[side], edgecolor='0.7', linewidth=3.0, label='_nolegend_')


	#	第一只:设定 X 轴坐标的范围
	#==================================================================================================================================================
	axes_2.set_xlim(-1, length)


	#	第一只:设定 X 轴上的坐标
	#==================================================================================================================================================
	datelist= [ datetime.date(int(ys), int(ms), int(ds)) for ys, ms, ds in [ dstr.split('-') for dstr in pdata[u'日期'] ] ]

	# 确定 X 轴的 MajorLocator
	mdindex= []	# 每个月第一个交易日在所有日期列表中的 index
	years= set([d.year for d in datelist])	# 所有的交易年份

	for y in sorted(years):
		months= set([d.month for d in datelist if d.year == y])		# 当年所有的交易月份
		for m in sorted(months):
			monthday= min([dt for dt in datelist if dt.year==y and dt.month==m])	# 当月的第一个交易日
			mdindex.append(datelist.index(monthday))

	xMajorLocator= FixedLocator(numpy.array(mdindex))

	# 第一只:确定 X 轴的 MinorLocator
	wdindex= {}	# value: 每周第一个交易日在所有日期列表中的 index; key: 当周的序号 week number(当周是第几周)

	for d in datelist:
		isoyear, weekno= d.isocalendar()[0:2]
		dmark= isoyear*100 + weekno
		if dmark not in wdindex:
			wdindex[dmark]= datelist.index(d)

	xMinorLocator= FixedLocator(numpy.array( sorted(wdindex.values()) ))

	# 第一只:确定 X 轴的 MajorFormatter 和 MinorFormatter
	def x_major_formatter_2(idx, pos=None):
		return datelist[idx].strftime('%Y-%m-%d')

	def x_minor_formatter_2(idx, pos=None):
		return datelist[idx].strftime('%m-%d')

	xMajorFormatter= FuncFormatter(x_major_formatter_2)
	xMinorFormatter= FuncFormatter(x_minor_formatter_2)

	# 第一只:设定 X 轴的 Locator 和 Formatter
	xaxis_2.set_major_locator(xMajorLocator)
	xaxis_2.set_major_formatter(xMajorFormatter)

	xaxis_2.set_minor_locator(xMinorLocator)
	xaxis_2.set_minor_formatter(xMinorFormatter)

	# 第一只:设定 X 轴主要坐标点与辅助坐标点的样式
	for malabel in axes_2.get_xticklabels(minor=False):
		malabel.set_fontsize(4)
		malabel.set_horizontalalignment('right')
		malabel.set_rotation('45')

	for milabel in axes_2.get_xticklabels(minor=True):
		milabel.set_fontsize(4)
		milabel.set_color('blue')
		milabel.set_horizontalalignment('right')
		milabel.set_rotation('45')


	#	第一只:设定成交量 Y 轴坐标的范围
	#==================================================================================================================================================
	maxvol= max(volume)	# 注意是 int 类型
	axes_2.set_ylim(0, maxvol)


	#	第一只:设定成交量 Y 轴上的坐标
	#==================================================================================================================================================
	vollen= len(str(maxvol))

	volstep_pri= int(round(maxvol/10.0+5000, -4))

	yMajorLocator_2= MultipleLocator(volstep_pri)


	# 第一只:确定 Y 轴的 MajorFormatter
	dimsuffix= u'元' if u'成交额' in pdata else u'股'
	def y_major_formatter_2(num, pos=None):
		if num >= 10**8:	# 大于 1 亿
			return (str(round(num/10.0**8, 2)) + u'亿' + dimsuffix) if num != 0 else '0'
		else:
			return (str(num/10.0**4) + u'万' + dimsuffix) if num != 0 else '0'

	#	def y_major_formatter_2(num, pos=None):
	#		return int(num)
	yMajorFormatter_2= FuncFormatter(y_major_formatter_2)

	# 确定 Y 轴的 MinorFormatter
	#	def y_minor_formatter_2(num, pos=None):
	#		return int(num)
	#	yMinorFormatter_2= FuncFormatter(y_minor_formatter_2)
	yMinorFormatter_2= NullFormatter()

	# 第一只:设定 X 轴的 Locator 和 Formatter
	yaxis_2.set_major_locator(yMajorLocator_2)
	yaxis_2.set_major_formatter(yMajorFormatter_2)

	#	yaxis_2.set_minor_locator(yMinorLocator_2)
	yaxis_2.set_minor_formatter(yMinorFormatter_2)

	# 第一只:设定 Y 轴主要坐标点与辅助坐标点的样式
	for malab in axes_2.get_yticklabels(minor=False):
		malab.set_font_properties(__font_properties__)
		malab.set_fontsize(4.5)	# 这个必须放在前一句后面,否则作用会被覆盖


	#	第一只:成交量数值在图中间的显示
	#==================================================================================================================================================
	for iy in range(volstep_pri, maxvol, volstep_pri):
		for ix in mdindex[1:-1:3]:
			newlab= axes_2.text(ix+8, iy, y_major_formatter_2(iy))
			newlab.set_font_properties(__font_properties__)
			newlab.set_color('0.3')
			newlab.set_fontsize(3)
			newlab.set_zorder(0)		# XXX: 放在底层
			#	newlab.set_verticalalignment('center')


	#==================================================================================================================================================
	#==================================================================================================================================================
	#=======
	#=======	XXX: 第二条成交量图线
	#=======
	#==================================================================================================================================================
	#==================================================================================================================================================

	#	添加 Axes 对象
	#==================================================================================================================================================
	axes_2_sec= axes_2.twinx()
	#	axes_2_sec.set_axisbelow(True)	# 网格线放在底层

	axes_2_sec.set_axisbelow(True)	# 网格线放在底层

	#	改变坐标线的颜色
	#==================================================================================================================================================
	#	for child in axes_2_sec.get_children():
	#		if isinstance(child, matplotlib.spines.Spine):
	#			child.set_color('lightblue')

	#	得到 X 轴 和 Y 轴 的两个 Axis 对象
	#==================================================================================================================================================
	xaxis_2_sec= axes_2_sec.get_xaxis()
	yaxis_2_sec= axes_2_sec.get_yaxis()

	#	设置两个坐标轴上的 grid
	#==================================================================================================================================================
	#	xaxis_2_sec.grid(True, 'major', color='0.3', linestyle='solid', linewidth=0.2)
	#	xaxis_2_sec.grid(True, 'minor', color='0.3', linestyle='dotted', linewidth=0.1)

	#	yaxis_2_sec.grid(True, 'major', color='0.3', linestyle='solid', linewidth=0.2)
	#	yaxis_2_sec.grid(True, 'minor', color='0.3', linestyle='dotted', linewidth=0.1)


	#==================================================================================================================================================
	#=======	绘图
	#==================================================================================================================================================

	if u'成交额二' in pdata:
		volume_sec= pdata[u'成交额二']
	else:
		volume_sec= pdata[u'成交量二']

	zipoc_sec= zip(pdata[u'开盘二'], pdata[u'收盘二'])
	up_sec=   numpy.array( [ True if po < pc and po != None else False for po, pc in zipoc_sec] )		# 标示出该天股价日内上涨的一个序列
	down_sec= numpy.array( [ True if po > pc and po != None else False for po, pc in zipoc_sec] )		# 标示出该天股价日内下跌的一个序列
	side_sec= numpy.array( [ True if po == pc and po != None else False for po, pc in zipoc_sec] )		# 标示出该天股价日内走平的一个序列

	rarray_vol_sec= numpy.array(volume_sec)
	volzeros_sec= numpy.zeros(length)	# 辅助数据

	# XXX: 如果 up_sec/down_sec/side_sec 各项全部为 False,那么 vlines() 会报错。
	if True in up_sec:
		axes_2_sec.vlines(xindex[up_sec], volzeros_sec[up_sec], rarray_vol_sec[up_sec], edgecolor='pink', linewidth=1.0, label='_nolegend_', alpha=0.3)
	if True in down_sec:
		axes_2_sec.vlines(xindex[down_sec], volzeros_sec[down_sec], rarray_vol_sec[down_sec], edgecolor='lightgreen', linewidth=1.0, label='_nolegend_', alpha=0.3)
	if True in side_sec:
		axes_2_sec.vlines(xindex[side_sec], volzeros_sec[side_sec], rarray_vol_sec[side_sec], edgecolor='0.7', linewidth=1.0, label='_nolegend_', alpha=0.3)


	#	设定 X 轴坐标的范围
	#==================================================================================================================================================
	#	XXX: 不用了,与 axes_2 共用。


	#	设定 Y 轴坐标的范围
	#==================================================================================================================================================
	maxvol_sec= max(volume_sec)	# 注意是 int 类型
	axes_2_sec.set_ylim(0, maxvol_sec)


	#	设定 Y 轴上的坐标
	#==================================================================================================================================================

	volstep_sec= volstep_pri*maxvol_sec/float(maxvol)
	yMajorLocator_2_sec= MultipleLocator(volstep_sec)

	# 确定 Y 轴的 MajorFormatter
	dimsuffix_sec= u'元' if u'成交额二' in pdata else u'股'
	def y_major_formatter_2_sec(num, pos=None):
		if num >= 10**8:	# 大于 1 亿
			print(('num= ' + str(num) + ', result= ' + str(round(num/10.0**8, 3)) + u'亿' + dimsuffix_sec).encode('utf8'))

			return (str(round(num/10.0**8, 3)) + u'亿' + dimsuffix_sec) if num != 0 else '0'
		else:
			return (str(round(num/10.0**4, 2)) + u'万' + dimsuffix_sec) if num != 0 else '0'

	#	def y_major_formatter_2_sec(num, pos=None):
	#		return int(num)
	yMajorFormatter_2_sec= FuncFormatter(y_major_formatter_2_sec)

	# 确定 Y 轴的 MinorFormatter
	#	def y_minor_formatter_2(num, pos=None):
	#		return int(num)
	#	yMinorFormatter_2_sec= FuncFormatter(y_minor_formatter_2)
	yMinorFormatter_2_sec= NullFormatter()

	# 设定 X 轴的 Locator 和 Formatter
	yaxis_2_sec.set_major_locator(yMajorLocator_2_sec)
	yaxis_2_sec.set_major_formatter(yMajorFormatter_2_sec)

	#	yaxis_2_sec.set_minor_locator(yMinorLocator_2_sec)
	yaxis_2_sec.set_minor_formatter(yMinorFormatter_2_sec)

	# 设定 Y 轴主要坐标点与辅助坐标点的样式
	for malab in axes_2_sec.get_yticklabels(minor=False):
		malab.set_font_properties(__font_properties__)
		malab.set_fontsize(4.5)	# 这个必须放在前一句后面,否则作用会被覆盖


	#==================================================================================================================================================
	#==================================================================================================================================================
	#=======
	#=======	XXX: K 线图部分
	#=======
	#==================================================================================================================================================
	#==================================================================================================================================================

	#	添加 Axes 对象
	#==================================================================================================================================================
	axes_1= figobj.add_axes(rect_1, axis_bgcolor='black', sharex=axes_2)
	axes_1.set_axisbelow(True)	# 网格线放在底层

	axes_1.set_yscale('log', basey=expbase)		# 使用对数坐标

	#	改变坐标线的颜色
	#==================================================================================================================================================
	for child in axes_1.get_children():
		if isinstance(child, matplotlib.spines.Spine):
			child.set_color('lightblue')

	#	得到 X 轴 和 Y 轴 的两个 Axis 对象
	#==================================================================================================================================================
	xaxis_1= axes_1.get_xaxis()
	yaxis_1= axes_1.get_yaxis()

	#	设置两个坐标轴上的 grid
	#==================================================================================================================================================
	xaxis_1.grid(True, 'major', color='0.3', linestyle='solid', linewidth=0.2)
	xaxis_1.grid(True, 'minor', color='0.3', linestyle='dotted', linewidth=0.1)

	yaxis_1.grid(True, 'major', color='0.3', linestyle='solid', linewidth=0.2)
	yaxis_1.grid(True, 'minor', color='0.3', linestyle='dotted', linewidth=0.1)


	#==================================================================================================================================================
	#=======	绘图
	#==================================================================================================================================================

	#	绘制 K 线部分
	#==================================================================================================================================================

	#	对开收盘价进行视觉修正
	for idx, poc in enumerate( zip(pdata[u'开盘'], pdata[u'收盘']) ):
		if poc[0] == poc[1] and None not in poc:
			variant= round((poc[1]+1000)/2000, 0)
			pdata[u'开盘'][idx]= poc[0] - variant		# 稍微偏离一点,使得在图线上不致于完全看不到
			pdata[u'收盘'][idx]= poc[1] + variant

	rarray_open= numpy.array(pdata[u'开盘'])
	rarray_close= numpy.array(pdata[u'收盘'])
	rarray_high= numpy.array(pdata[u'最高'])
	rarray_low= numpy.array(pdata[u'最低'])

	# XXX: 如果 up, down, side 里有一个全部为 False 组成,那么 vlines() 会报错。
	# XXX: 可以使用 alpha 参数调节透明度
	if True in up:
		axes_1.vlines(xindex[up], rarray_low[up], rarray_high[up], edgecolor='red', linewidth=0.6, label='_nolegend_')
		axes_1.vlines(xindex[up], rarray_open[up], rarray_close[up], edgecolor='red', linewidth=3.0, label='_nolegend_')

	if True in down:
		axes_1.vlines(xindex[down], rarray_low[down], rarray_high[down], edgecolor='green', linewidth=0.6, label='_nolegend_')
		axes_1.vlines(xindex[down], rarray_open[down], rarray_close[down], edgecolor='green', linewidth=3.0, label='_nolegend_')

	if True in side:
		axes_1.vlines(xindex[side], rarray_low[side], rarray_high[side], edgecolor='0.7', linewidth=0.6, label='_nolegend_')
		axes_1.vlines(xindex[side], rarray_open[side], rarray_close[side], edgecolor='0.7', linewidth=3.0, label='_nolegend_')

	#	绘制均线部分
	#==================================================================================================================================================
	if u'5日均' in pdata:
		rarray_5dayave= numpy.array(pdata[u'5日均'])
		axes_1.plot(xindex, rarray_5dayave, 'o-', color='white', linewidth=0.1, label='ave_5', \
			markersize=0.7, markeredgecolor='white', markeredgewidth=0.1)	# 5日均线

	if u'10日均' in pdata:
		rarray_10dayave= numpy.array(pdata[u'10日均'])
		axes_1.plot(xindex, rarray_10dayave, 'o-', color='yellow', linewidth=0.1, label='ave_10', \
			markersize=0.7, markeredgecolor='yellow', markeredgewidth=0.1)	# 10日均线

	if u'30日均' in pdata:
		rarray_30dayave= numpy.array(pdata[u'30日均'])
		axes_1.plot(xindex, rarray_30dayave, 'o-', color='cyan', linewidth=0.1, label='ave_30', \
			markersize=0.7, markeredgecolor='cyan', markeredgewidth=0.1)	# 30日均线


	#	绘制 复权提示
	#==================================================================================================================================================
	if u'复权' in pdata:
		adjdict= dict(pdata[u'复权'])

		for idx, dstr in enumerate(pdata[u'日期']):
			if dstr in adjdict:
				axes_1.plot([idx, idx], [ylowlim_price, yhighlim_price], '-', color='purple', linewidth=0.3)


	#	设定 X 轴坐标的范围
	#==================================================================================================================================================
	axes_1.set_xlim(-1, length)


	#	先设置 label 位置,再将 X 轴上的坐标设为不可见。因为与 成交量子图 共用 X 轴
	#==================================================================================================================================================

	# 设定 X 轴的 Locator 和 Formatter
	xaxis_1.set_major_locator(xMajorLocator)
	xaxis_1.set_major_formatter(xMajorFormatter)

	xaxis_1.set_minor_locator(xMinorLocator)
	xaxis_1.set_minor_formatter(xMinorFormatter)

	# 将 X 轴上的坐标设为不可见。
	for malab in axes_1.get_xticklabels(minor=False):
		malab.set_visible(False)

	for milab in axes_1.get_xticklabels(minor=True):
		milab.set_visible(False)

	# 用这一段效果也一样
	#	pyplot.setp(axes_1.get_xticklabels(minor=False), visible=False)
	#	pyplot.setp(axes_1.get_xticklabels(minor=True), visible=False)


	#	设定 Y 轴坐标的范围
	#==================================================================================================================================================
	axes_1.set_ylim(ylowlim_price, yhighlim_price)


	#	设定 Y 轴上的坐标
	#==================================================================================================================================================

	# XXX: 不用 LogLocator 了,因为不能控制坐标点的位置。

	#	主要坐标点
	#----------------------------------------------------------------------------
	yticks_major_pri= []
	for i in range(1, 999):
		newloc= ylowlim_price * (expbase**i)
		if newloc <= yhighlim_price:
			yticks_major_pri.append(newloc)
		else:
			break

	yMajorLocator_1= FixedLocator(numpy.array(yticks_major_pri))

	# 确定 Y 轴的 MajorFormatter
	def y_major_formatter_1(num, pos=None):
		return str(round(num/1000.0, 2))

	yMajorFormatter_1= FuncFormatter(y_major_formatter_1)

	# 设定 X 轴的 Locator 和 Formatter
	yaxis_1.set_major_locator(yMajorLocator_1)
	yaxis_1.set_major_formatter(yMajorFormatter_1)

	# 设定 Y 轴主要坐标点与辅助坐标点的样式
	for mal in axes_1.get_yticklabels(minor=False):
		mal.set_fontsize(6)


	#	辅助坐标点
	#----------------------------------------------------------------------------
	yticks_minor_pri= []
	mtstart= ylowlim_price * (1.0+(expbase-1.0)/2)
	for i in range(999):
		newloc= mtstart * (expbase**i)
		if newloc <= yhighlim_price:
			yticks_minor_pri.append(newloc)
		else:
			break

	yMinorLocator_1= FixedLocator(numpy.array(yticks_minor_pri))		# XXX minor ticks 已经在上面一并设置,这里不需要了。

	# 确定 Y 轴的 MinorFormatter
	def y_minor_formatter_1(num, pos=None):
		return str(round(num/1000.0, 2))

	yMinorFormatter_1= FuncFormatter(y_minor_formatter_1)

	# 设定 X 轴的 Locator 和 Formatter
	yaxis_1.set_minor_locator(yMinorLocator_1)
	yaxis_1.set_minor_formatter(yMinorFormatter_1)
	# 设定 Y 轴主要坐标点与辅助坐标点的样式
	for mal in axes_1.get_yticklabels(minor=True):
		mal.set_fontsize(5)
		mal.set_color('blue')


	#	第一只:价格数值在图中间的显示
	#==================================================================================================================================================
	for iy in yticks_major_pri:
		for ix in mdindex[1:-1:3]:
			newlab= axes_1.text(ix+8, iy*1.001, y_major_formatter_1(iy))
			newlab.set_font_properties(__font_properties__)
			newlab.set_color('0.3')
			newlab.set_fontsize(3)
			newlab.set_zorder(0)		# XXX: 放在底层
			#	newlab.set_verticalalignment('center')


	#	第一只:日期在图中间的显示
	#==================================================================================================================================================
	for iy in yticks_minor_pri[1:-1:5]:
		for ix in mdindex:
			newlab= axes_1.text(ix-1, iy, pdata[u'日期'][ix])
			newlab.set_font_properties(__font_properties__)
			newlab.set_color('0.3')
			newlab.set_fontsize(4)
			newlab.set_rotation('vertical')
			#	newlab.set_horizontalalignment('left')
			#	newlab.set_verticalalignment('bottom')
			newlab.set_zorder(0)		# XXX: 放在底层
			#	newlab.set_verticalalignment('center')


	#==================================================================================================================================================
	#==================================================================================================================================================
	#=======
	#=======	XXX: 第二条 K 线图
	#=======
	#==================================================================================================================================================
	#==================================================================================================================================================

	#	添加 Axes 对象
	#==================================================================================================================================================
	axes_1_sec= axes_1.twinx()
	#	axes_1_sec.set_axisbelow(True)	# 网格线放在底层

	axes_1_sec.set_yscale('log', basey=expbase)	# 使用对数坐标


	#	得到 X 轴 和 Y 轴 的两个 Axis 对象
	#==================================================================================================================================================
	xaxis_1_sec= axes_1_sec.get_xaxis()
	yaxis_1_sec= axes_1_sec.get_yaxis()


	#==================================================================================================================================================
	#=======	绘图
	#==================================================================================================================================================

	#	绘制 K 线部分
	#==================================================================================================================================================

	#	对开收盘价进行视觉修正
	for idx, poc in enumerate( zipoc_sec ):
		if poc[0] == poc[1] and None not in poc:
			pdata[u'开盘二'][idx]= poc[0] - 5		# 稍微偏离一点,使得在图线上不致于完全看不到
			pdata[u'收盘二'][idx]= poc[1] + 5

	rarray_open= numpy.array(pdata[u'开盘二'])
	rarray_close= numpy.array(pdata[u'收盘二'])
	rarray_high= numpy.array(pdata[u'最高二'])
	rarray_low= numpy.array(pdata[u'最低二'])

	# XXX: 如果 up_sec, down_sec, side_sec 里有一个全部为 False 组成,那么 vlines() 会报错。
	# XXX: 可以使用 alpha 参数调节透明度
	if True in up_sec:
		axes_1_sec.vlines(xindex[up_sec], rarray_low[up_sec], rarray_high[up_sec], edgecolor='red', linewidth=0.6, label='_nolegend_', alpha=0.3)
		axes_1_sec.vlines(xindex[up_sec], rarray_open[up_sec], rarray_close[up_sec], edgecolor='red', linewidth=3.0, label='_nolegend_', alpha=0.3)

	if True in down_sec:
		axes_1_sec.vlines(xindex[down_sec], rarray_low[down_sec], rarray_high[down_sec], edgecolor='green', linewidth=0.6, label='_nolegend_', alpha=0.3)
		axes_1_sec.vlines(xindex[down_sec], rarray_open[down_sec], rarray_close[down_sec], edgecolor='green', linewidth=3.0, label='_nolegend_', alpha=0.3)

	if True in side_sec:
		axes_1_sec.vlines(xindex[side_sec], rarray_low[side_sec], rarray_high[side_sec], edgecolor='0.7', linewidth=0.6, label='_nolegend_', alpha=0.3)
		axes_1_sec.vlines(xindex[side_sec], rarray_open[side_sec], rarray_close[side_sec], edgecolor='0.7', linewidth=3.0, label='_nolegend_', alpha=0.3)


	#	设定 X 轴坐标的范围
	#==================================================================================================================================================
	axes_1_sec.set_xlim(-1, length)


	#	先设置 label 位置,再将 X 轴上的坐标设为不可见。因为与 成交量子图 共用 X 轴
	#==================================================================================================================================================

	# 设定 X 轴的 Locator 和 Formatter
	xaxis_1_sec.set_major_locator(xMajorLocator)
	xaxis_1_sec.set_major_formatter(xMajorFormatter)

	xaxis_1_sec.set_minor_locator(xMinorLocator)
	xaxis_1_sec.set_minor_formatter(xMinorFormatter)

	# 将 X 轴上的坐标设为不可见。
	for malab in axes_1_sec.get_xticklabels(minor=False):
		malab.set_visible(False)

	for milab in axes_1_sec.get_xticklabels(minor=True):
		milab.set_visible(False)


	#	设定 Y 轴坐标的范围
	#==================================================================================================================================================
	axes_1_sec.set_ylim(ylowlim_price*open_price_sec/open_price_pri, yhighlim_price*open_price_sec/open_price_pri)


	#	设定 Y 轴上的坐标
	#==================================================================================================================================================

	#	主要坐标点
	#----------------------------------------------------------------------------
	yticks_major_sec= []
	ylowlim_price_sec=  ylowlim_price*open_price_sec/open_price_pri
	yhighlim_price_sec= yhighlim_price*open_price_sec/open_price_pri

	for i in range(1, 999):
		newloc= ylowlim_price_sec * (expbase**i)
		if newloc <= yhighlim_price_sec:
			yticks_major_sec.append(newloc)
		else:
			break

	yMajorLocator_1_sec= FixedLocator(numpy.array(yticks_major_sec))

	# 确定 Y 轴的 MajorFormatter
	def y_major_formatter_1_sec(num, pos=None):
		return str(round(num/1000.0, 2))

	yMajorFormatter_1_sec= FuncFormatter(y_major_formatter_1_sec)

	# 设定 X 轴的 Locator 和 Formatter
	yaxis_1_sec.set_major_locator(yMajorLocator_1_sec)
	yaxis_1_sec.set_major_formatter(yMajorFormatter_1_sec)

	# 设定 Y 轴主要坐标点与辅助坐标点的样式
	for mal in axes_1_sec.get_yticklabels(minor=False):
		mal.set_fontsize(6)


	#	辅助坐标点
	#----------------------------------------------------------------------------
	yticks_minor_sec= []
	mtstart_sec= ylowlim_price_sec * (1.0+(expbase-1.0)/2)
	for i in range(999):
		newloc= mtstart_sec * (expbase**i)
		if newloc <= yhighlim_price_sec:
			yticks_minor_sec.append(newloc)
		else:
			break

	yMinorLocator_1_sec= FixedLocator(numpy.array(yticks_minor_sec))		# XXX minor ticks 已经在上面一并设置,这里不需要了。

	# 确定 Y 轴的 MinorFormatter
	def y_minor_formatter_1_sec(num, pos=None):
		return str(round(num/1000.0, 2))

	yMinorFormatter_1_sec= FuncFormatter(y_minor_formatter_1_sec)

	# 设定 X 轴的 Locator 和 Formatter
	yaxis_1_sec.set_minor_locator(yMinorLocator_1_sec)
	yaxis_1_sec.set_minor_formatter(yMinorFormatter_1_sec)
	# 设定 Y 轴主要坐标点与辅助坐标点的样式
	for mal in axes_1_sec.get_yticklabels(minor=True):
		mal.set_fontsize(5)
		mal.set_color('blue')


	#	显示图片
	#==================================================================================================================================================
	#	pyplot.show()

	#	保存图片
	#==================================================================================================================================================
	figobj.savefig(figpath, dpi=figdpi, facecolor=figfacecolor, edgecolor=figedgecolor, linewidth=figlinewidth)


if __name__ == '__main__':
	Plot(pfile=sys.argv[1], figpath=sys.argv[2])
2011年4月10日 10:54
已有一个matplotlib分支开始支持py3,新闻在这里:http://pythonsprints.com/2011/04/8/matplotlib-python-3-thanks-cape-town-group/
2011年4月10日 12:18
@amao: 矮油,这个好消息 :-) 谢谢啦。
2011年5月28日 04:13
abc125318@qq.com 求代码,我也在研究,感觉好复杂,还有一个问题,实时的坐标移动,不知道实现了没有
2011年5月29日 12:58
@luffy: 已经贴出来了啊!
2011年5月30日 09:49
@Jacky Liu: 复制不了。。。
2011年5月30日 09:50
我现在倒是想要用PYQT4来实现,好麻烦啊,要写好多代码
2011年11月10日 19:49
Liked the output. Cant seem to find the input file? Do you have an example of the cpickled inputfile?
2011年11月10日 21:37
@ano: it's not worth it to make up a new post 'cause the change is subtle, leave me an email and I'll send you the newest version of the script along with the example input file.
2013年1月06日 21:10
py3的支持windows下有http://www.lfd.uci.edu/~gohlke/pythonlibs/#matplotlib
linux下反正我用的opensuse有第三方库支持py3的
2013年2月22日 09:24
博主,您好。能给我发份数据文件吗?
另外,你现在实时了实时数据的刷新显示么?另外能实现滚轴缩放吗?
2013年3月08日 15:16
@wizardyhnr:
现在官方的 1.2.0 版已经全面支持 py3, 忒好了 :)
2013年3月08日 15:17
@fish1207:
第三篇里已经贴出来了。找见了吧?
2013年3月09日 15:57
@Jacky Liu: 找到了,谢谢哦额
2013年4月13日 15:18
Hi Jacky, I see in the previous posts that you offered to post the latest version of the script and pickle file. Can you please send this to me at the email address I submitted?
2013年4月13日 16:14
@venzen: Well,actually I already wrote a new blog about it, just follow the link up there in this blog, pickled input file also included. Note that these are py2 scripts as Matplotlib was not py3 compatible back then.
2016年11月14日 14:40
为什么在MacOS上不能运行?
遇到:
File "/Users/open/PycharmProjects/kseries/Public/Public.py", line 97, in TempLogger
os.mknod(filename, 0o700)
PermissionError: [Errno 1] Operation not permitted
2017年7月20日 16:15
厉害了 我的哥..我也正好用用你写的,多谢楼主!
2020年4月24日 15:27
敬启者:个人小网站希望大家多多支持 感谢您对我们热心的支持 f88tw┃华歌尔┃I appreciate your kind assistance. f88tw|墓园|捡骨流程|捡骨费用|捡骨时间|禁忌|捡骨颜色|捡骨师|新竹|时间|台北|桃园|苗栗|头份|火化|晋塔|安葬|法事|捡骨|看日子|墓穴|墓园|坟墓|看日子|乞丐|http://mypaper.m.pchome.com.tw/f88tw
2021年4月09日 14:47
敬启者:个人小网站希望大家多多支持 感谢您对我们热心的支持 f88tw┃华歌尔┃I appreciate your kind assistance. f88tw| 粗工| 粗工内容 | 粗工| 粗工内容 |墓园|捡骨流程|捡骨费用|捡骨时间|禁忌|捡骨颜色|捡骨师|新竹|时间|台北|桃园|苗栗|头份|https://mypaper.m.pchome.com.tw/f88tw
2022年9月09日 12:36
The BSEH Model Paper 2023 Class 1 Pdf has been created and recommended by subject specialists and members of the teaching team at the school. It includes study & learning aids for all of the course's languages and disciplines. HBSE Model Paper They created a question bank for every subject in accordance with the recently revised curriculum. The Board of School Education, Haryana (BSEH) Bhiwani Board has released the Elementary Education Primary School STD-1 Question Paper Designs as a Haryana Board STD-1 Model Paper 2023 Pdf with sample answers for students in both mediums enrolled in SCERT and NCERT Syllabus Government & Private Schools in the state.
2024年1月14日 19:16
Regular visits listed here are the easiest method to appreciate your energy, which is why why I am going to the website everyday, searching for new, interesting info. Many, thank you!